


The European Club Finance and Investment Landscape

This report is the second of two produced during this season where UEFA’s Intelligence Centre explores and analyses the European football landscape and documents the successes and challenges of European club football.
REVENUE GROWTH GATHERS PACE

€26.8bn
Top division club revenues reached a record level of €26.8bn in the 2023 financial year.
€2.9bn
The €2.9bn revenue increase between 2022 and 2023 is the largest single year increase on record. Early-reported data suggests 2024 will be the second highest increase on record.
€29bn +
Based on early club revenue submissions, top division club revenue is anticipated to grow beyond €29bn in the 2024 financial year.
RECORD CROWDS… RECORD REVENUES
Top division club revenues reached €24bn in 2022, increasing over €10bn in the last decade and will push further beyond €26bn in 2023.
Revenue stream evolution
The primary source of new club revenues has changed from TV (2009-2019) to commercial and gate revenues (2019-2024).
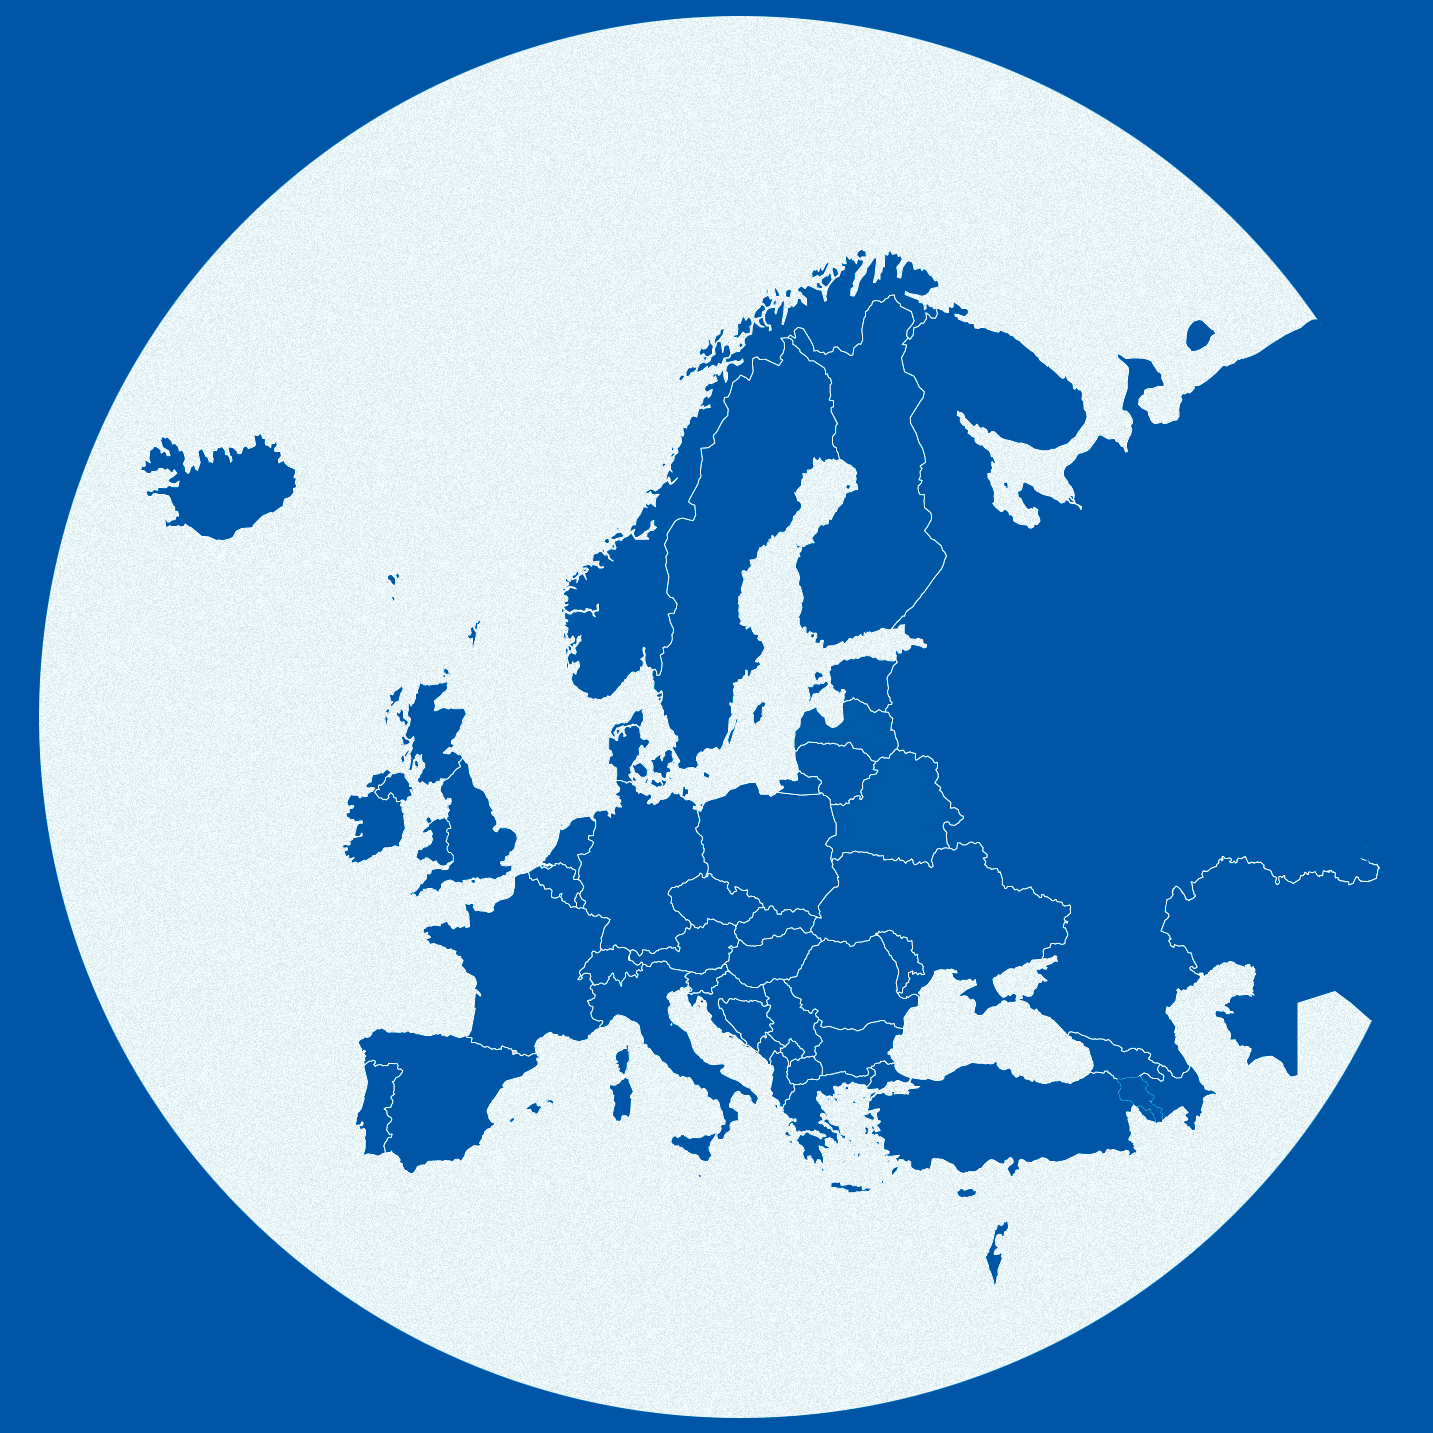
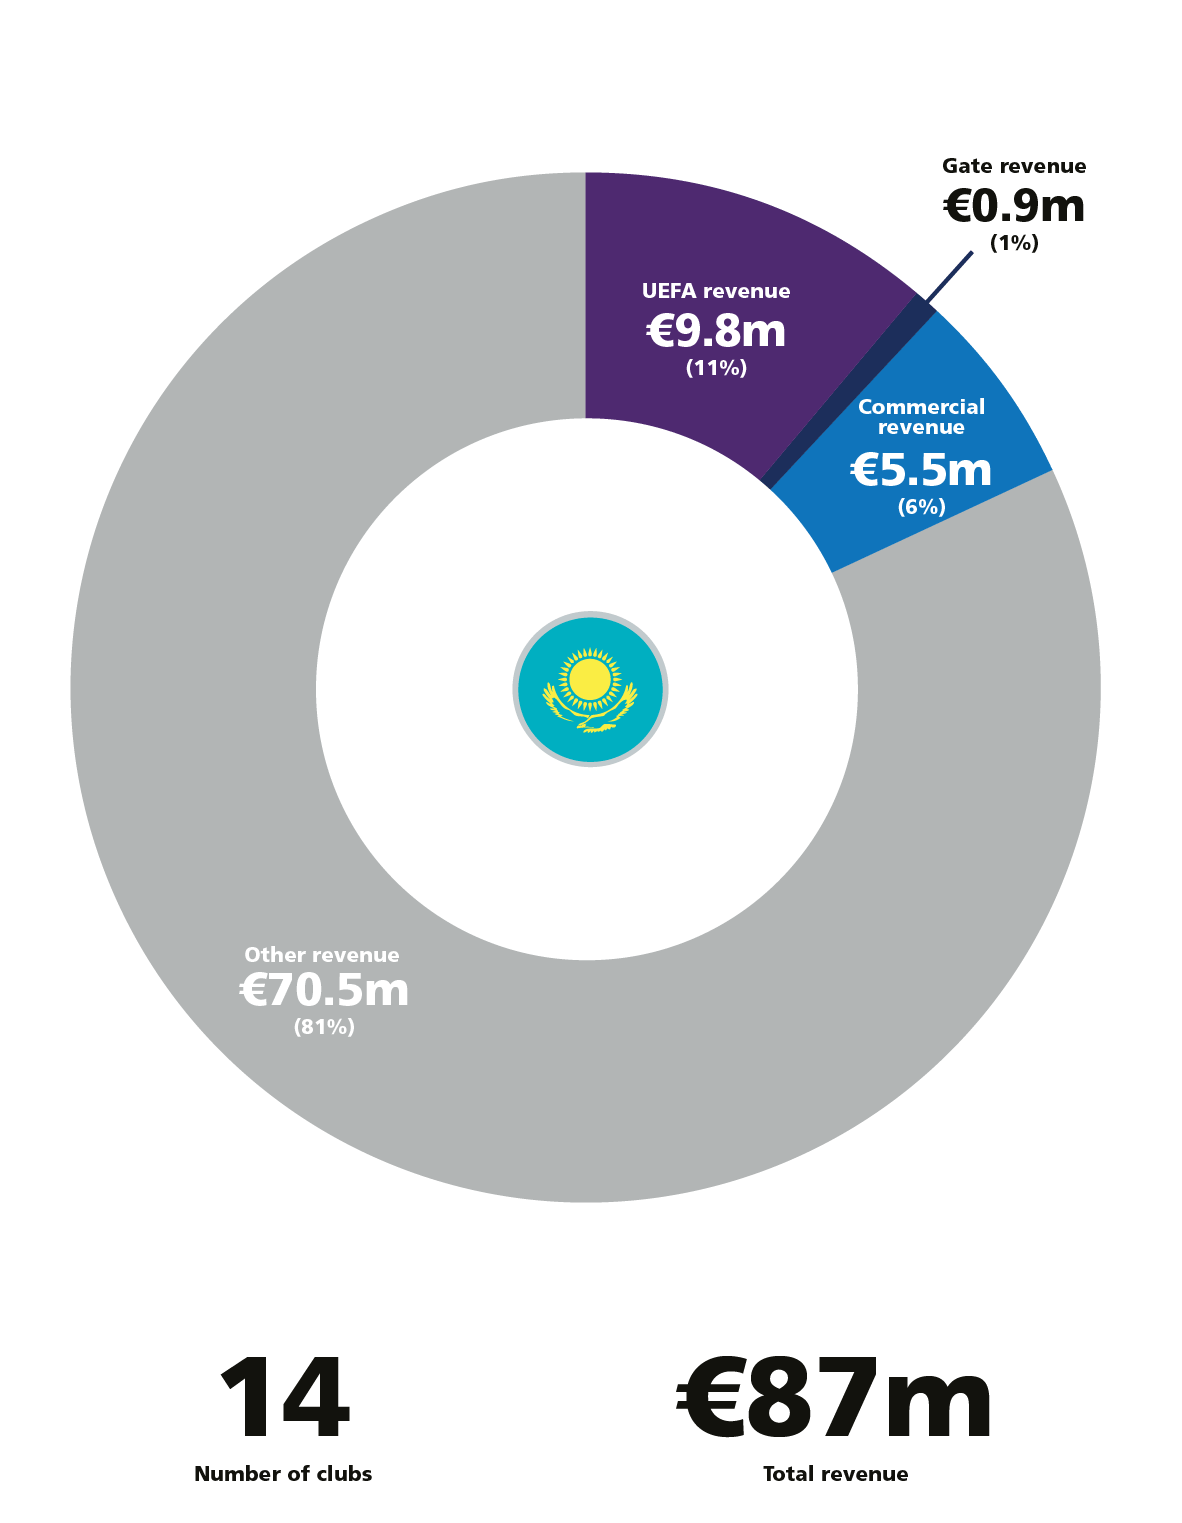
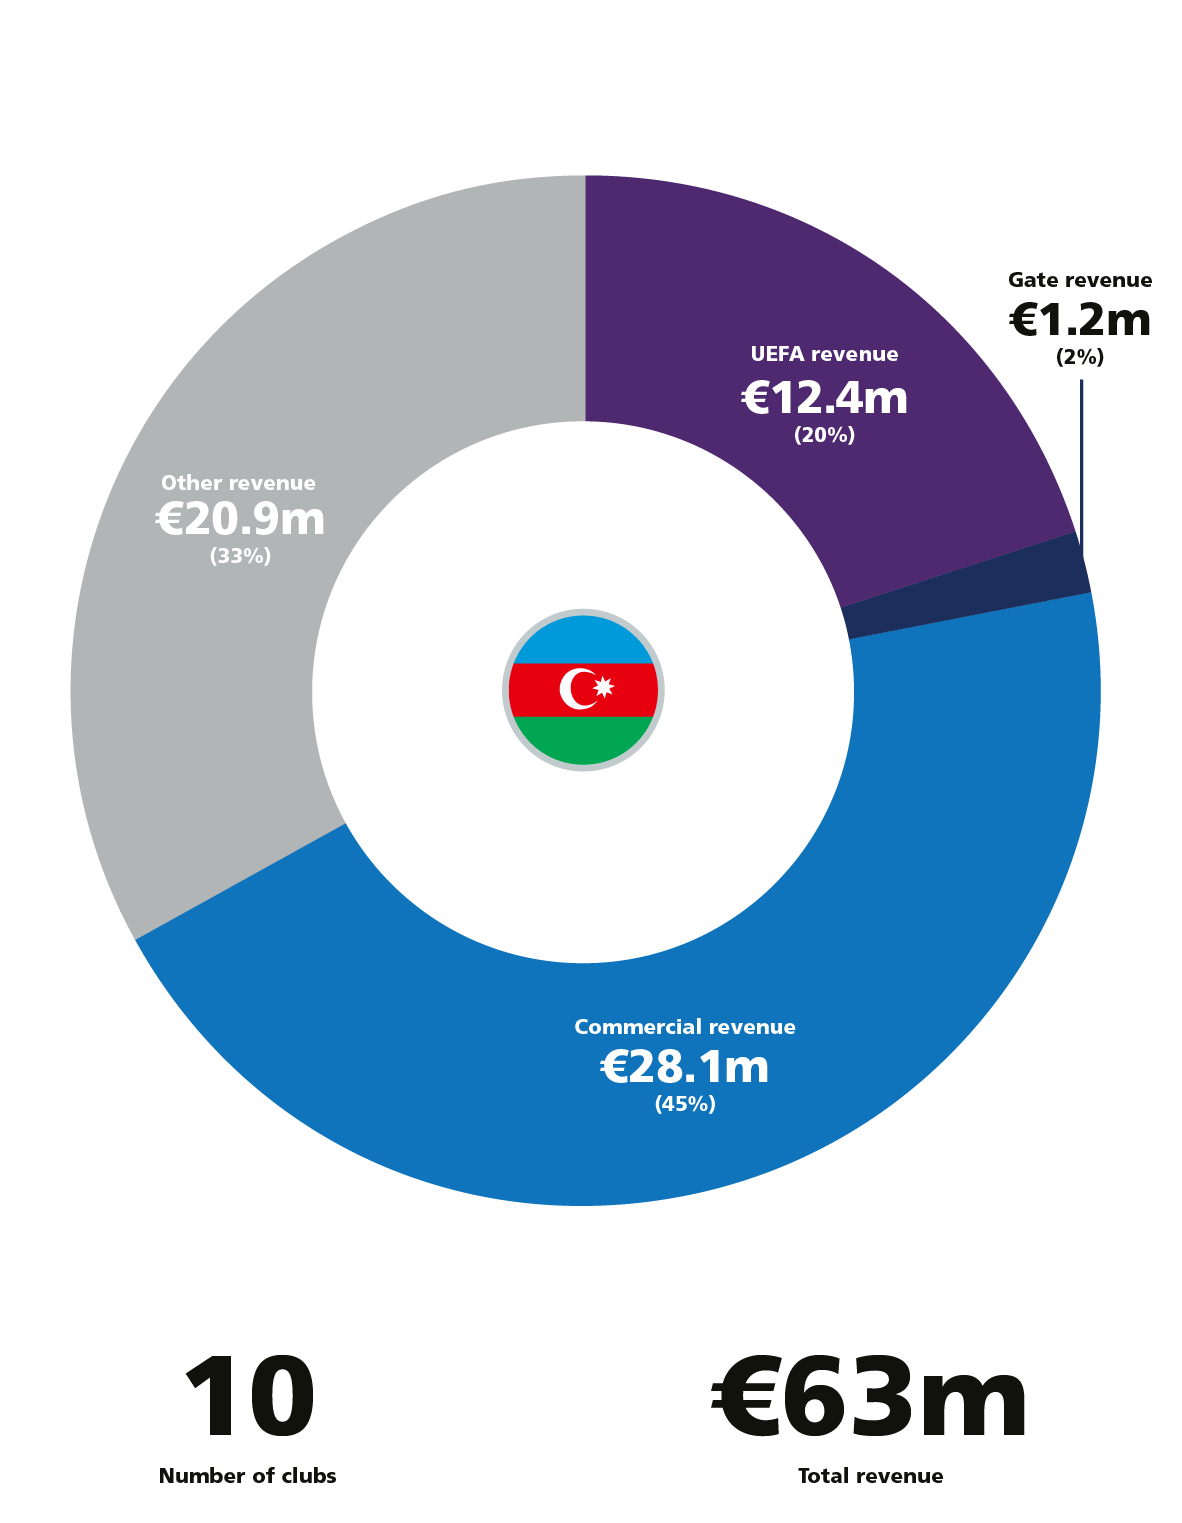
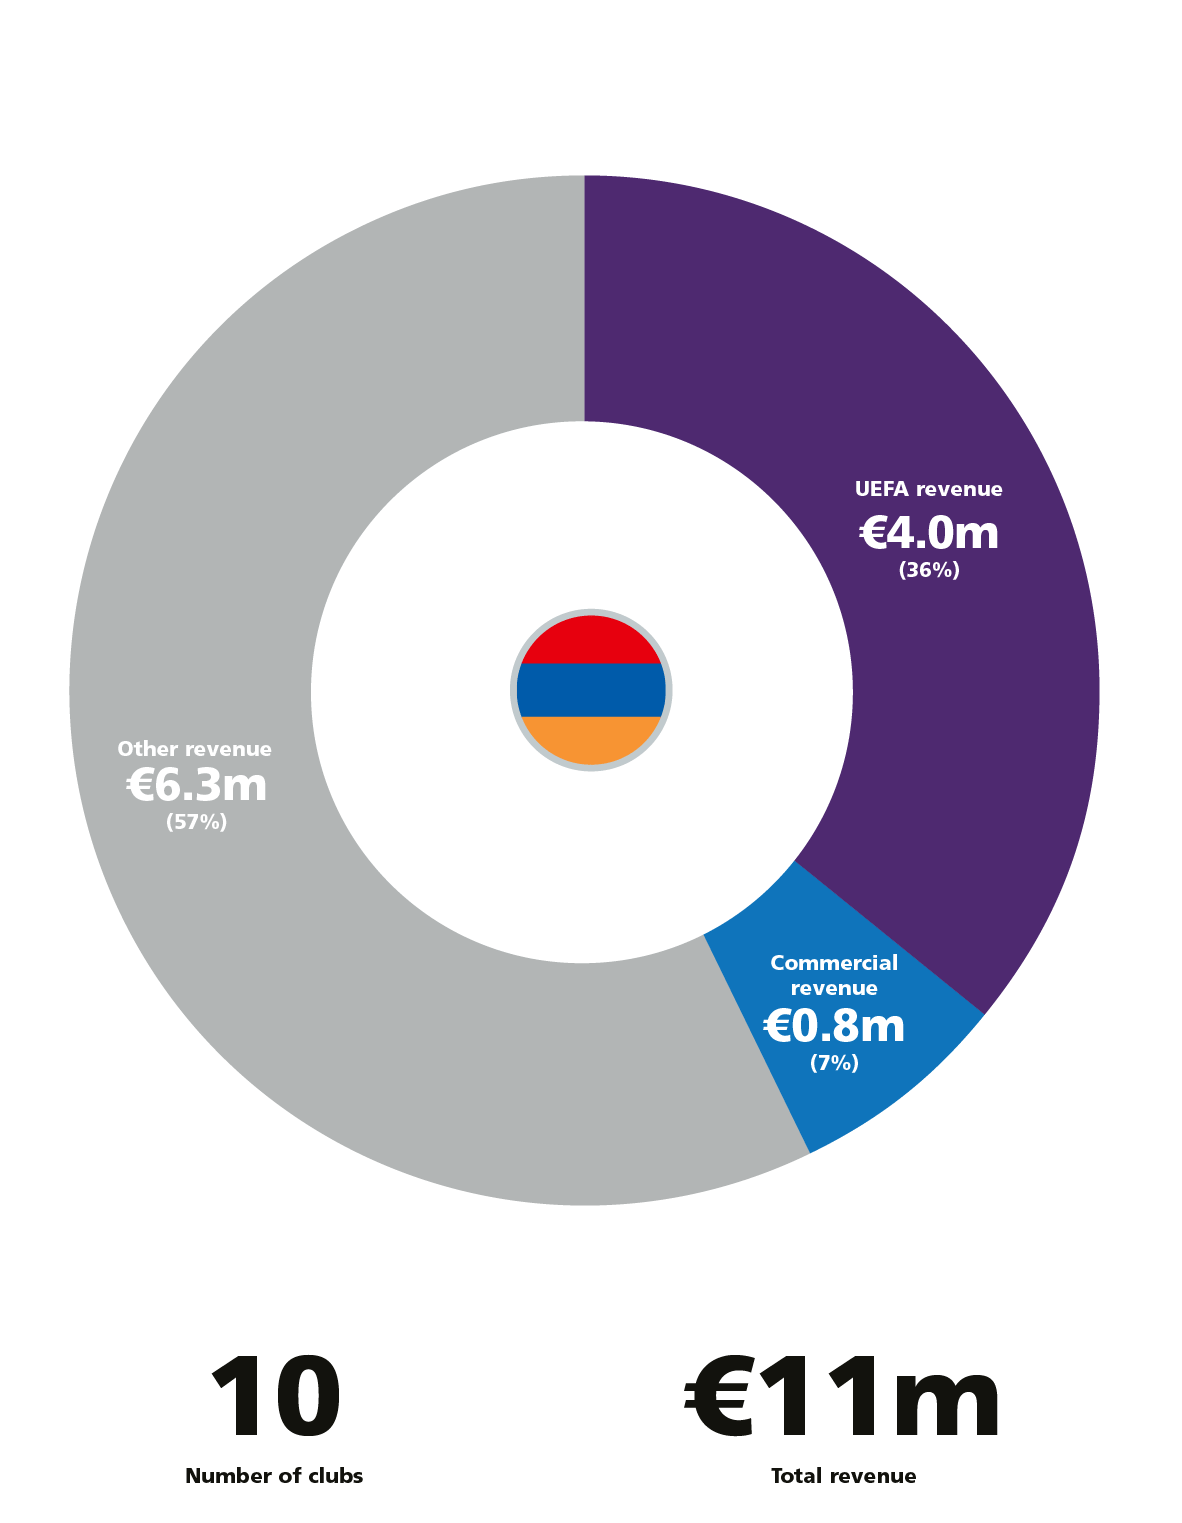
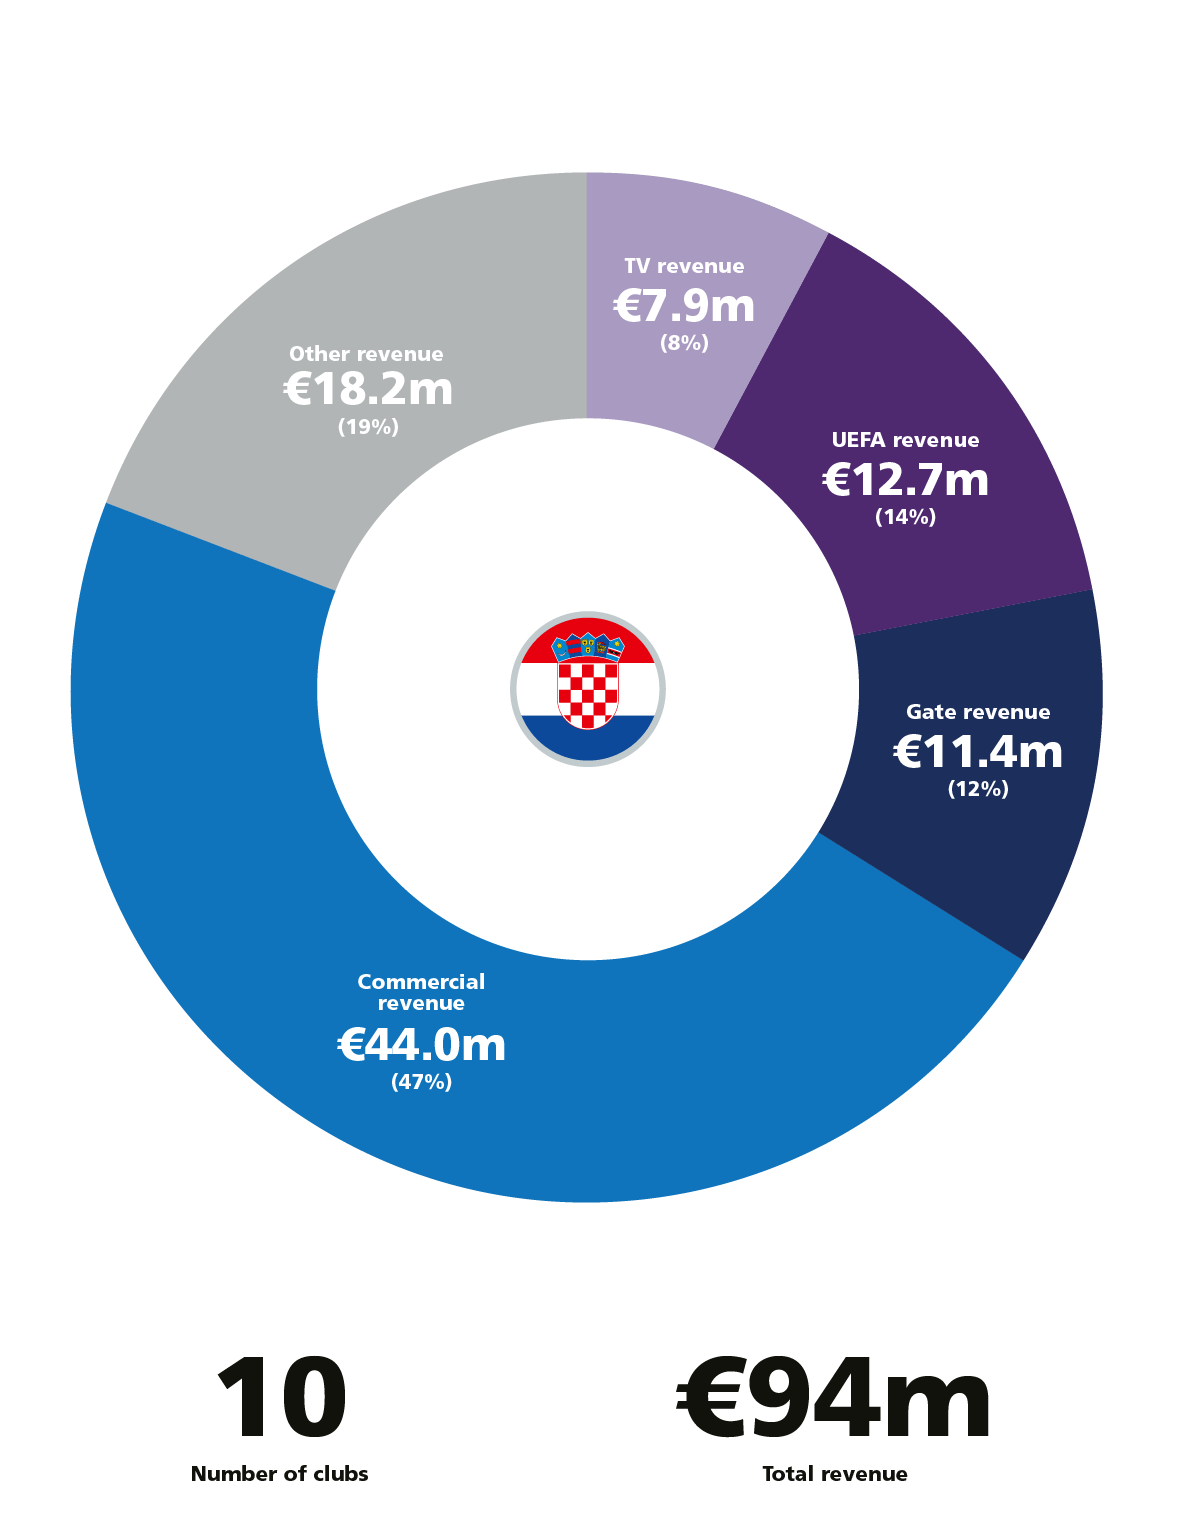
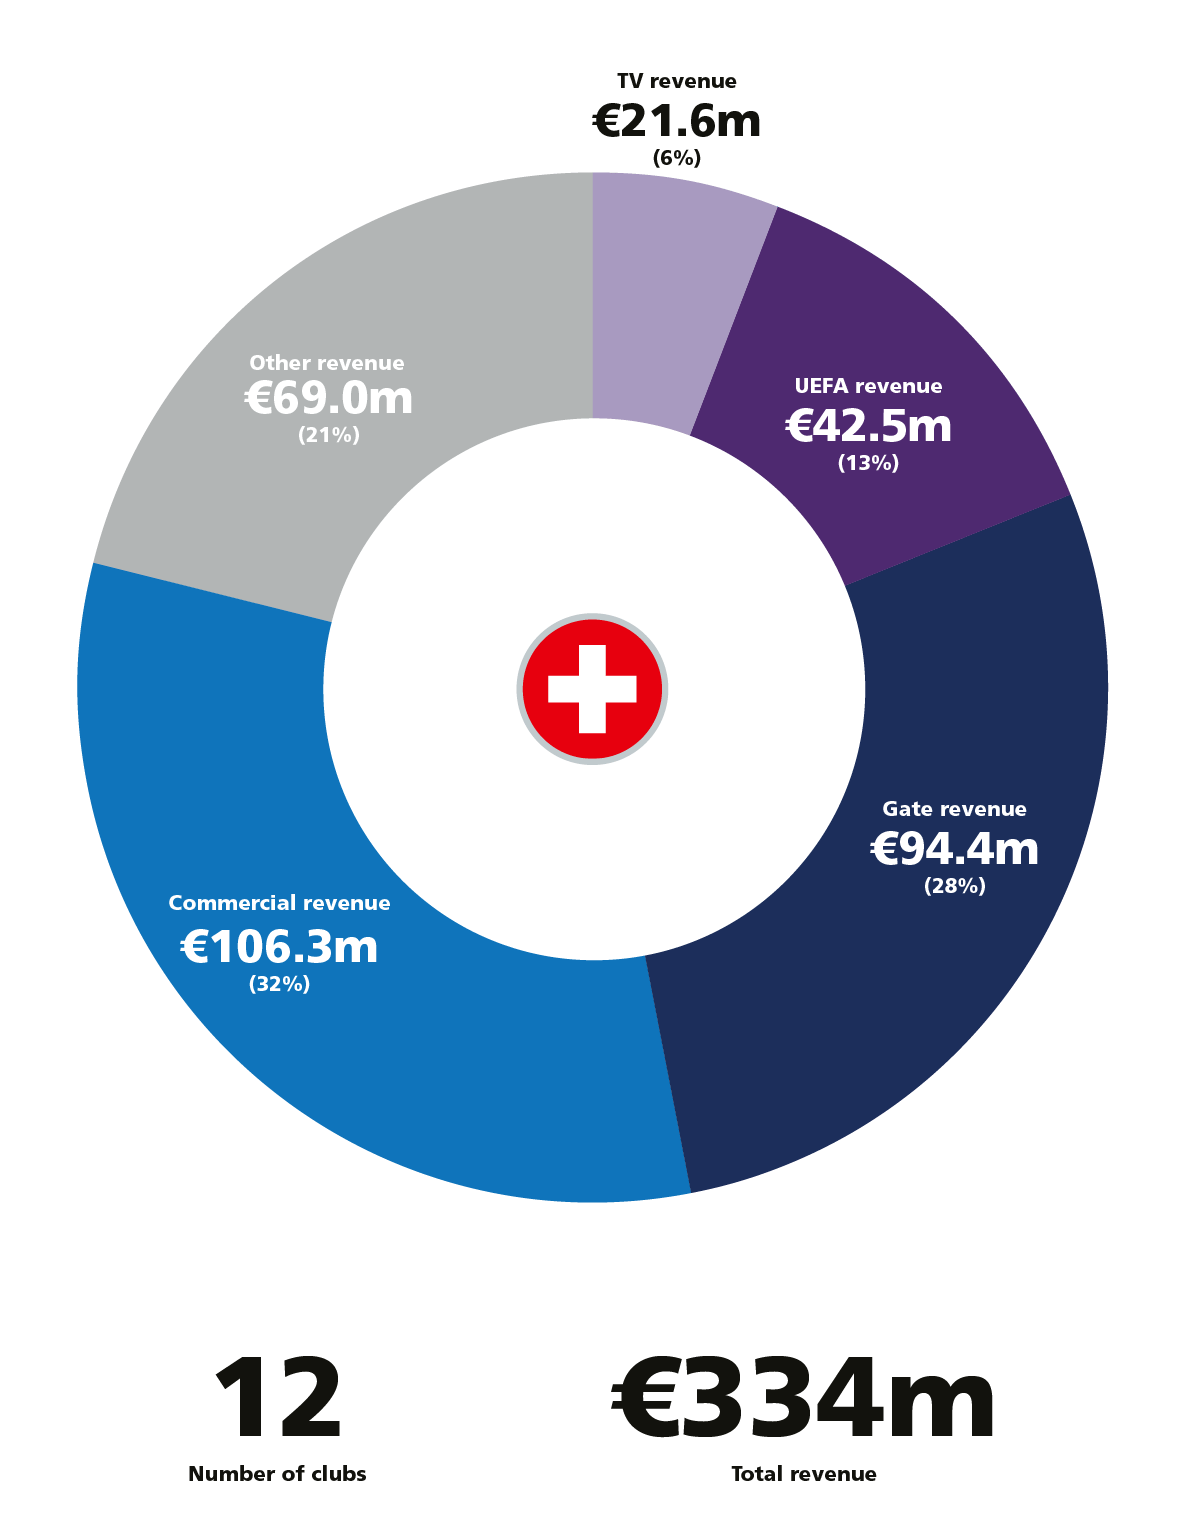
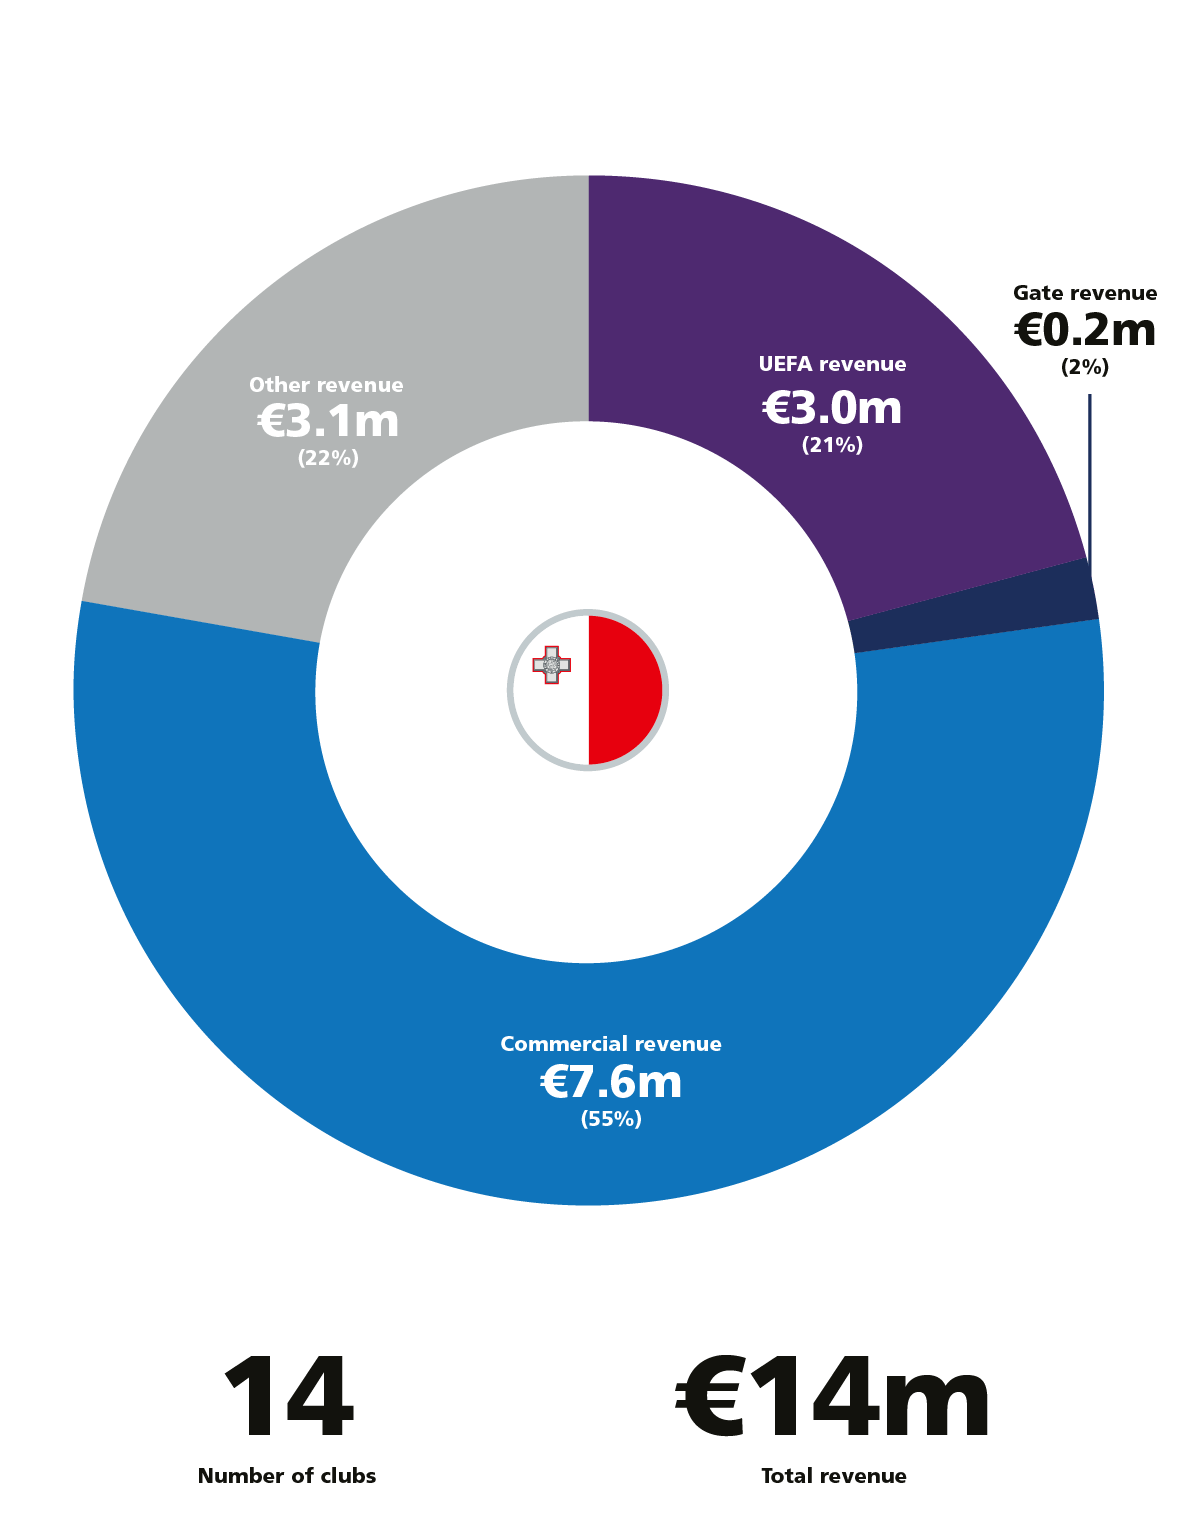
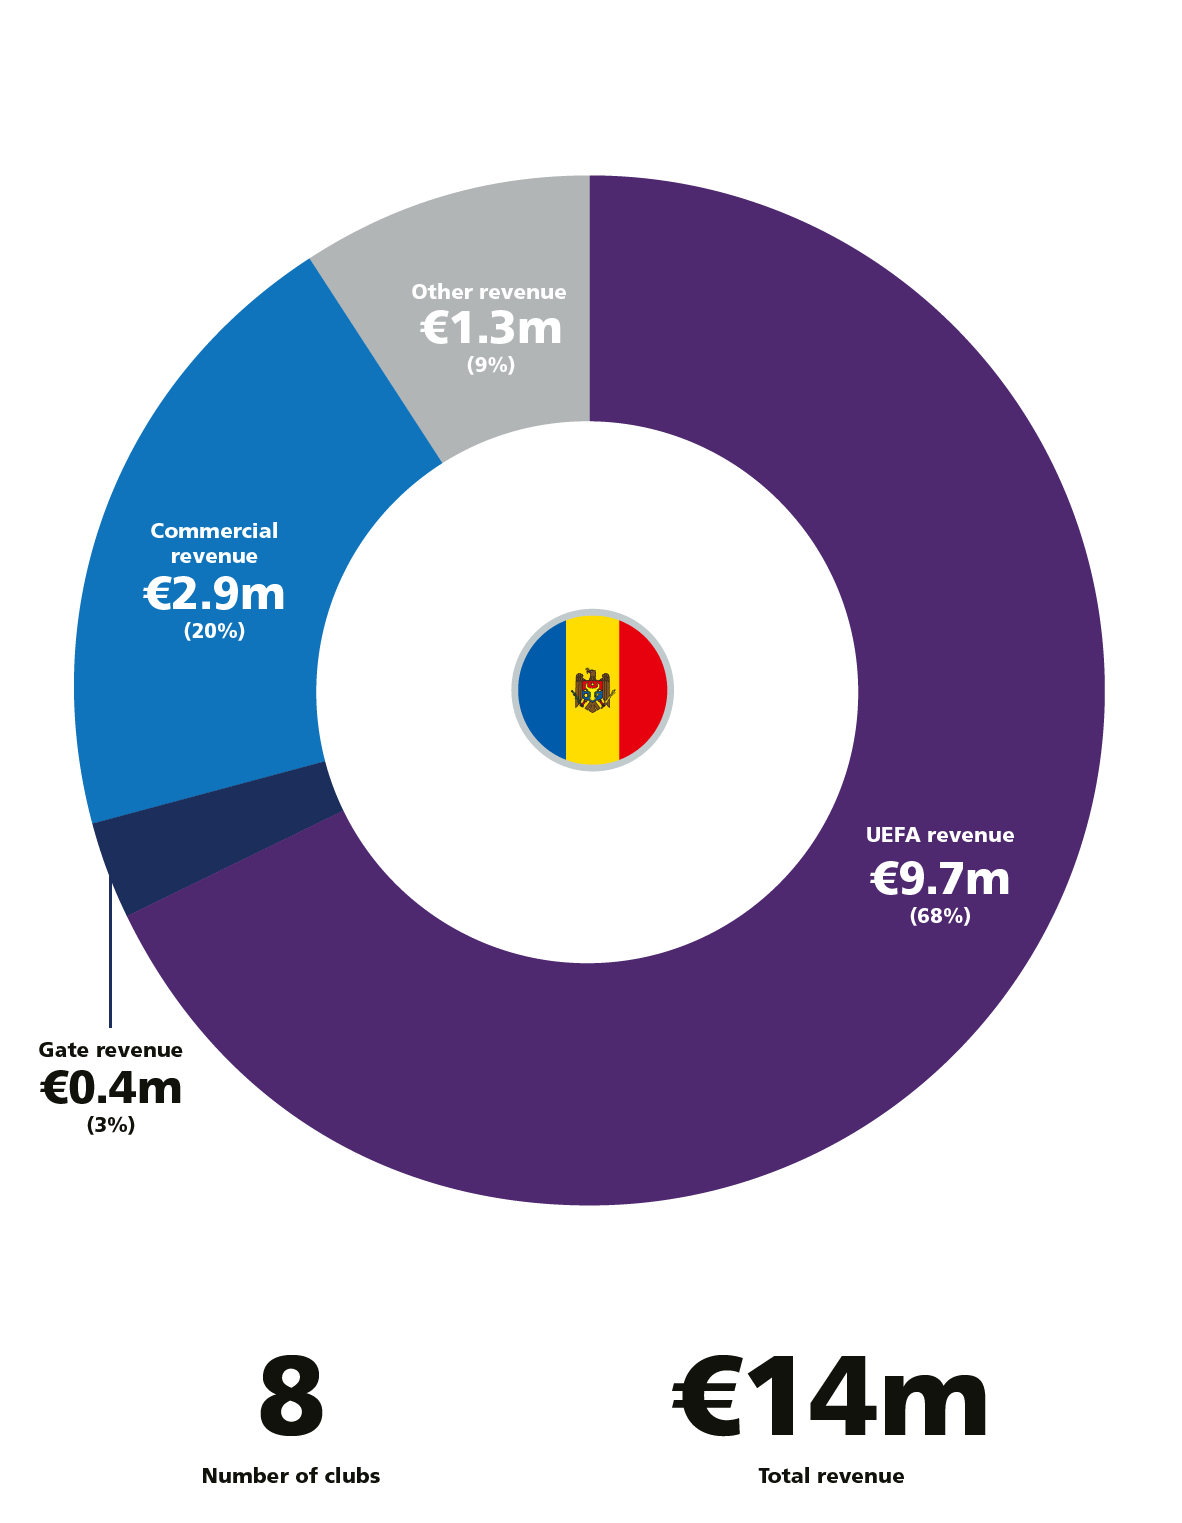
REVENUE LANDSCAPE
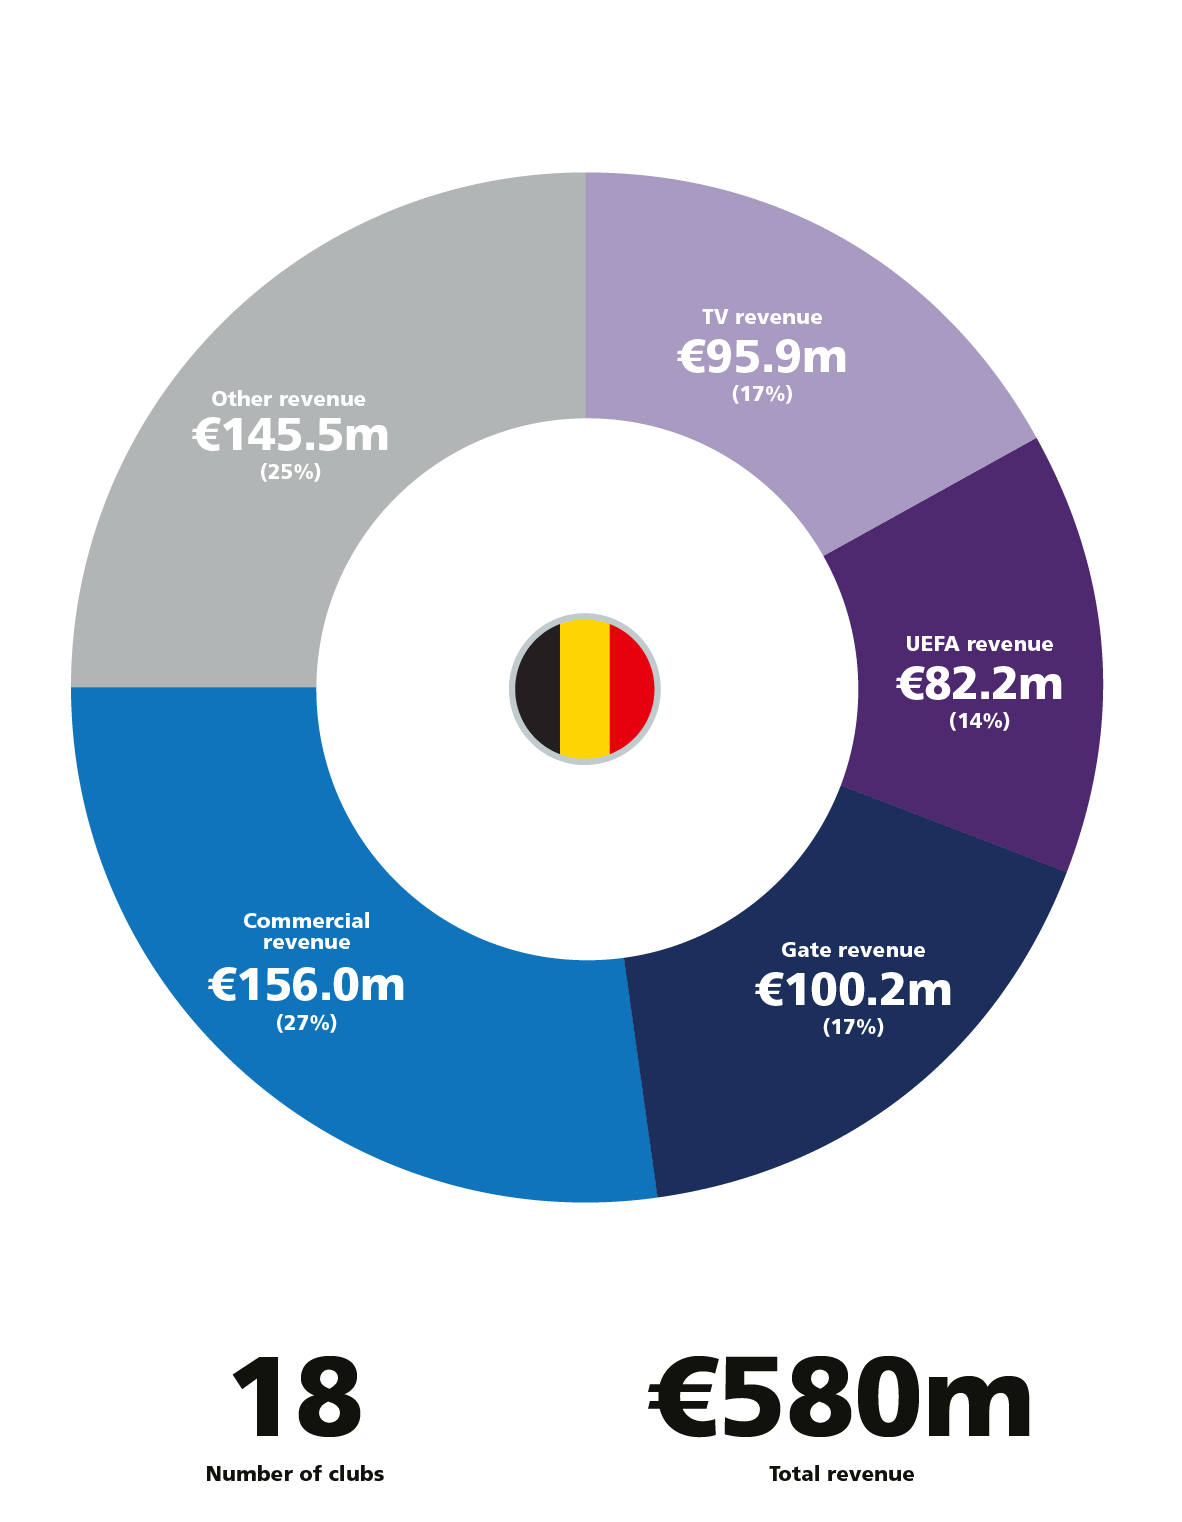
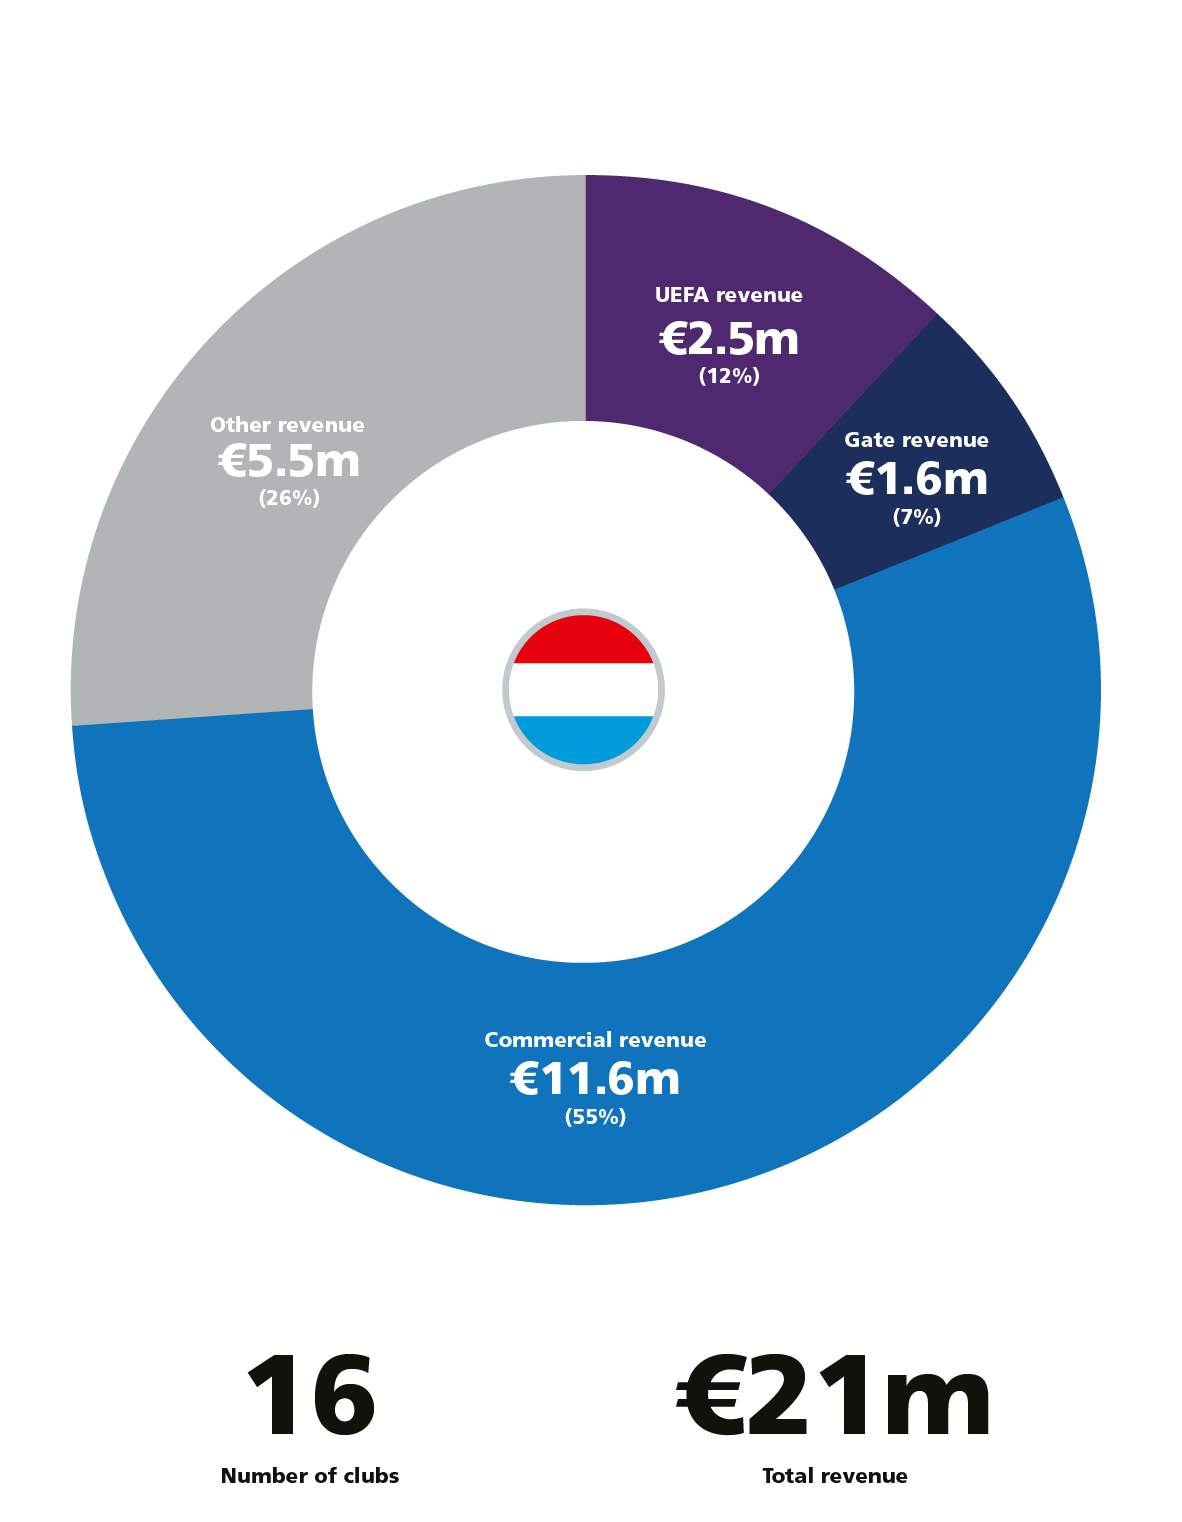
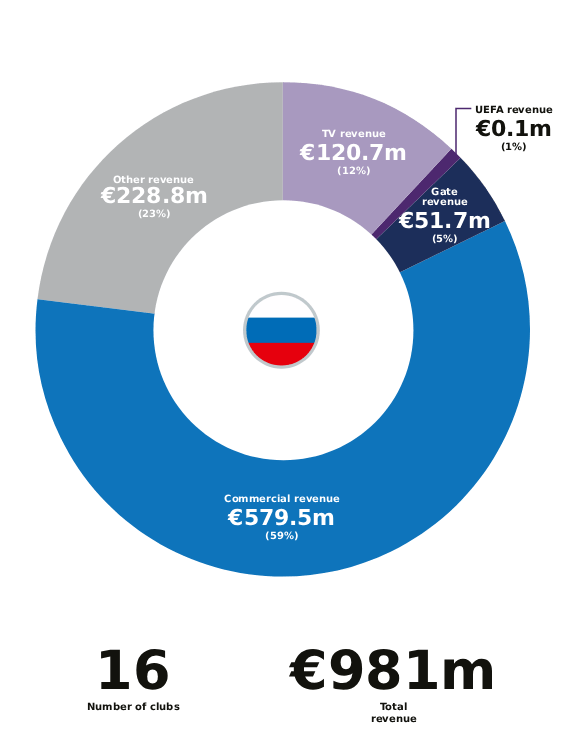
The report provides a country by country overview of where revenue is generated from.
Click on each country to view revenue landscape
Iceland
Denmark
Norway
Sweden
Faroe Islands
Scotland
England
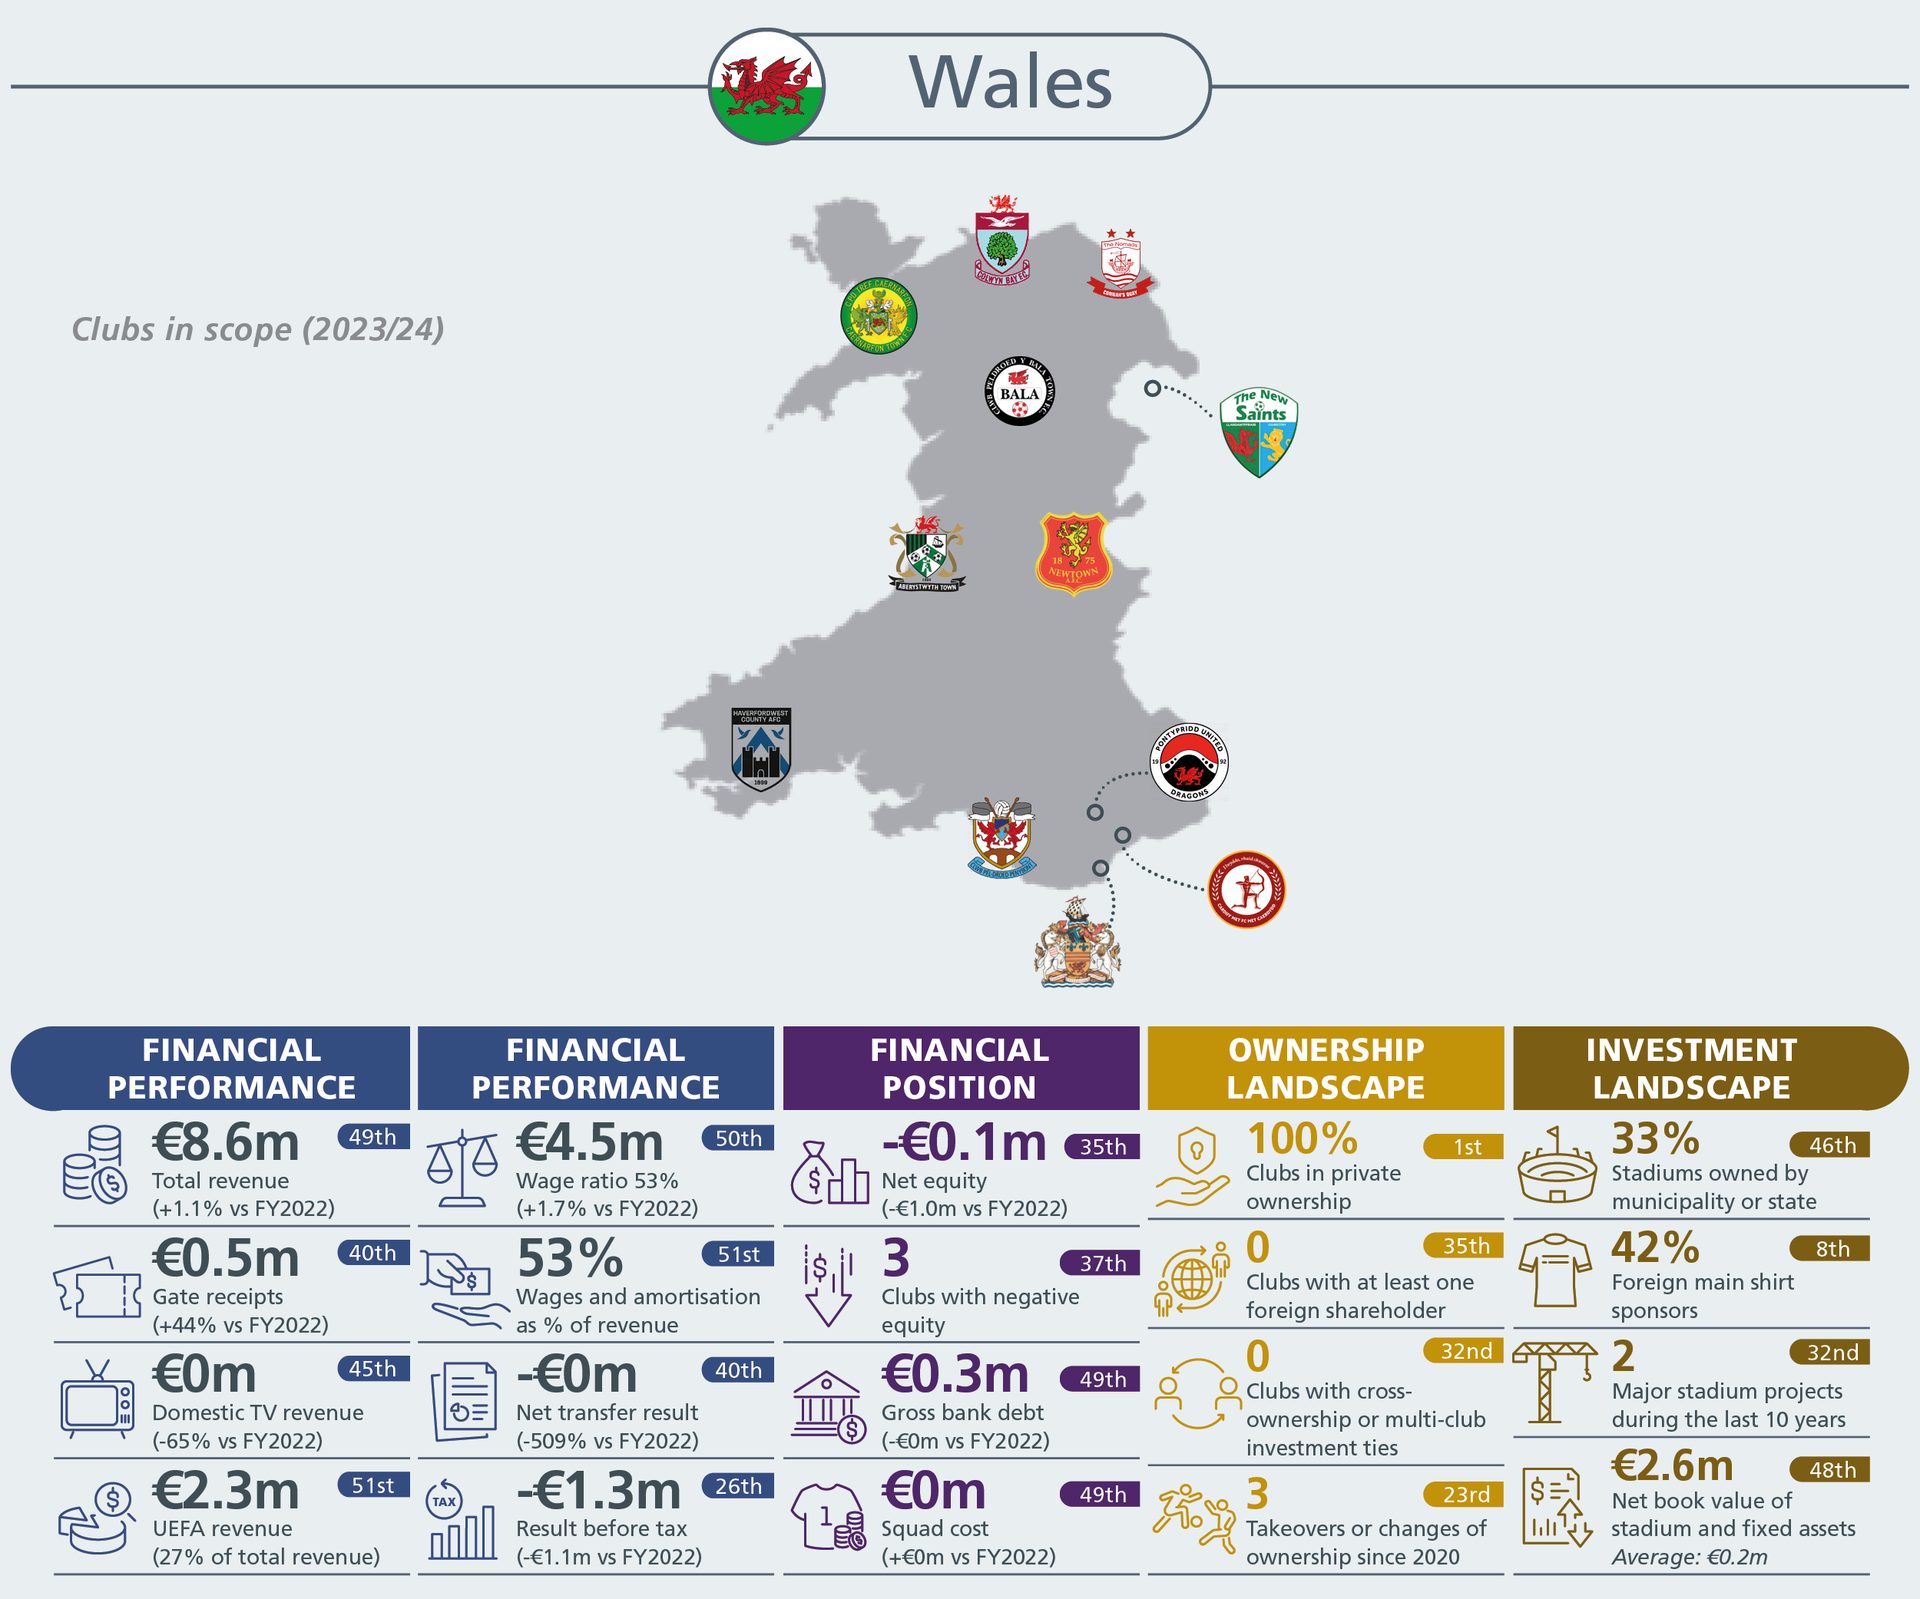
Wales
Republic of Ireland
Northern Ireland
Portugal
Gibraltar
Spain
Andorra
France
Belgium
Luxembourg
Netherlands
Germany
Finland
Russia
Kazakhstan
Azerbaijan
Armenia
Georgia
Türkiye
Poland
Cyprus
Israel
Ukraine
Belarus
Lithuania
Latvia
Estonia
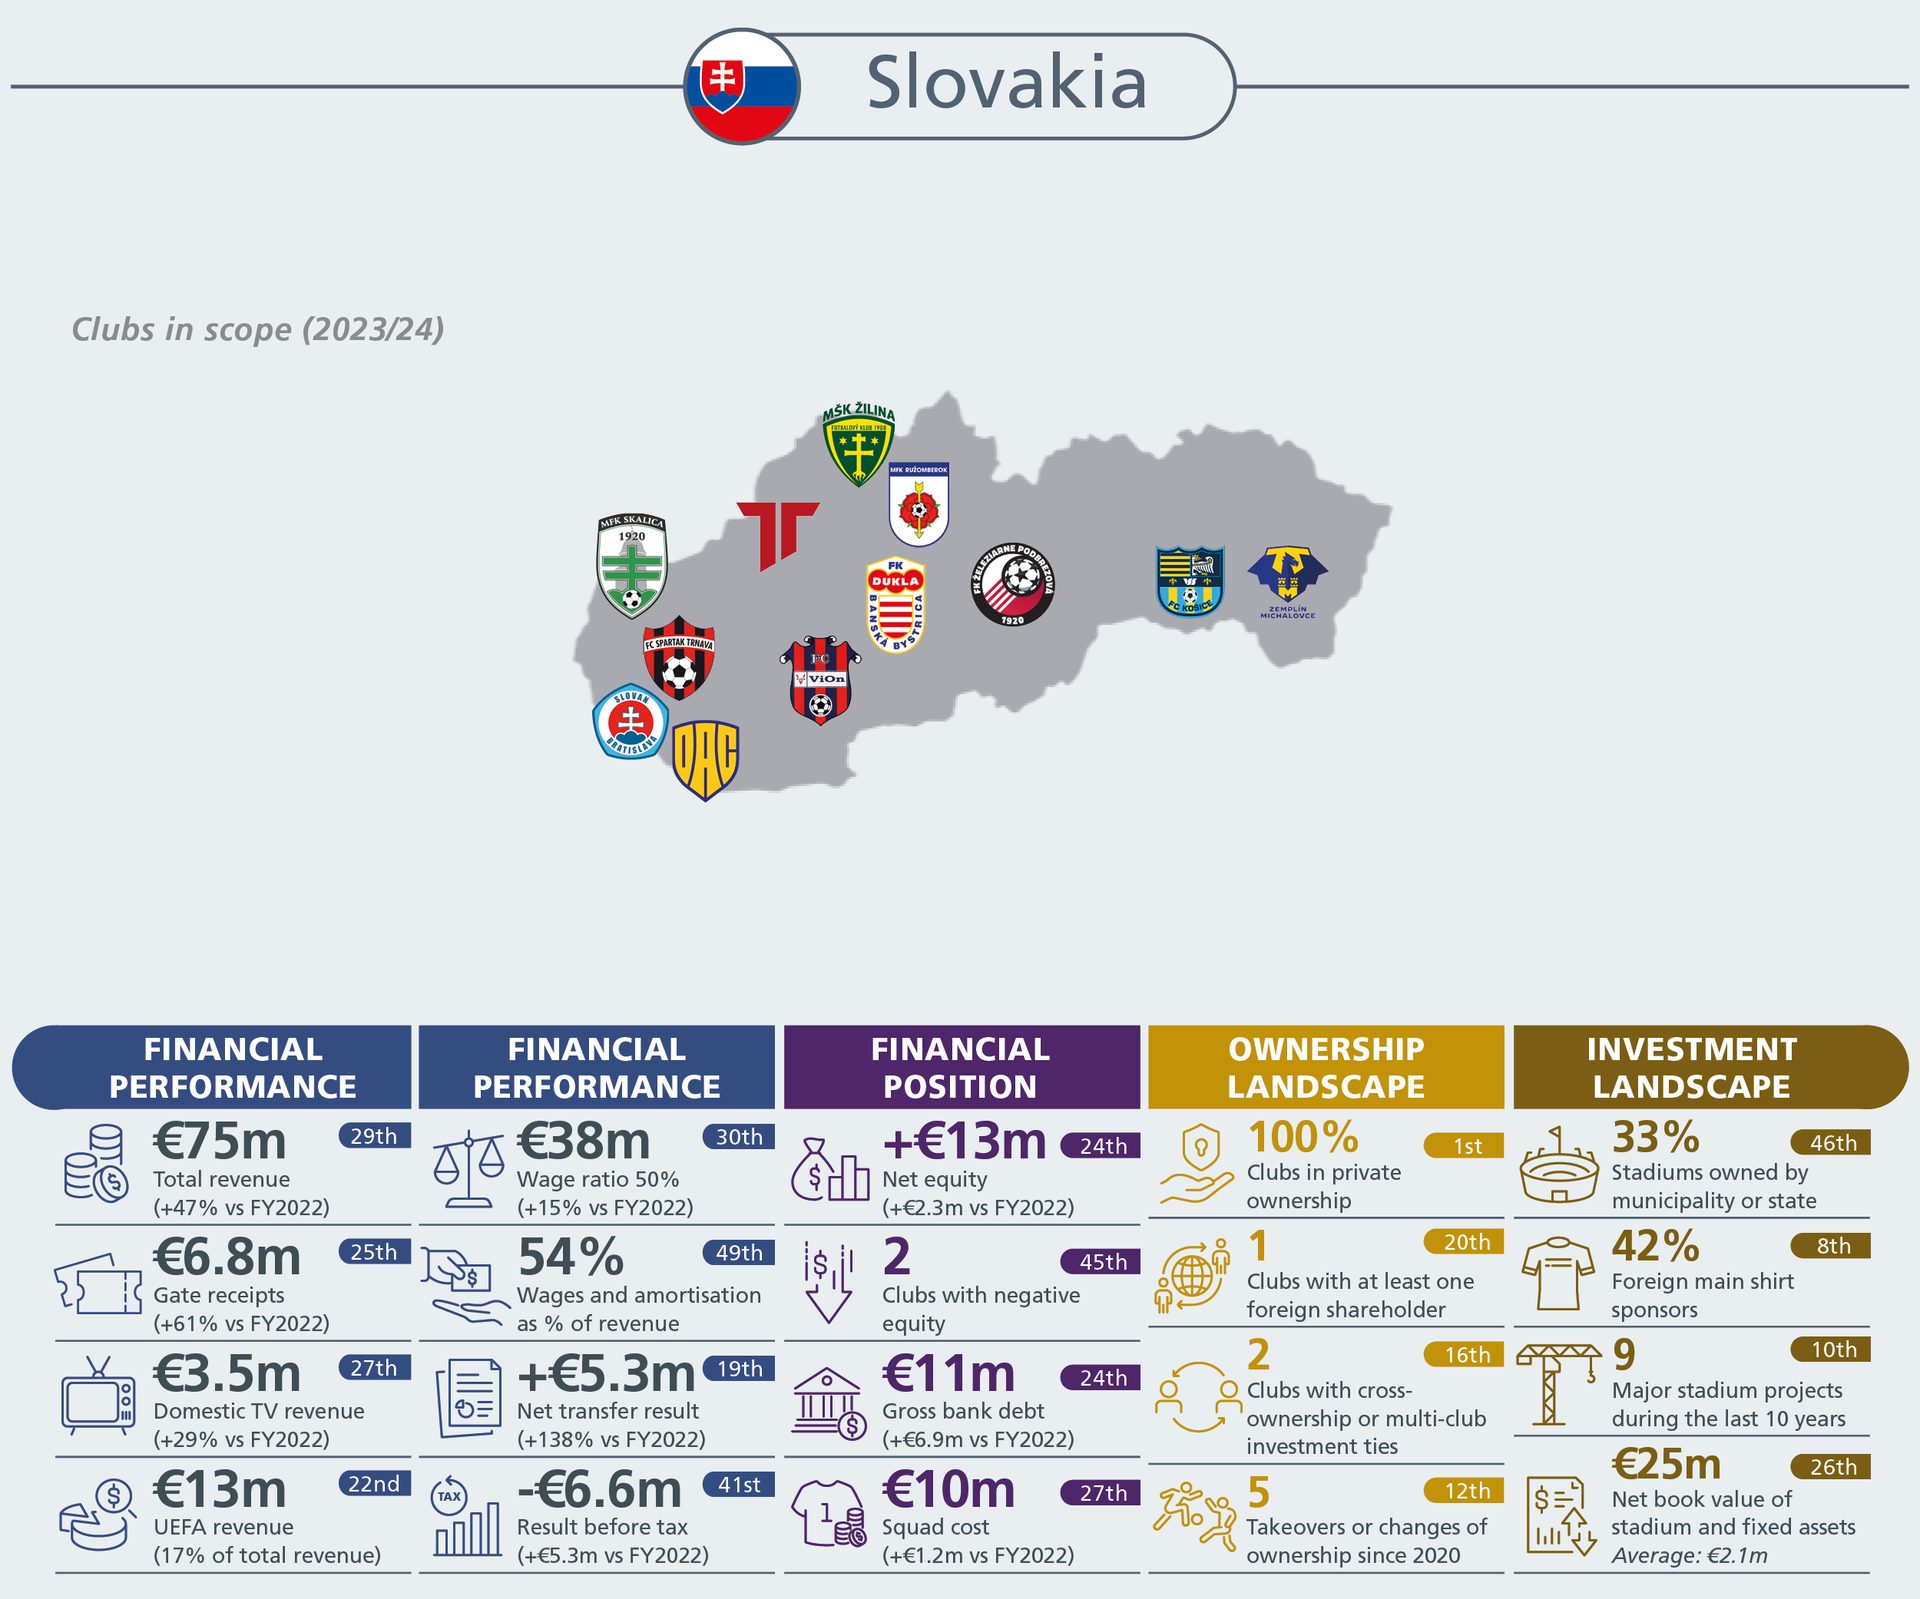
Slovakia
Hungary
Bosnia & Herzegovina
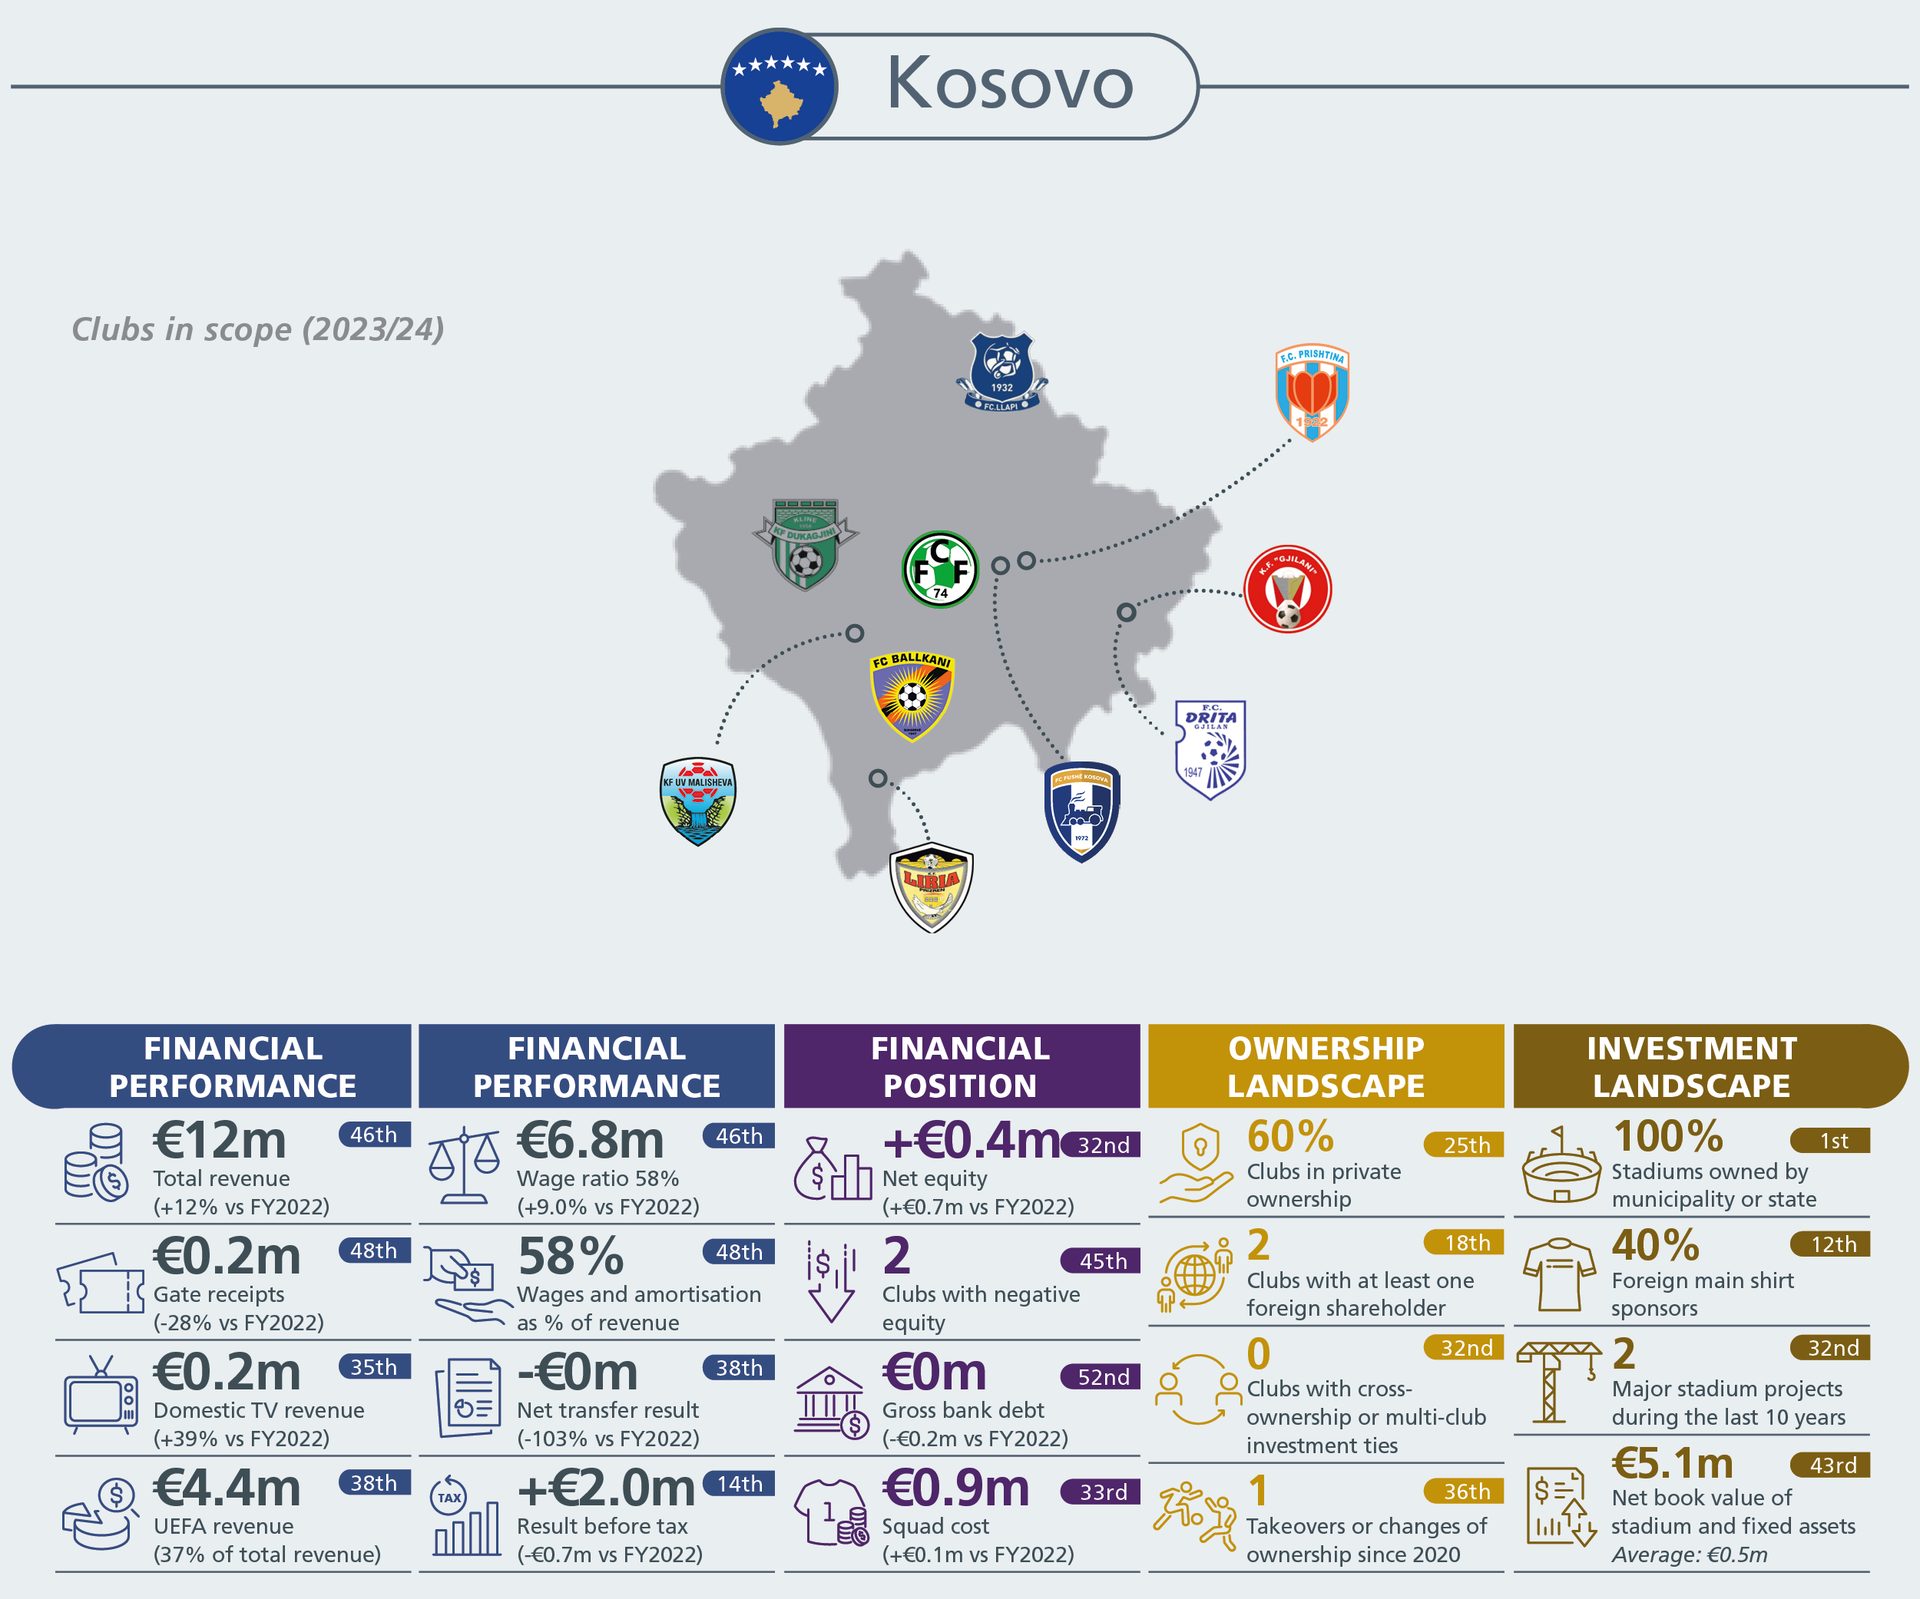
Kosovo
North Macedonia
Greece
Albania
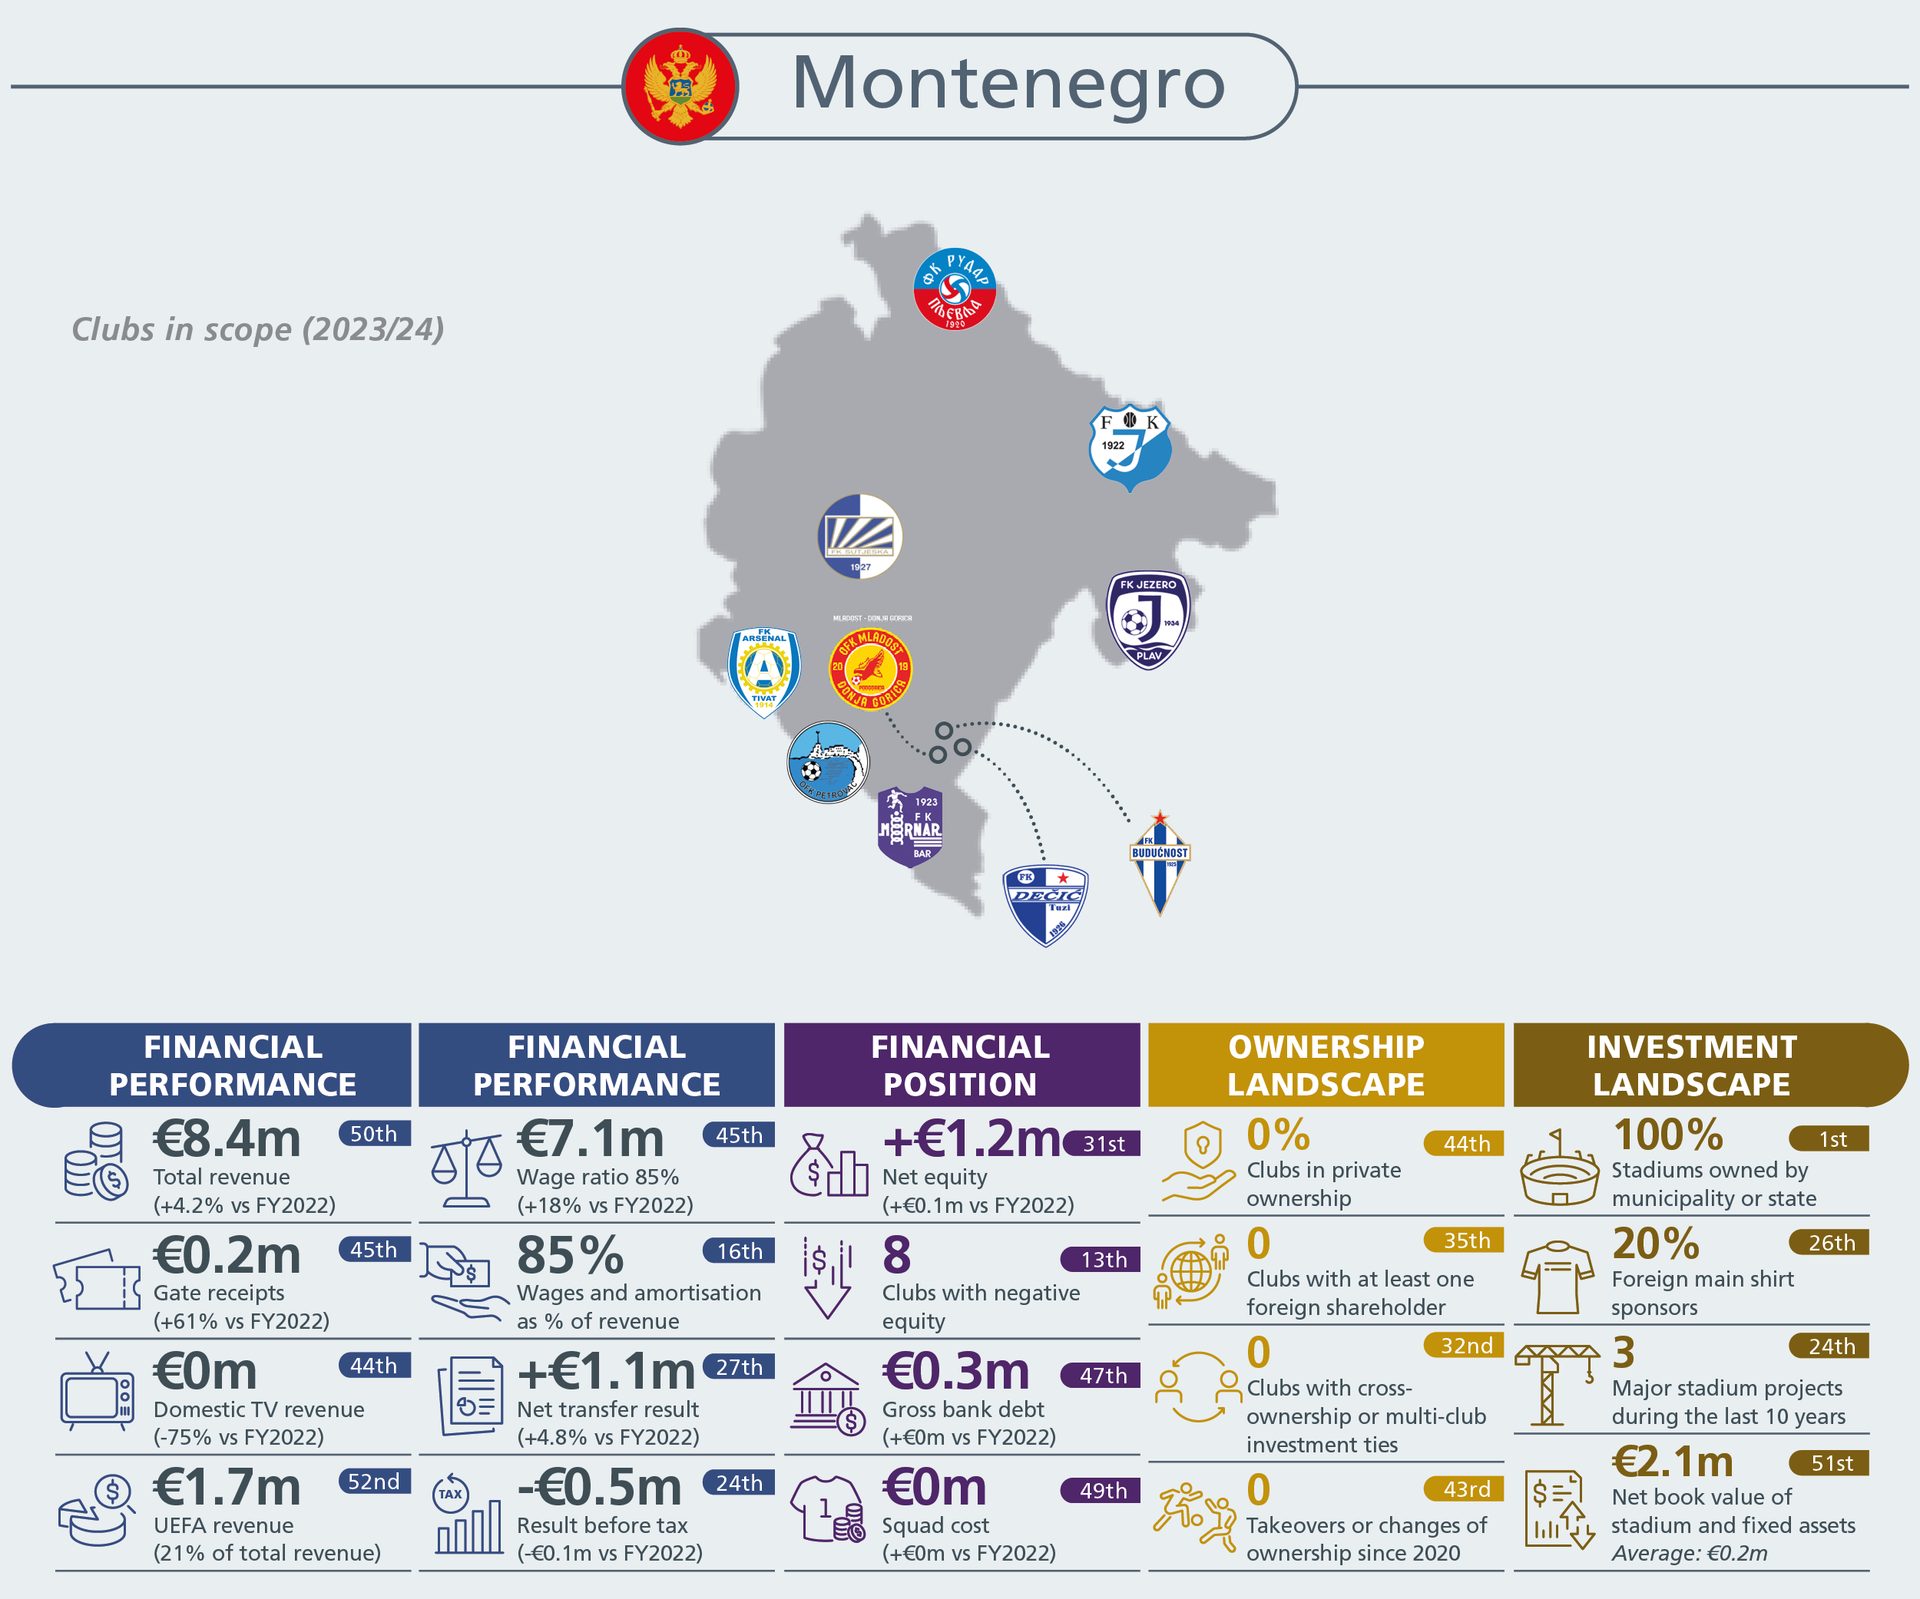
Montenegro
Croatia
Slovenia
Austria
Czechia
Switzerland
San Marino
Italy
Malta
Romania
Moldova
Bulgaria
Serbia
Liechtenstein


CLUB COSTS
Player wages at record levels but growing at a more sustainable rate. However strong inflation in other operating costs preventing clubs return to profitability.
Fast pre-pandemic revenue and wage growth, sustainable wage ratio.
2019
WAGE COST
bn
€
,
0
10

GROWTH RATE
%
+
1

WAGE RATIO
%
+
60

First ever reported wage decrease as pandemic lengthened season pushes bonuses into following year.
2020
WAGE COST
bn
€
,
0
10
GROWTH RATE
%
–
0
WAGE RATIO
%
+
67
Wage growth continued at height of pandemic despite another €3bn of lost revenues. Unsustainable peak wage ratio.
2021
WAGE COST
bn
€
,
0
10
GROWTH RATE
%
+
1
WAGE RATIO
%
+
71
As revenues return wages grow by
€1 billion. Wage ratio decreases but still unsustainable.
2022
WAGE COST
bn
€
,
0
10
GROWTH RATE
%
+
1
WAGE RATIO
%
+
67
Positive signs of clubs adapting to financial realities. Wage growth slows and more sustainable wage ratio.
2023
WAGE COST
bn
€
,
0
10
GROWTH RATE
%
+
0
WAGE RATIO
%
+
61
2024
%
+
1

%
+
1

%
+
8

%
+
6

%
+
7

UEFA participating clubs
Growth
PLAYER WAGES
OTHER WAGES
OTHER OPERATING COSTS
NUMBER OF CLUB STAFF
COACH AND TECHNICAL WAGES
%
+
1
%
+
1
%
+
11
%
+
7
All 700+ top division clubs
2023
PLAYER WAGES
OTHER WAGES
OTHER OPERATING COSTS
NUMBER OF CLUB STAFF
COACH AND TECHNICAL WAGES
2023
Club Costs


7,9
7,8
8,4
9,3
9,7
6,9
6,8
7,5
7,5
14.8
14.6
15.9
16.9
All Clubs
7,9
7,8
8,4
9,3
9,7
6,9
6,8
7,5
7,5
14.8
14.6
15.9
16.9
All Clubs
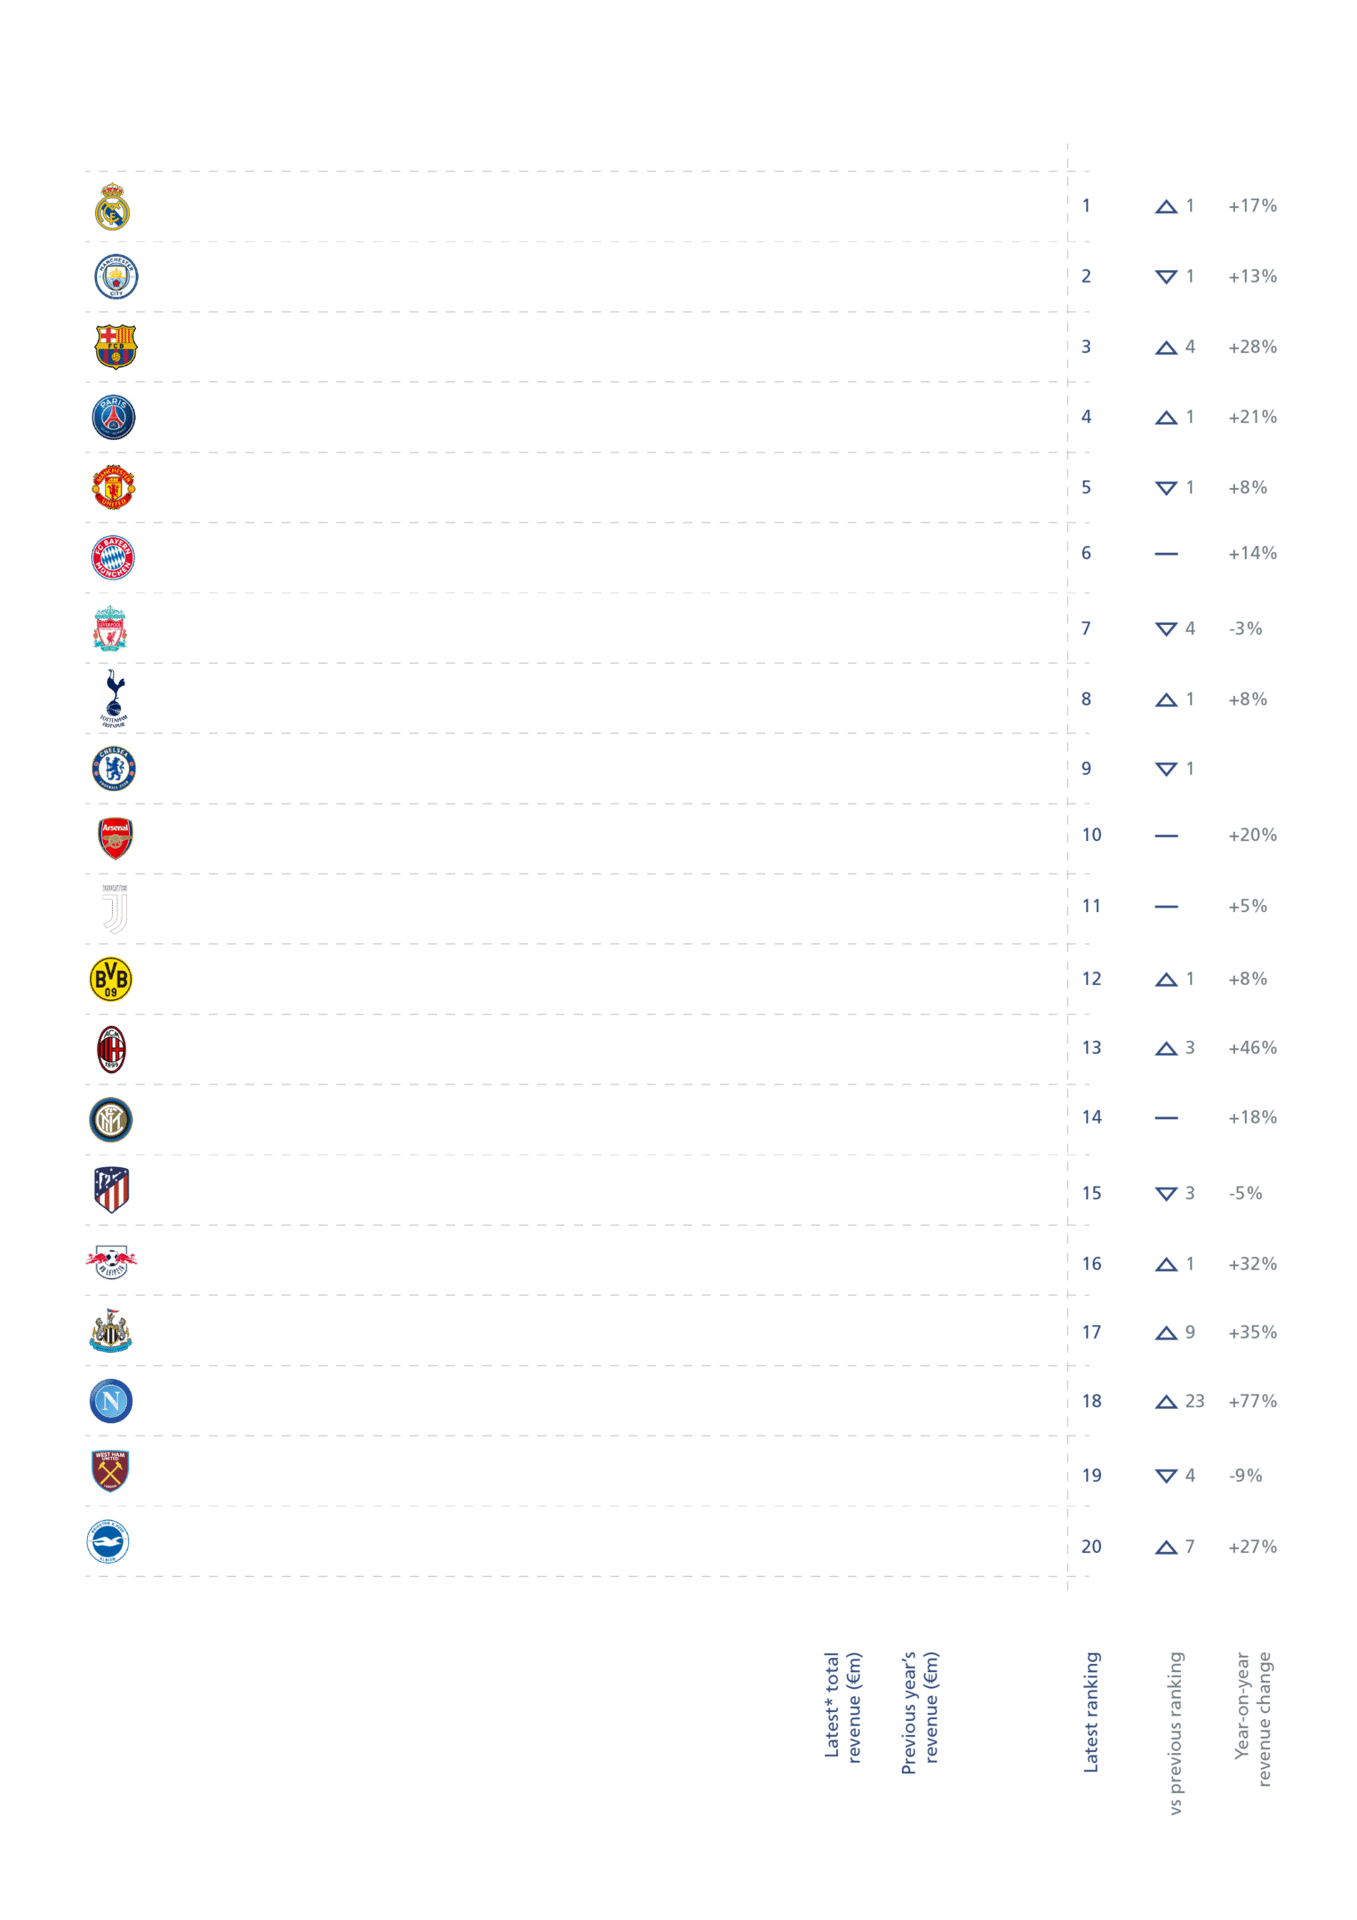
EXPLORE THE TOP 20 CLUBS
The full report features 12 different club by club comparisons with a selection of these topics presented below.
You can explore how much each club makes from commercial revenues, then delve further into how much is from kit and merchandising.
You can also explore which clubs spend the most on wages and which clubs' squads cost the most transfer fees to build.
Click on each metric to view results below
Total revenue (2024)
COMMERCIAL REVENUE
toTAL WAGES
CUMULATIVE COST of squad
Total Revenue (2014)
Kit & Merchandising Revenue
Wage Ratio
Balance Sheet Cost of Squads
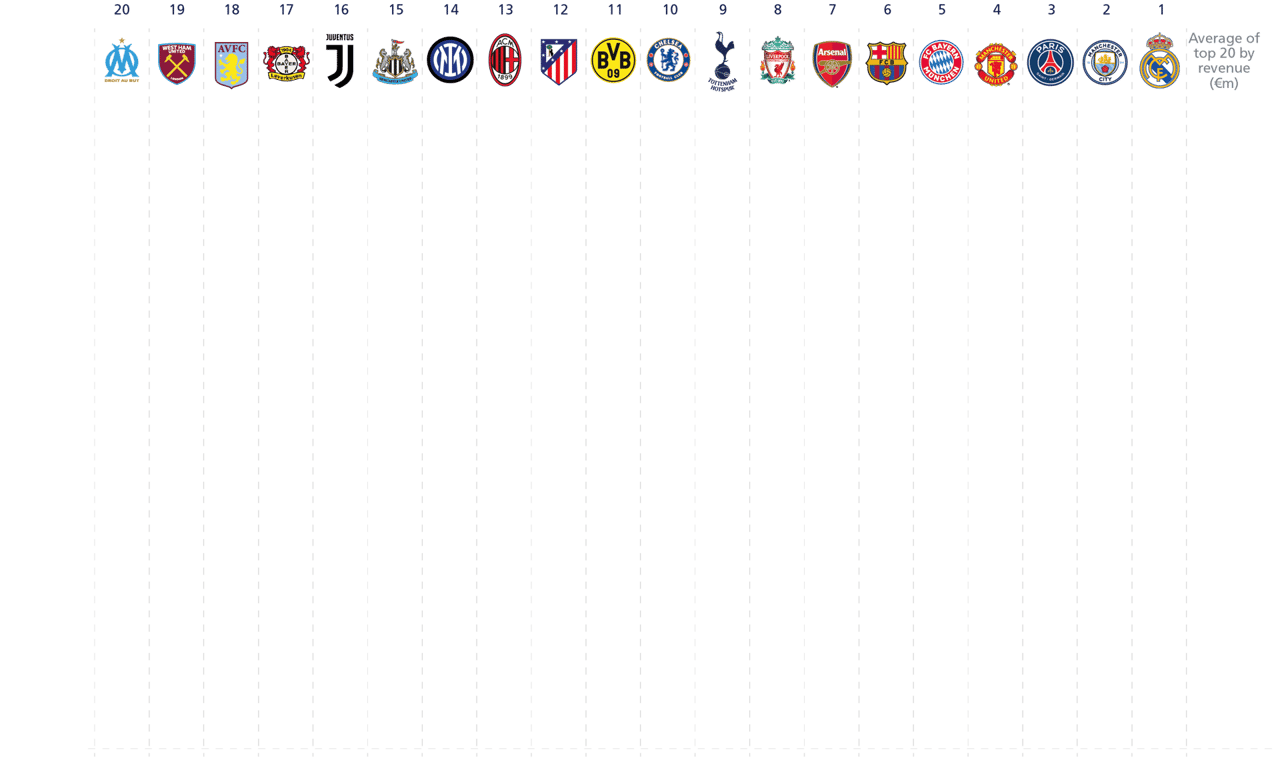
TOTAL REVENUE 2024 (€m)
Revenue at top is polarised with a €300m+ gap between 8th and 12th highest revenue club.
COMMERCIAL REVENUE (€m)
The top 20 commercial earning clubs are generating 1.9 times more commercial revenue than they are earning from domestic football TV distributions.
TOTAL WAGES (€m)
All categories of wages, player wages, coaching and technical staff and administrative and commercial wages are now considerably higher than they were before the pandemic.
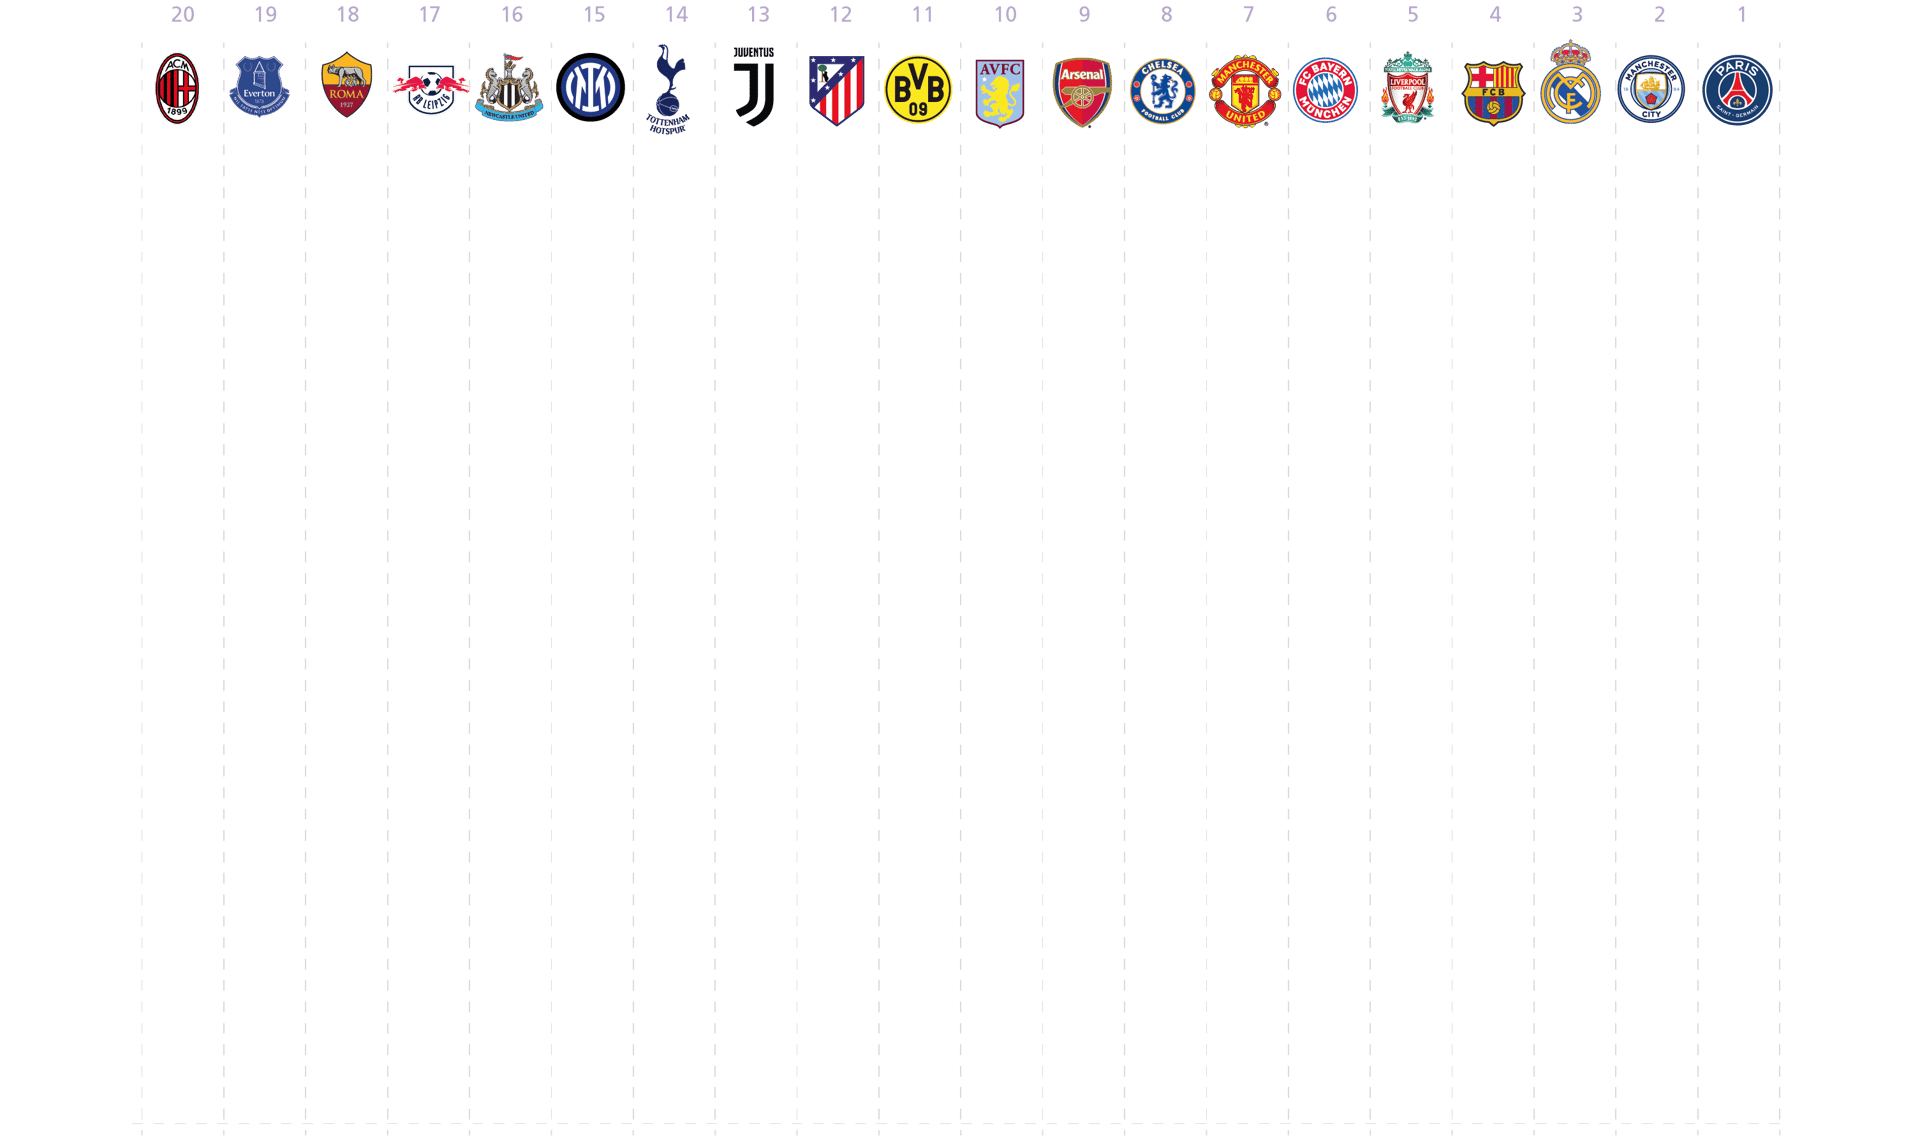
CUMULATIVE COST of squad (€m)
The Premier League hosts the 4 most expensive squads and at least 9 of the 20 most expensive squads.
TOTAL REVENUE 2014 (€m)
All of the current top 20 clubs were in the top 25 in 2014.
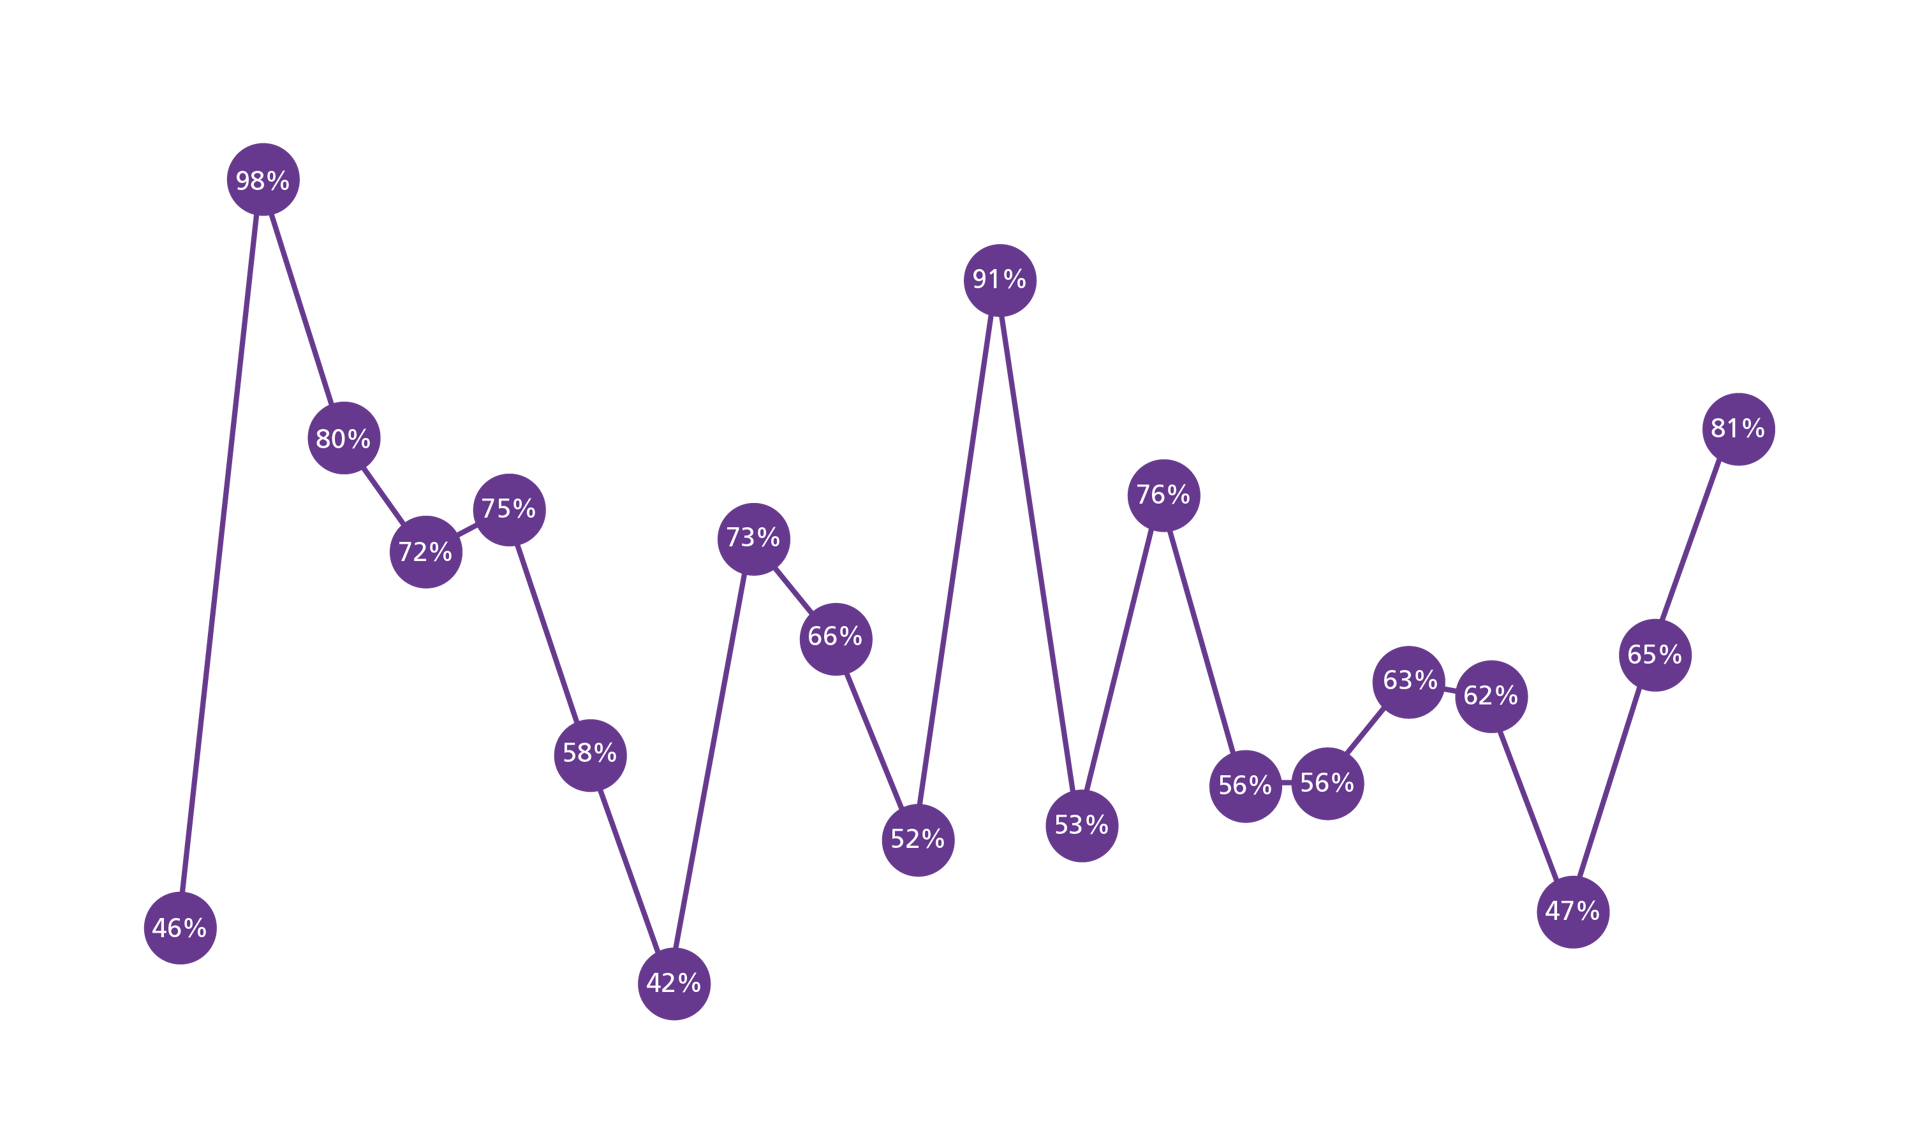
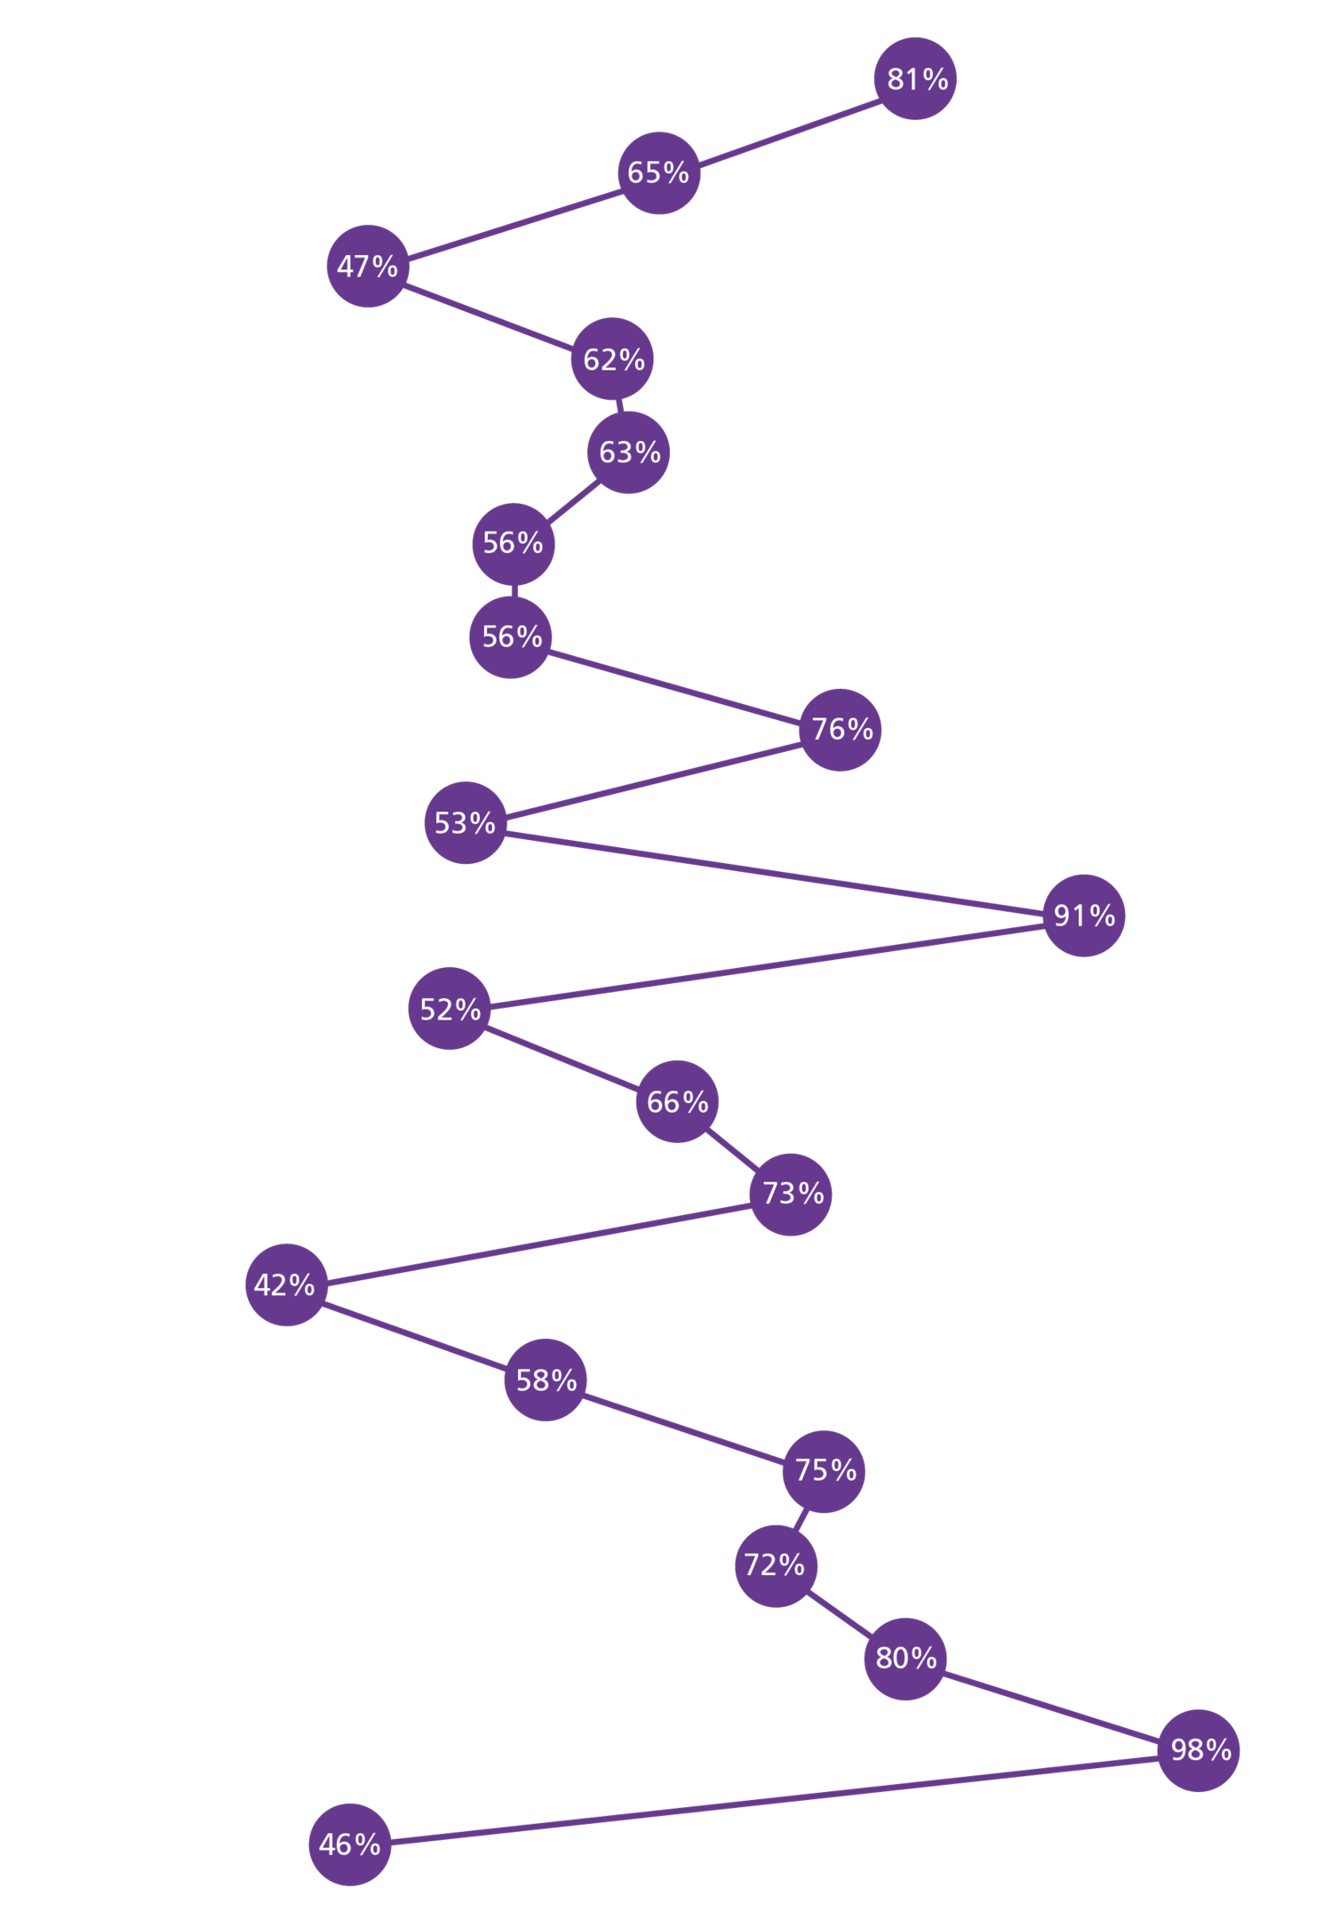
WAGE RATIO
Wages rose 6.8% in 2023, at a slower rate than revenue, reducing the wage to revenue ratio.
KIT & MERCHANDISING REVENUE (€m)
Kit and merchandising can be viewed as a proxy for each individual club’s global fan base.
BALANCE SHEET COST OF SQUADS (€m)
The transfer fees appear as an asset of the club. The value is reduced across the contract of each player.
Total revenue (2024)
COMMERCIAL REVENUE
toTAL WAGES
CUMULATIVE COST of squad
Total Revenue (2014)
Kit & Merchandising Revenue
Wage Ratio
Balance Sheet Cost of Squads
TOTAL REVENUE 2024 (€m): Revenue at top is polarised with a €300m+ gap between 8th and 12th highest revenue club.
COMMERCIAL REVENUE (€m): The top 20 commercial earning clubs are generating 1.9 times more commercial revenue than they are earning from domestic football TV distributions.
TOTAL WAGES (€m): All categories of wages, player wages, coaching and technical staff and administrative and commercial wages are now considerably higher than they were before the pandemic.
CUMULATIVE COST OF SQUAD (€m): The Premier League hosts the 4 most expensive squads and at least 9 of the 20 most expensive squads.
TOTAL REVENUE 2014 (€m): All of the current top 20 clubs were in the top 25 in 2014.
KIT & MERCHANDISING (€m): Kit and merchandising can be viewed as a proxy for each individual club’s global fan base.
WAGE RATIO: Wages rose 6.8% in 2023, at a slower rate than revenue, reducing the wage to revenue ratio.
BALANCE SHEET COST OF SQUADS (€m): The transfer fees appear as an asset of the club. The value is reduced across the contract of each player.


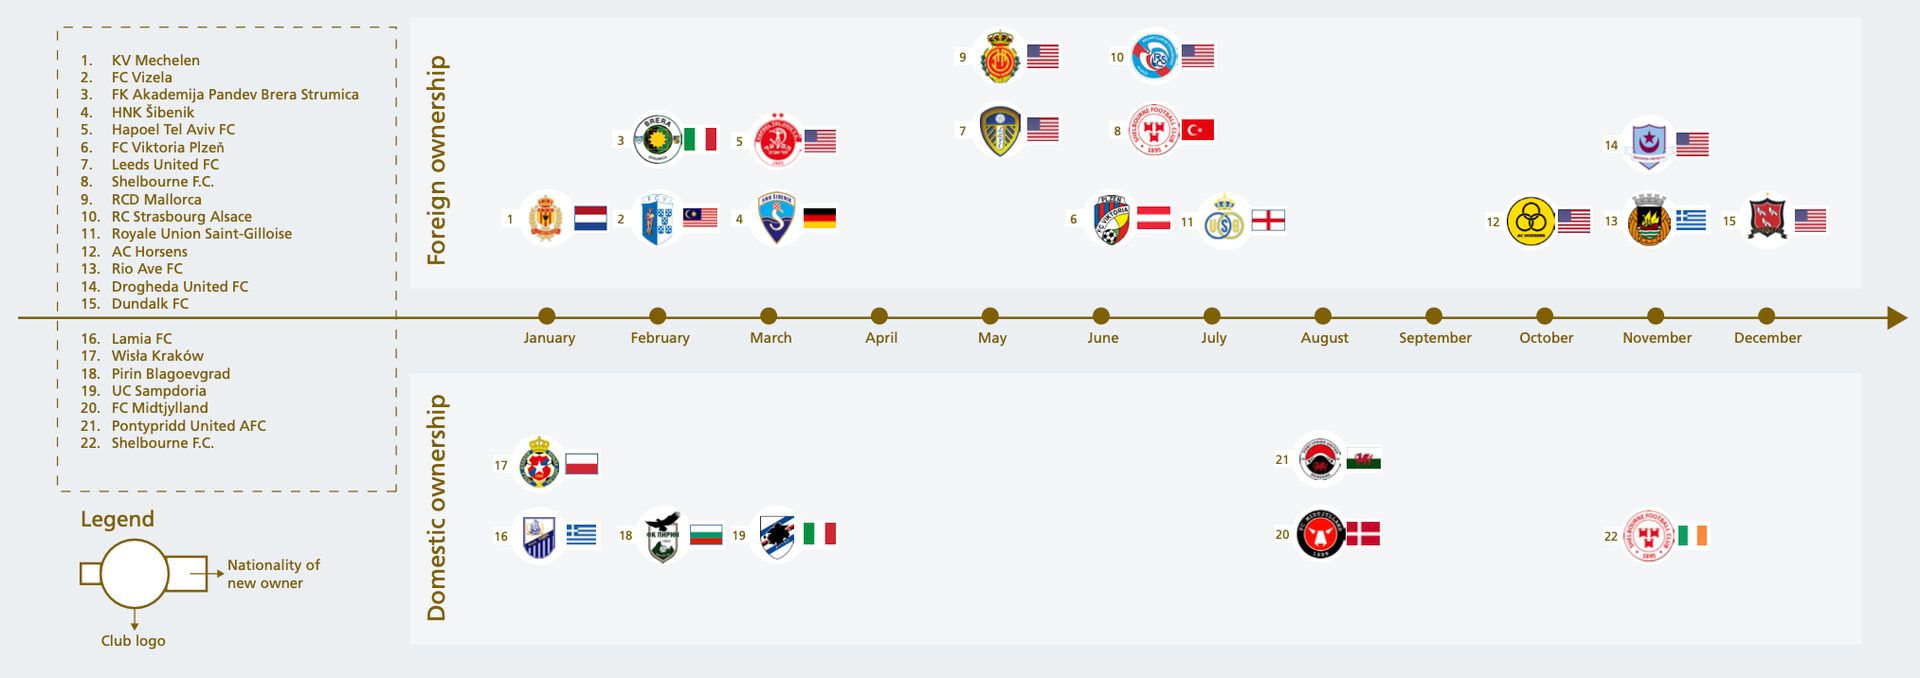
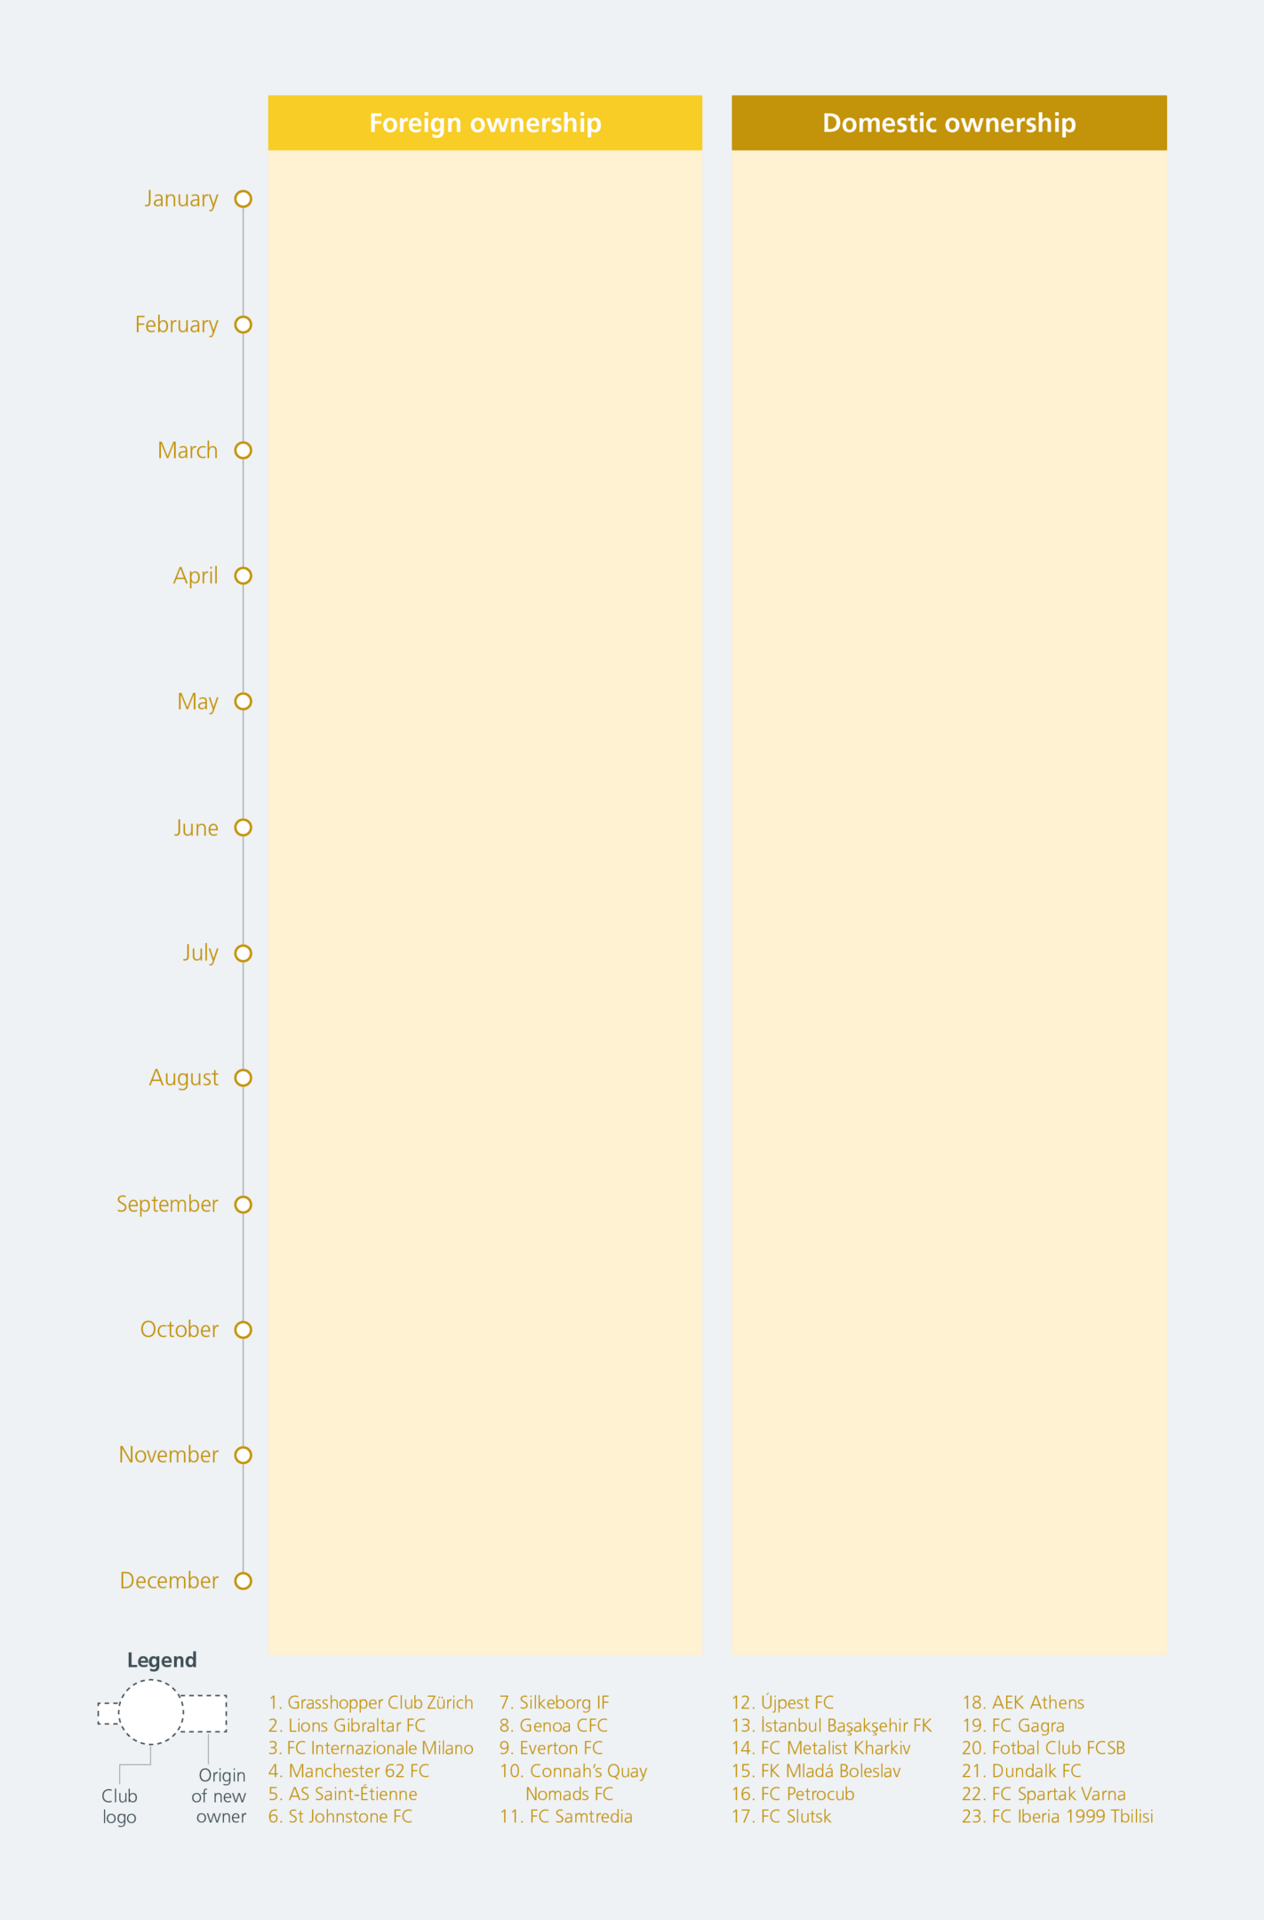
CLUB INVESTMENT
There has been a slowdown in the number of transactions of controlling investment in European top-division football clubs.
Nonetheless strong demand to buy into the authenticity of European club football continued from all corners of the world.


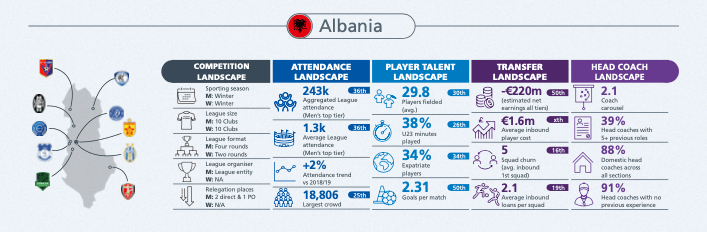
COUNTRY KPIs
The report covers much more than just the biggest clubs and leagues. More than 700 clubs per year are analysed providing a 360 degree snapshot that is aggregated and can be explored below.
Click on each country to view benchmark statistics.
Iceland
Denmark
Norway
Sweden
Faroe Islands
Scotland
England
Wales
Republic of Ireland
Northern Ireland
Portugal
Gibraltar
Spain
Andorra
France
Belgium
Luxembourg
Netherlands
Germany
Finland
Russia
Kazakhstan
Azerbaijan
Armenia
Georgia
Türkiye
Poland
Cyprus
Israel
Ukraine
Belarus
Lithuania
Latvia
Estonia
Slovakia
Hungary
Bosnia & Herzegovina
Kosovo
North Macedonia
Greece
Albania
Montenegro
Croatia
Slovenia
Austria
Czechia
Switzerland
San Marino
Italy
Malta
Romania
Moldova
Bulgaria
Serbia