


The European Club Finance and Investment Landscape
SCROLL TO EXPLORE
Here we present the key findings from the latest edition of the report, taking you through the story of Europe’s football clubs’ financial health.

Detailed analyses, including the top 25 clubs by each financial measure and data on all 55 UEFA member associations, can be found in the full report.

DOWNLOAD FULL REPORT

Top-division club revenue is set to pass
€30bn
€30bn
in 2025
All revenue streams continue to grow


COMMERCIAL REVENUES
growth
GATE REVENUES
growth
TV REVENUES
growth
REVENUE FROM UEFA
has also increased significantly
projected growth

Club Revenues

Of the top 25 clubs
reported record commercial revenues in 2025
reported year-on-year commercial revenue growth of more than 10%
The full report features 12 club-by-club comparisons, including total revenue, player wages and cumulative squad transfer fees.
25
24
23
22
21
20
19
18
17
16
15
14
13
12
11
10
9
8
7
6
5
4
3
2
1
74
80
80
81
83
90
122
123
124
138
141
158
159
162
223
237
298
313
349
382
384
402
426
499
568
Commercial revenue in 2025 (€m)
But, these top-line figures hide the full story…
The quality of revenue streams varies. Revenue growth is being largely driven by labour- and resource-intensive streams, such as merchandising, licensing, premium ticketing products and stadium events.
Diversification is to be welcomed, but such streams often come with a higher cost base and are harder to guarantee.
CLUB COSTS
Increases in non-wage operating costs again outpaced revenue growth.
They now absorb 36% of club revenue, the highest share for 15 years.
Non-player wage costs also increased, by 8%. That’s being driven by higher numbers of full-time staff and underlying wage inflation.
Financing expenses have increased by more than 50% since the pandemic.
Clubs are managing their key assets – players – better than in the past.
Player wages rose by just 1.8% in 2024
Clubs are managing their player contracts to avoid loss better.
The tracking of more than 4,000 players indicates only 3-4% of player asset value leaves on a free transfer.
Player wage costs actually decreased in five of the top 20 leagues, including France and Spain


Challenging trends

Costs
PROFITABILITY
These cost base pressures mean that record income and transfer profits don’t automatically translate to profitability.
CLICK TO EXPLORE CLUBS’ PROFITABILITY IN DEPTH
A record total transfer income of
was recorded in 2024
Plus...
Net transfer costs decreased considerably |
FROM
IN 2023
TO
IN 2024
However, significant losses continue… |
Top-division clubs’ aggregate pre-tax losses improved only slightly in 2024 |
FROM
IN 2023
TO
IN 2024
The underlying picture is improving, though. |
Percentage of top-division clubs’ reporting profits before tax
2021
2022
2023
2024
2025*

Profitability
*Early-reporting clubs
The proportion of top-division clubs reporting profits before tax across the top 20 leagues
Clubs reporting profit
Clubs reporting loss
The full report features 18 country-by-country comparisons including total, average club, median club and year-on-year % change.
INVESTMENT
European football continues to attract sustained investor interest, but dynamics have shifted.
Top-division takeovers have stabilised after the record numbers seen during the pandemic. |
Investors are increasingly turning to second‑division teams and minority stakes to obtain a stake in European football. |
Controlling stakes were acquired at 29 European top-division clubs in 2025
Nine new US majority investors in top-division clubs in 2025
In total, 111 deals were identified in Europe in 2025
Capital injections and infrastructure investment are also at record levels. |

Investment
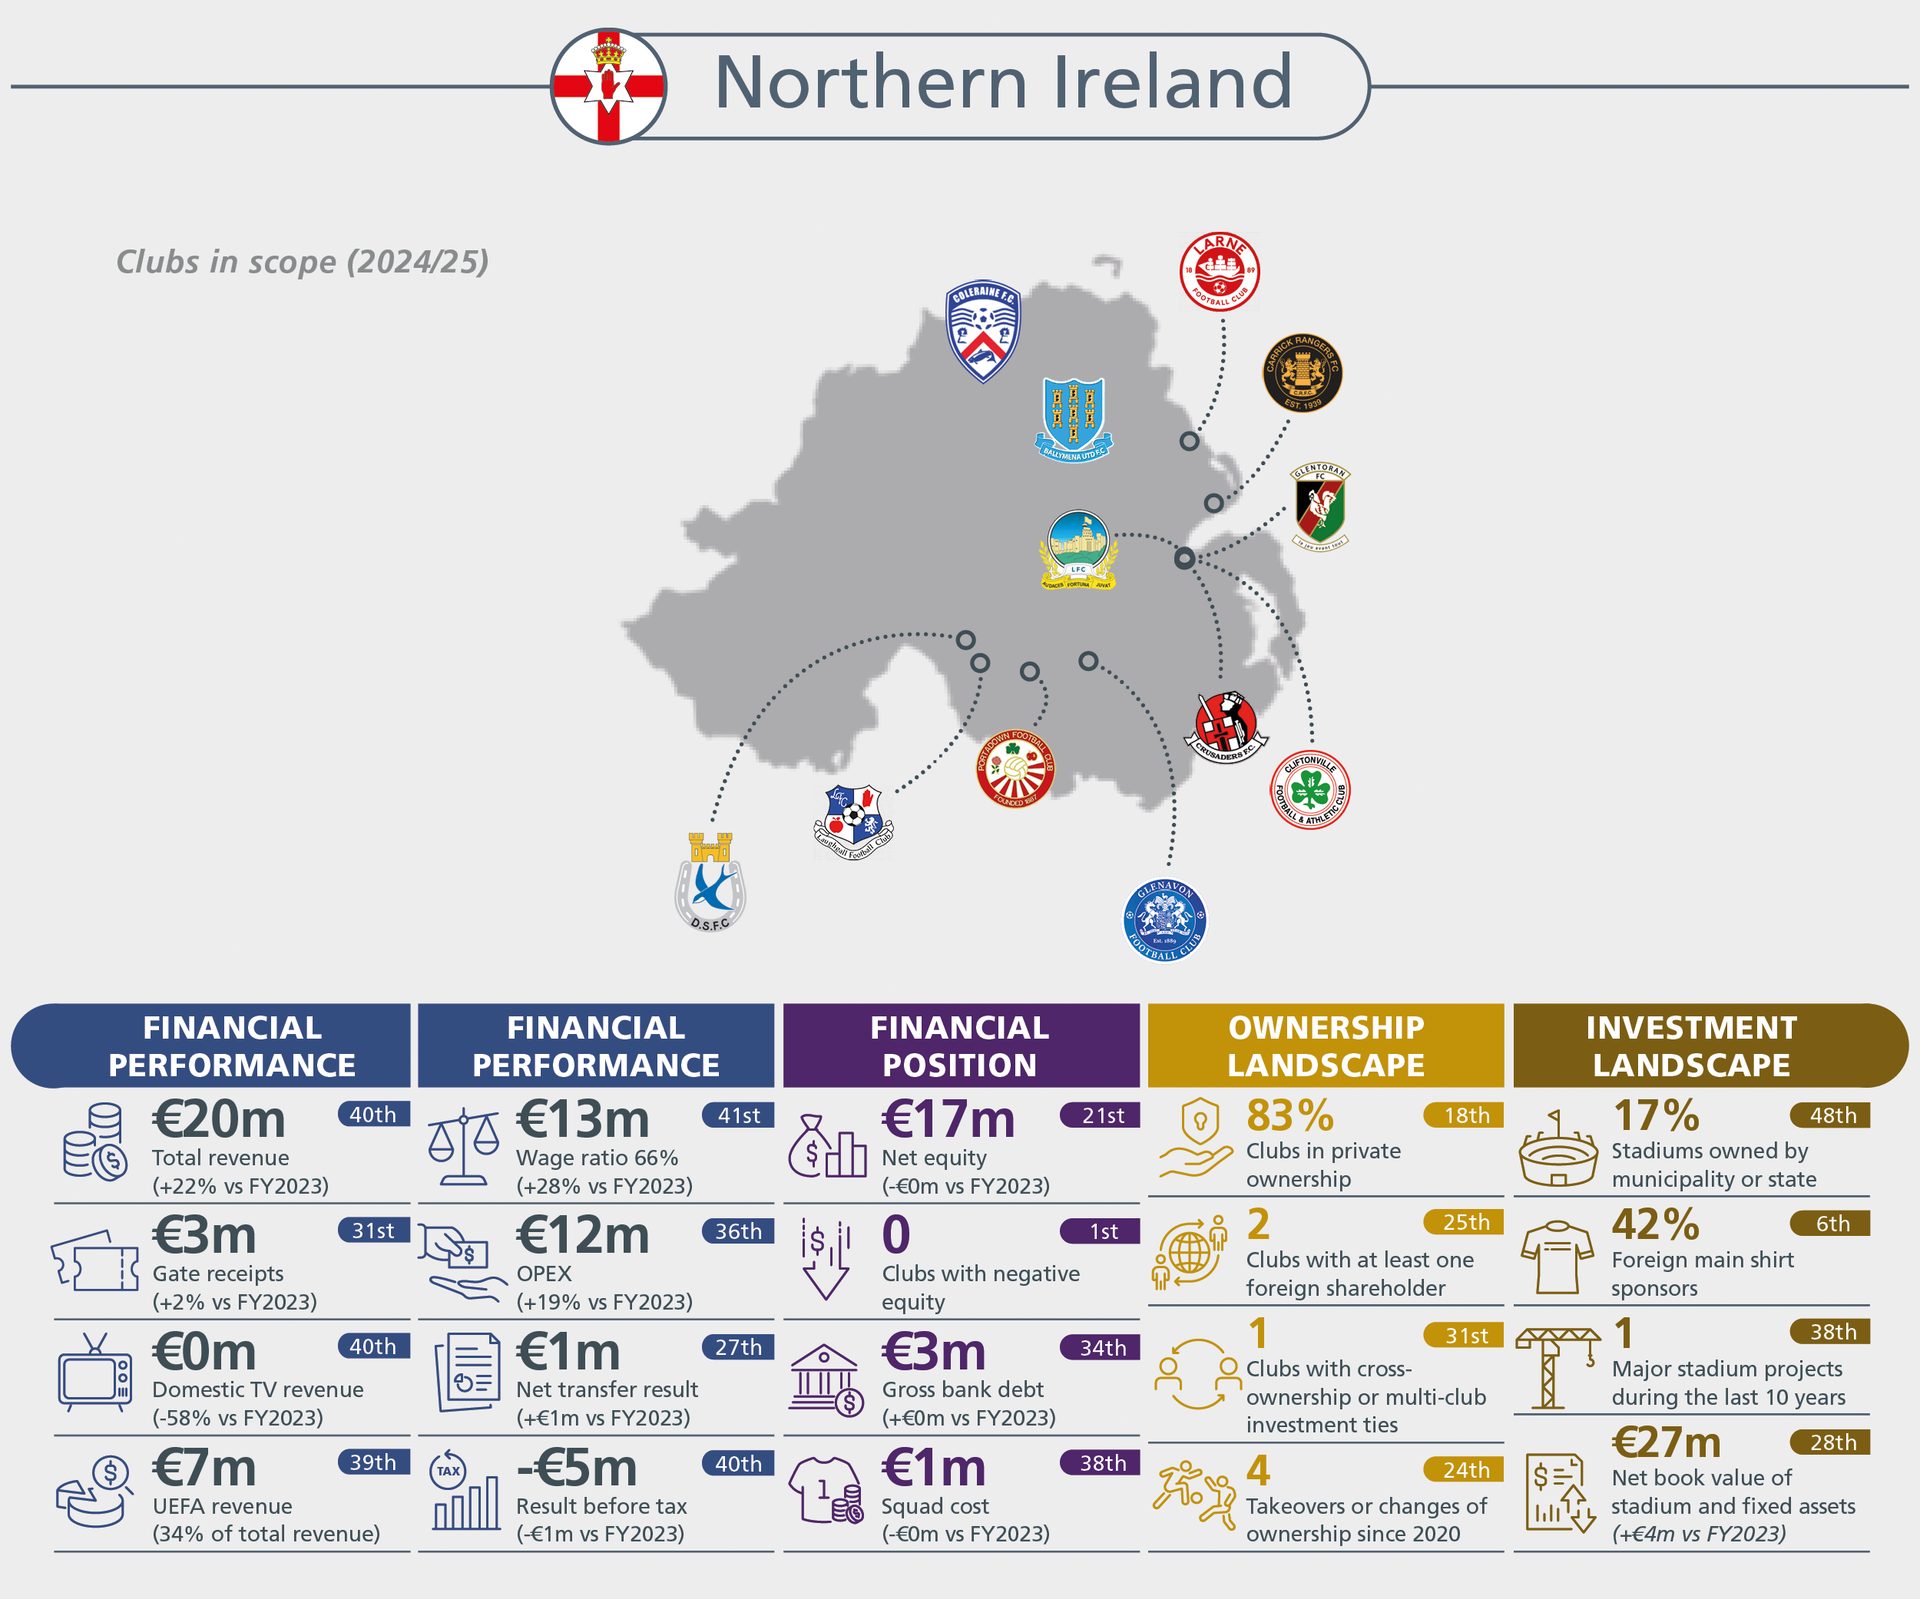
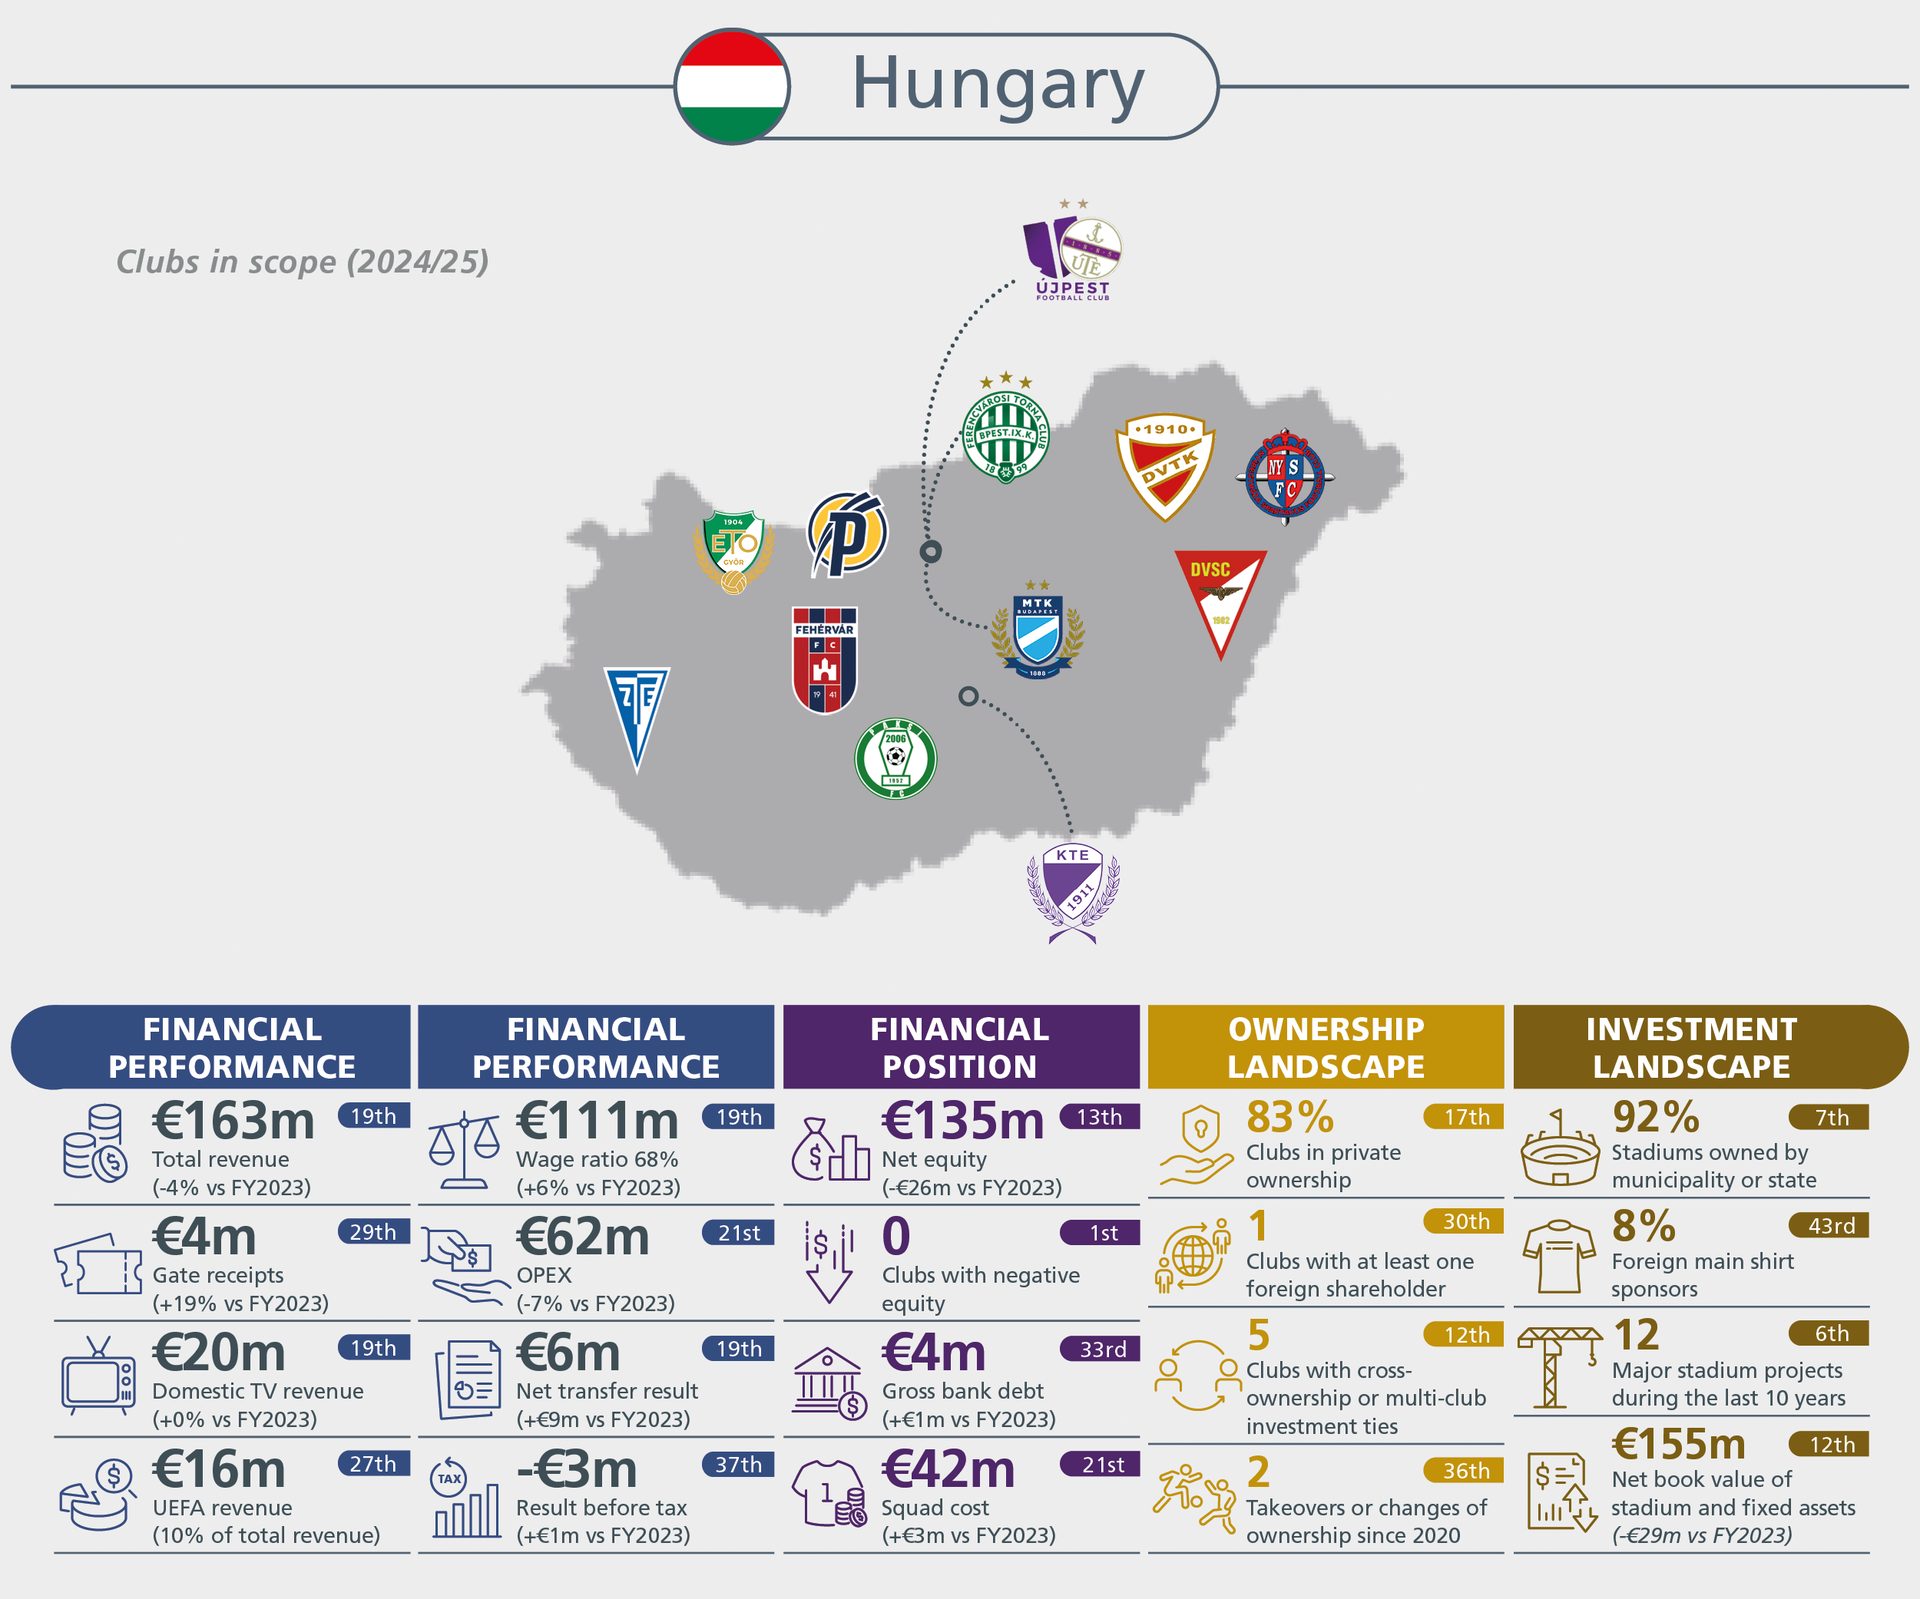
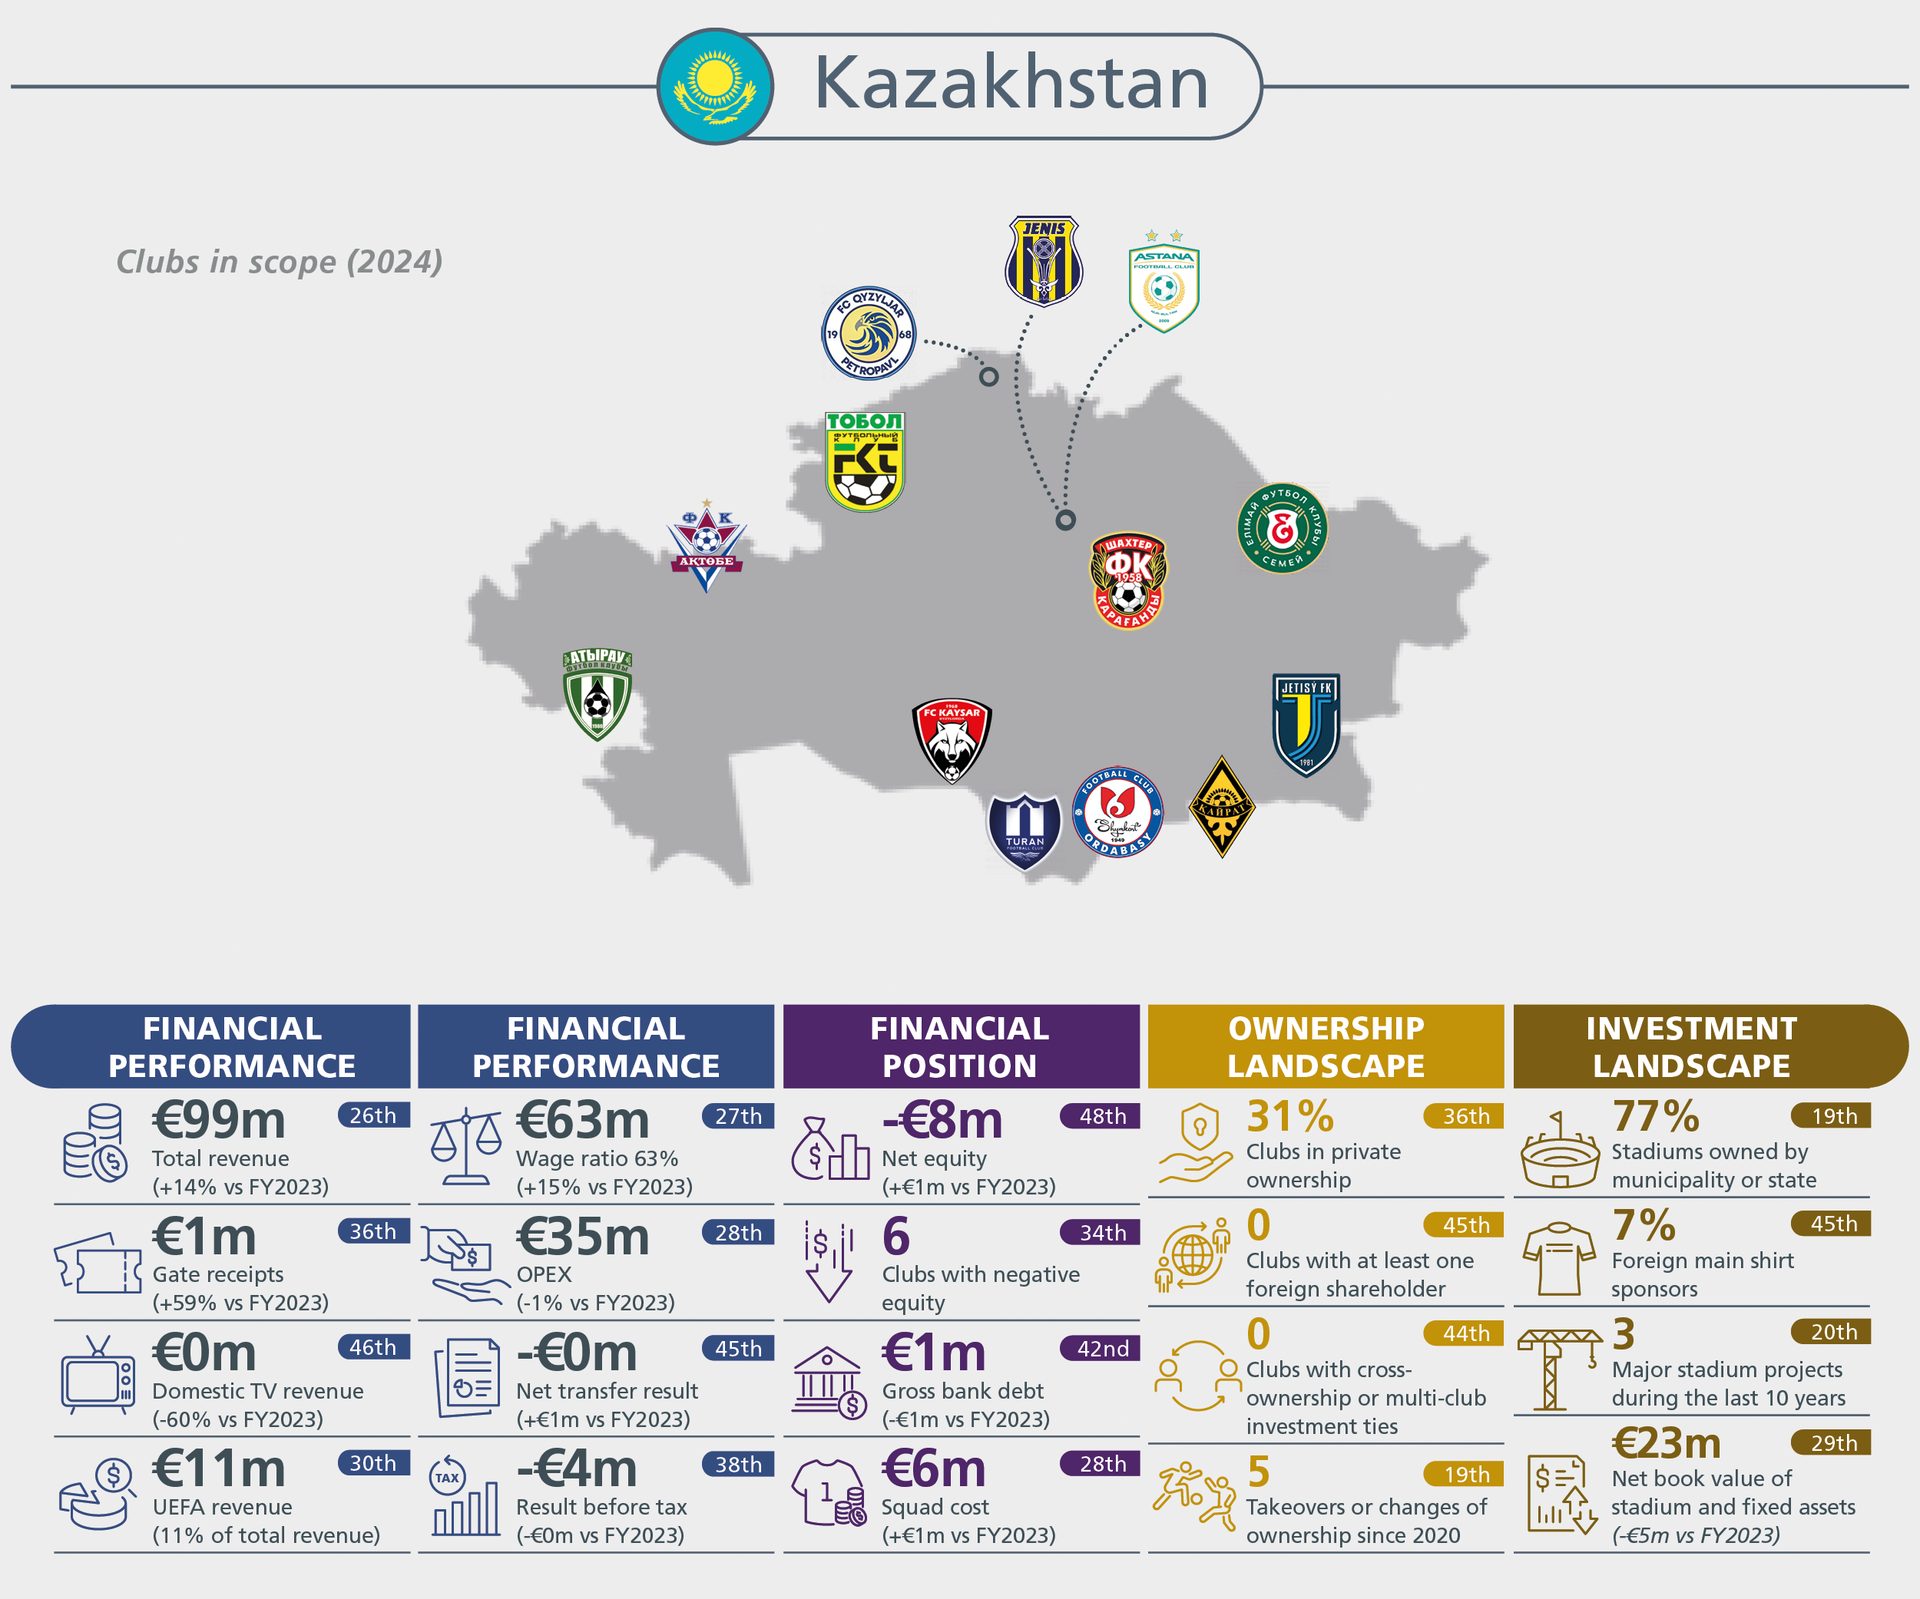
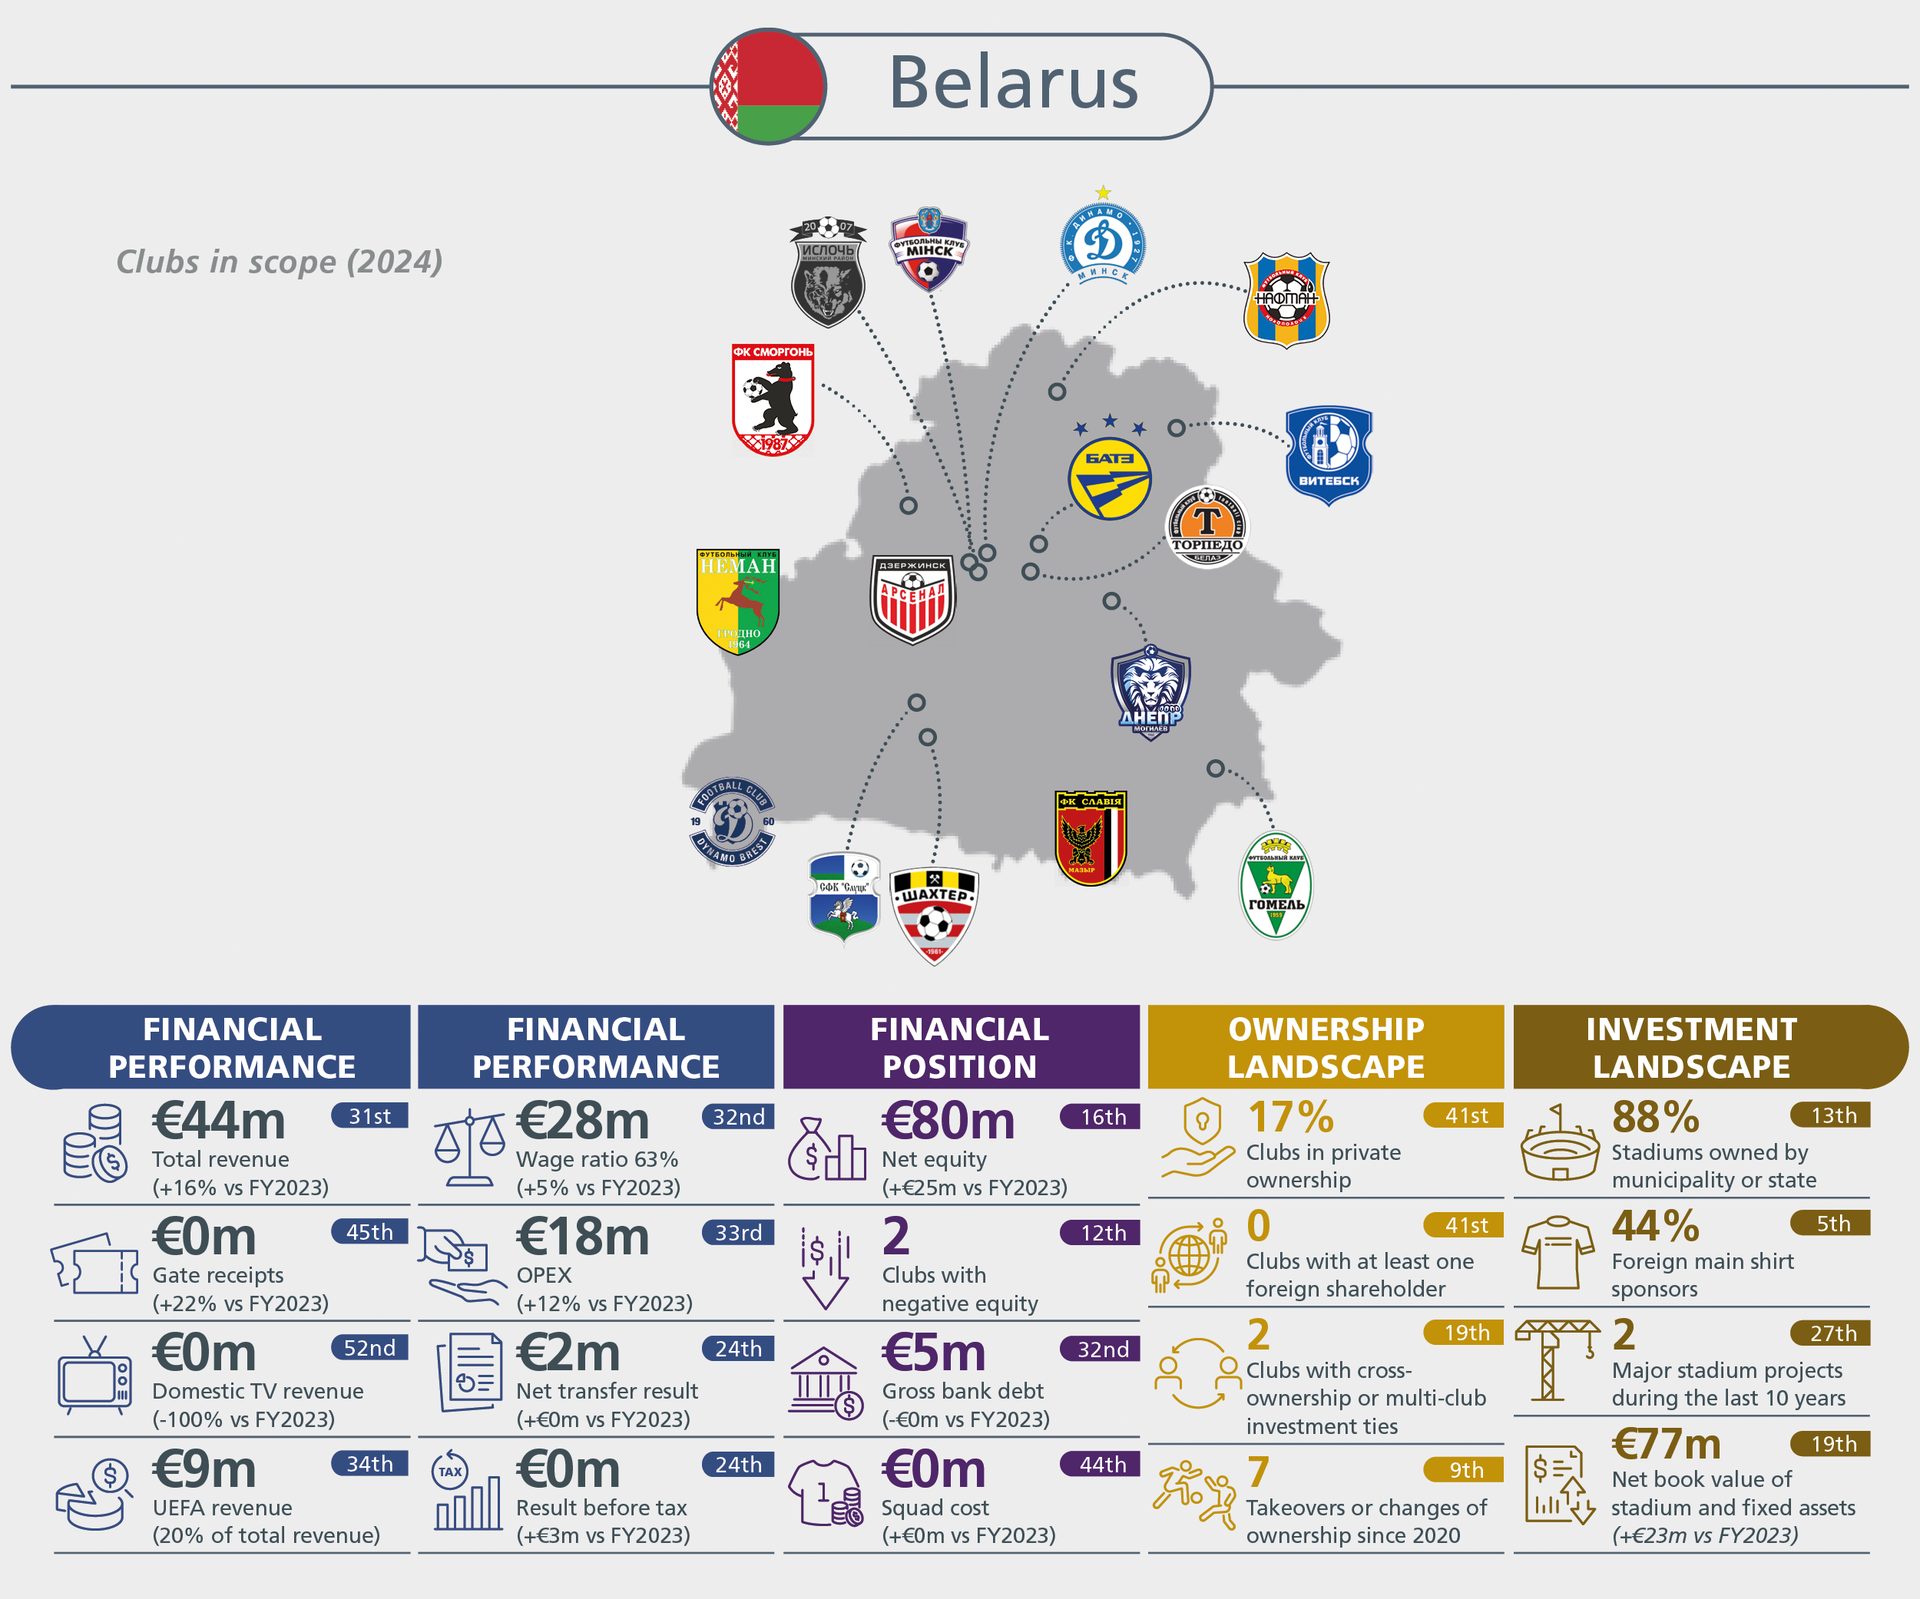
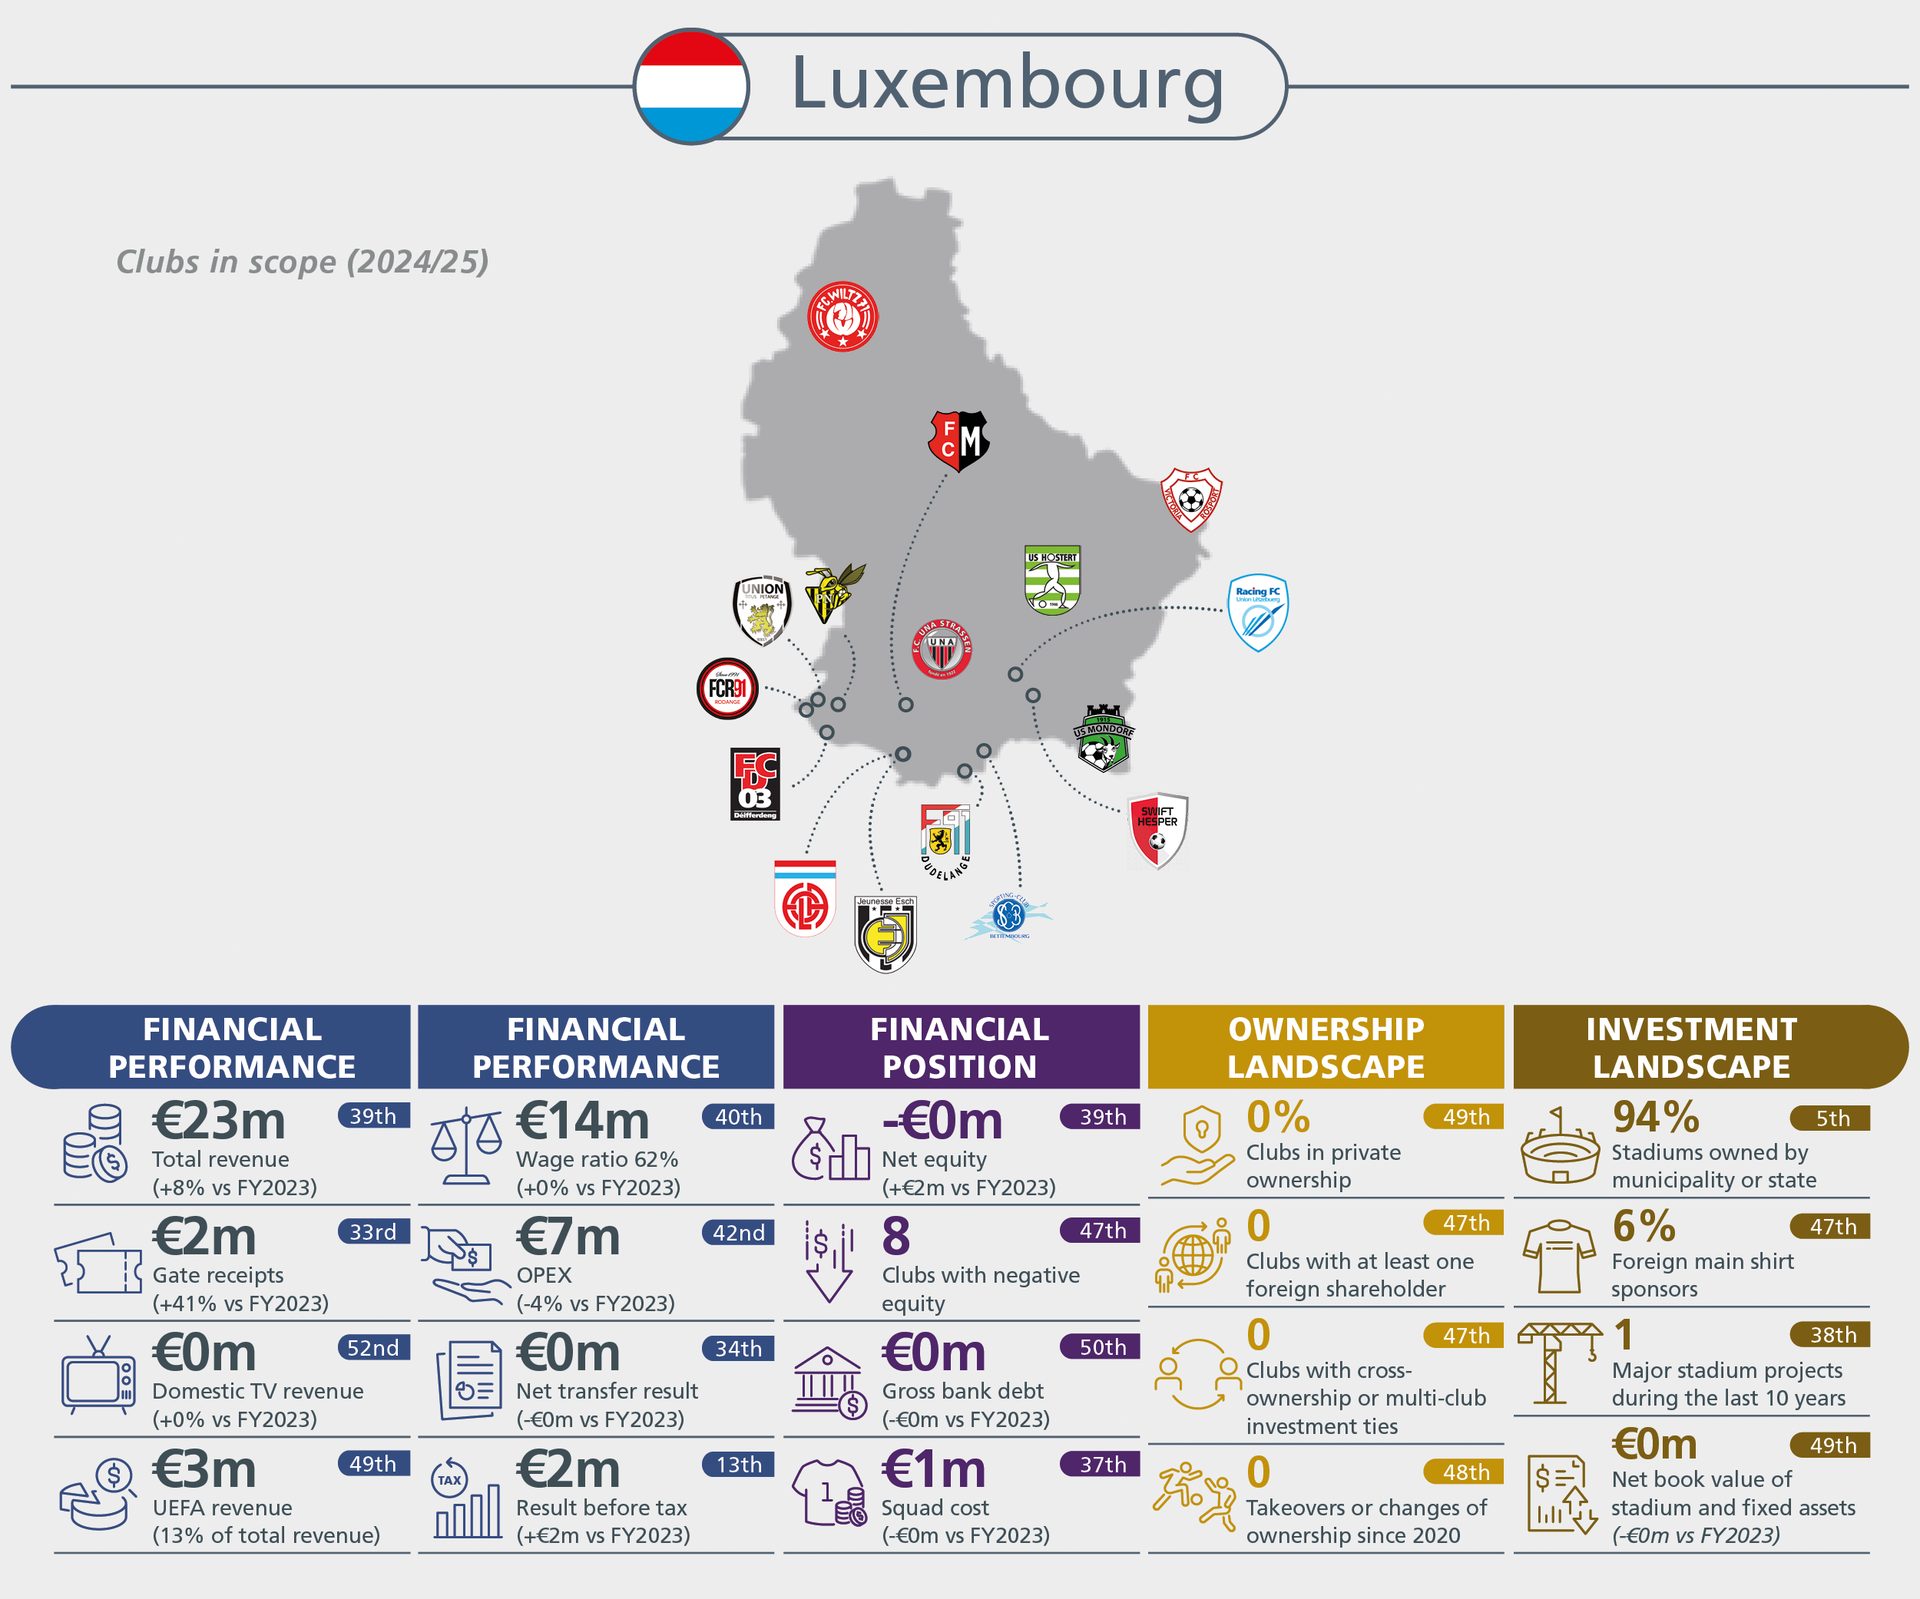
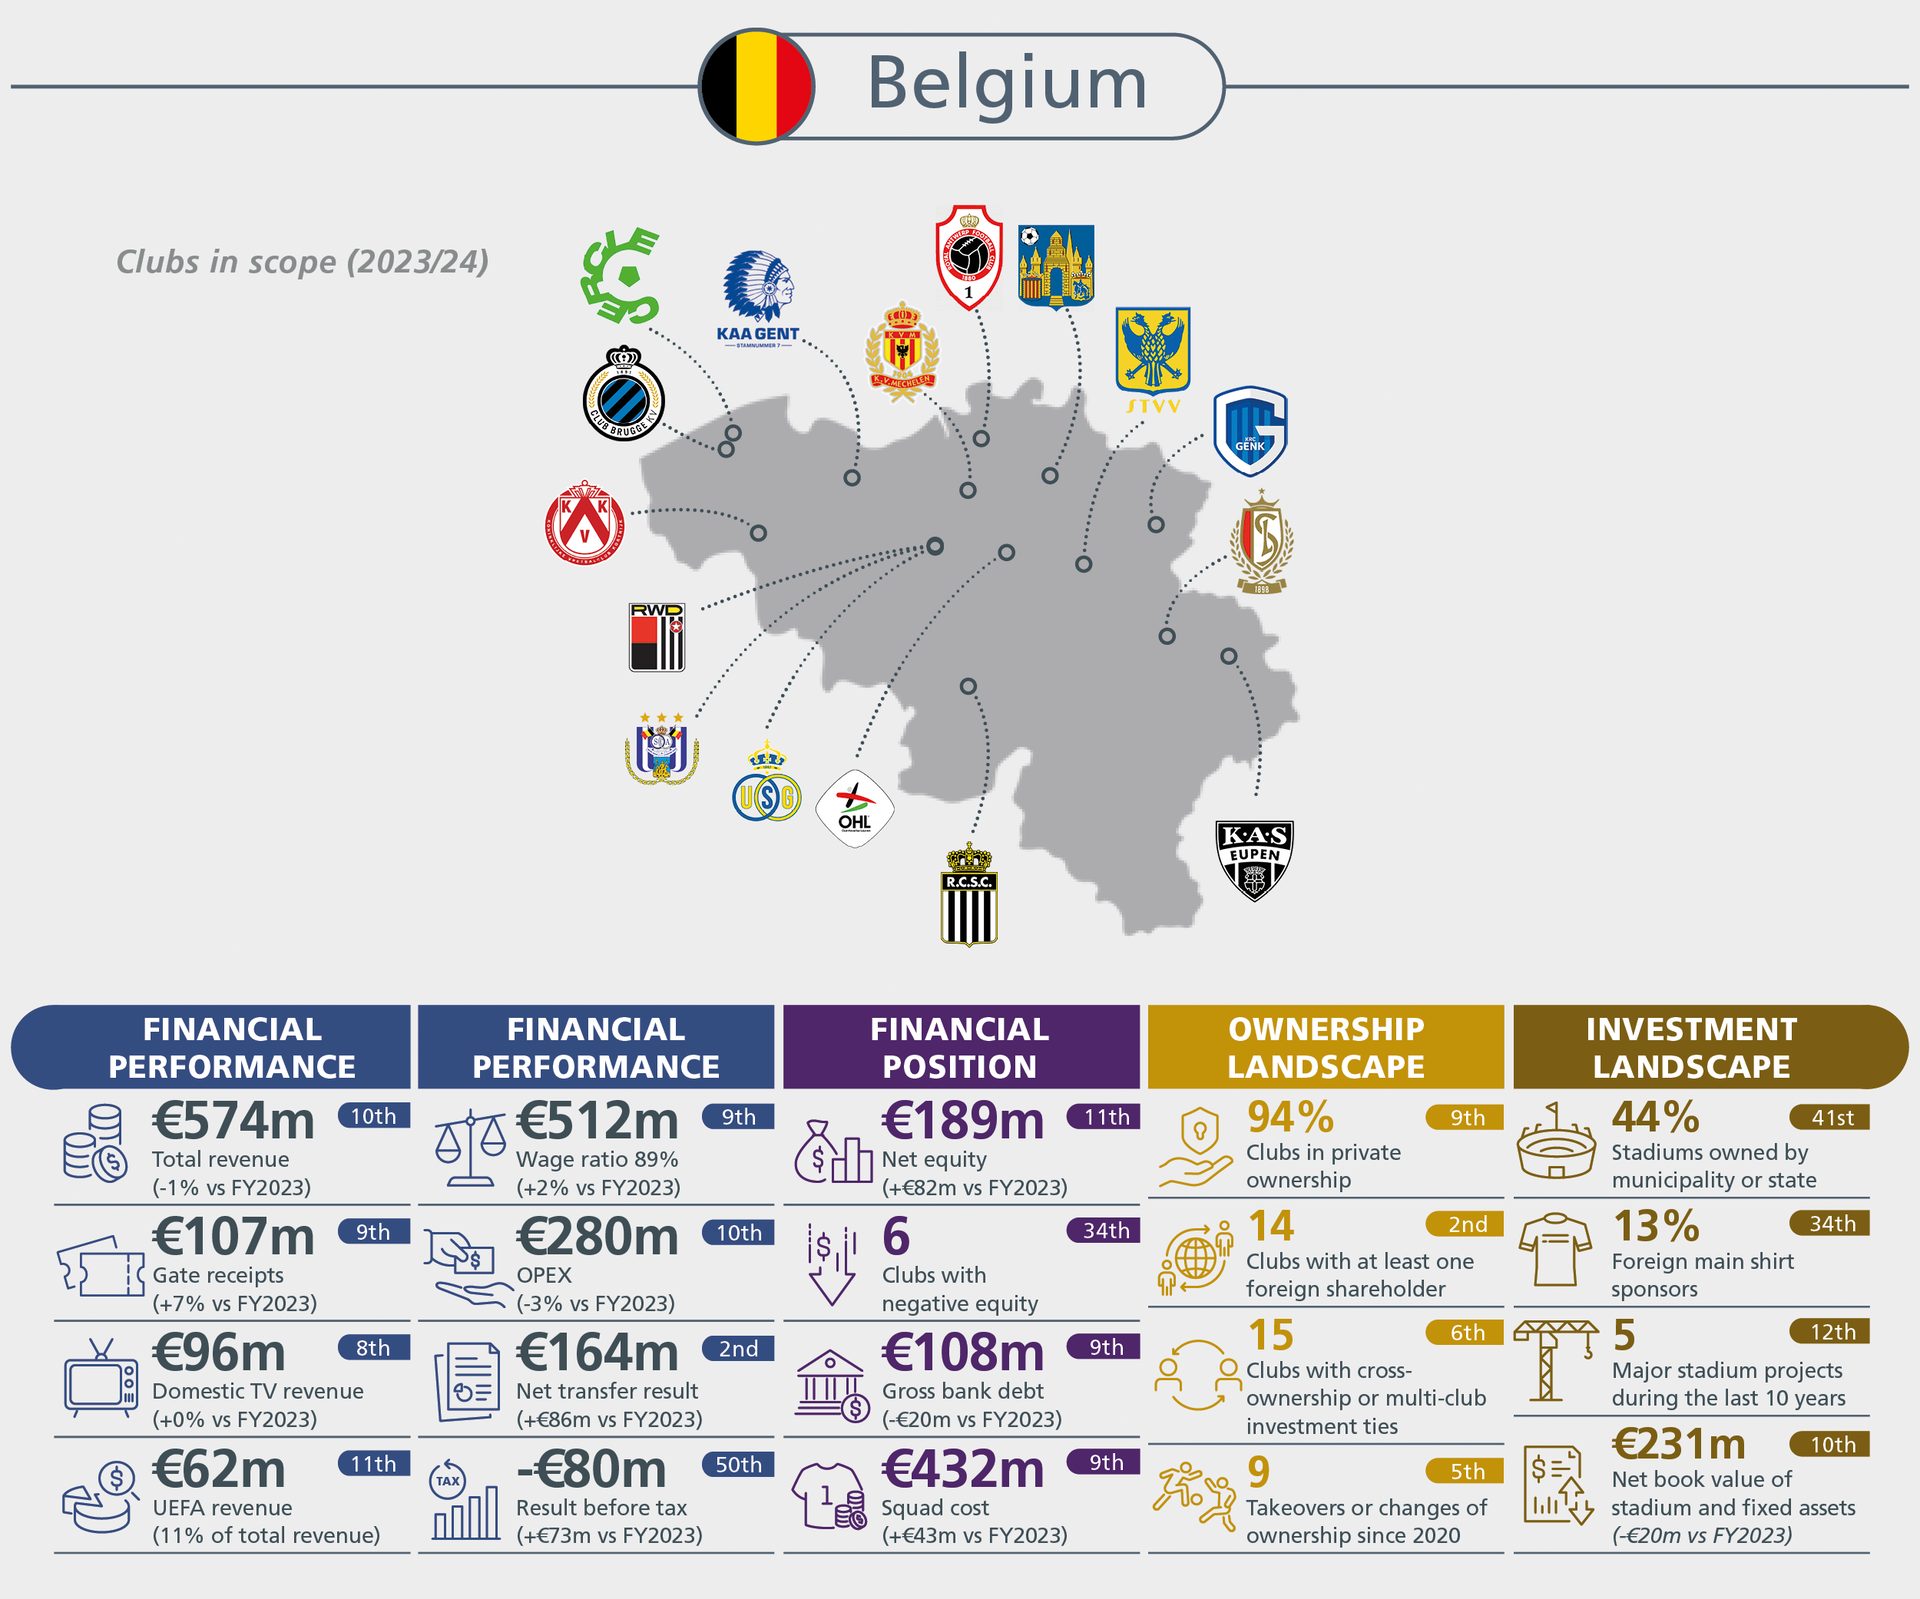
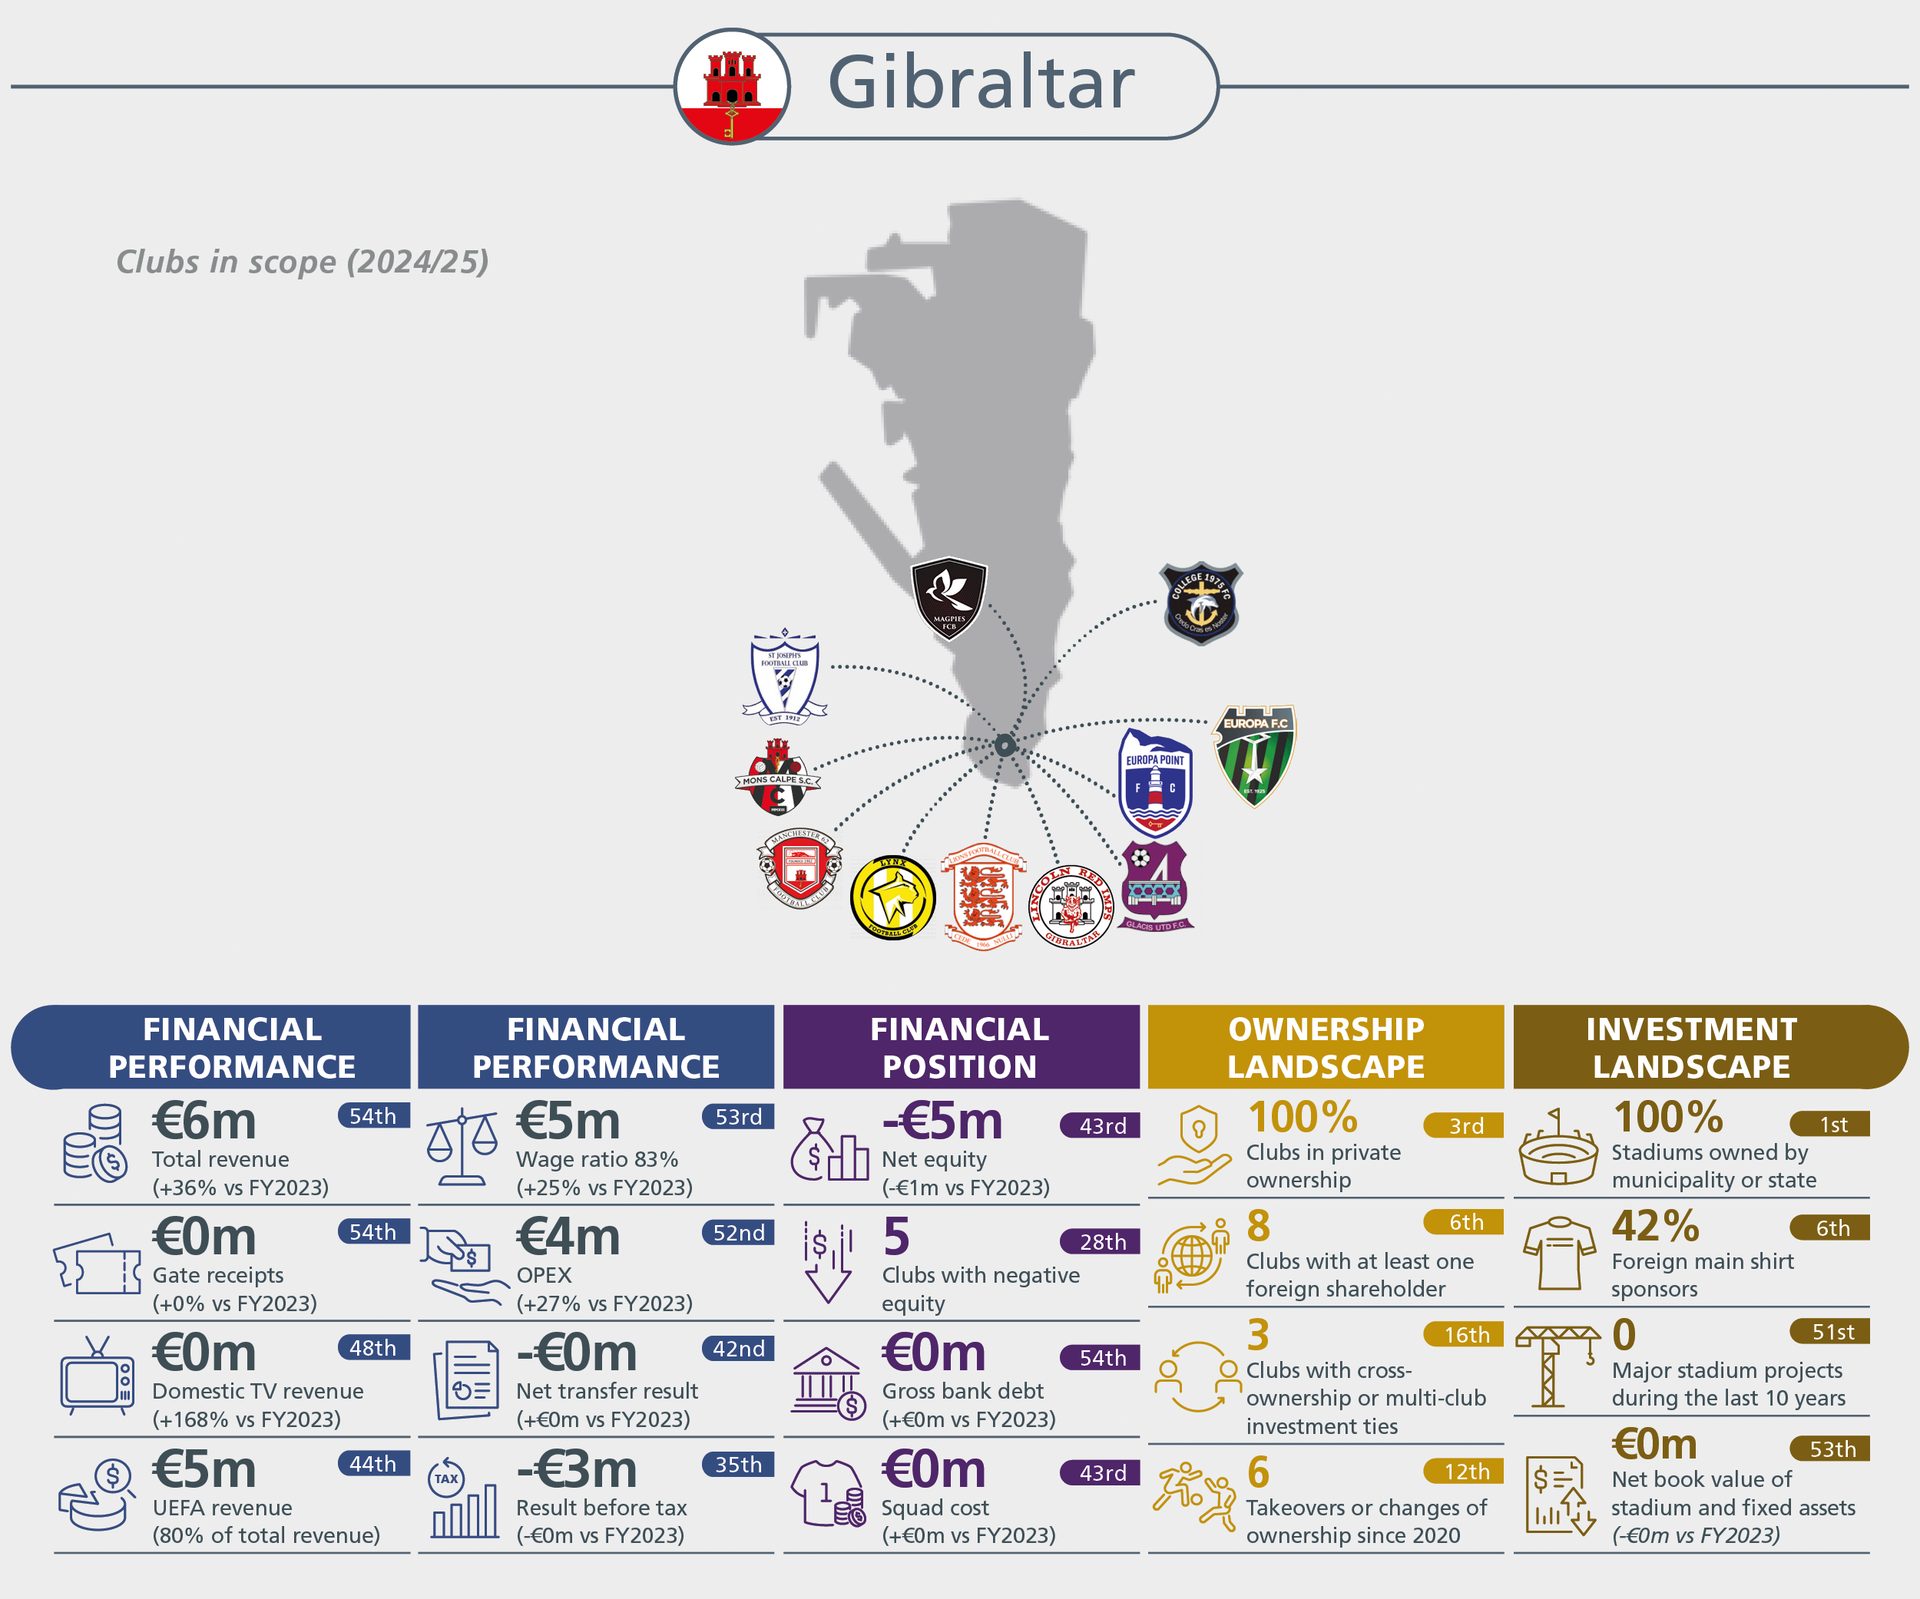
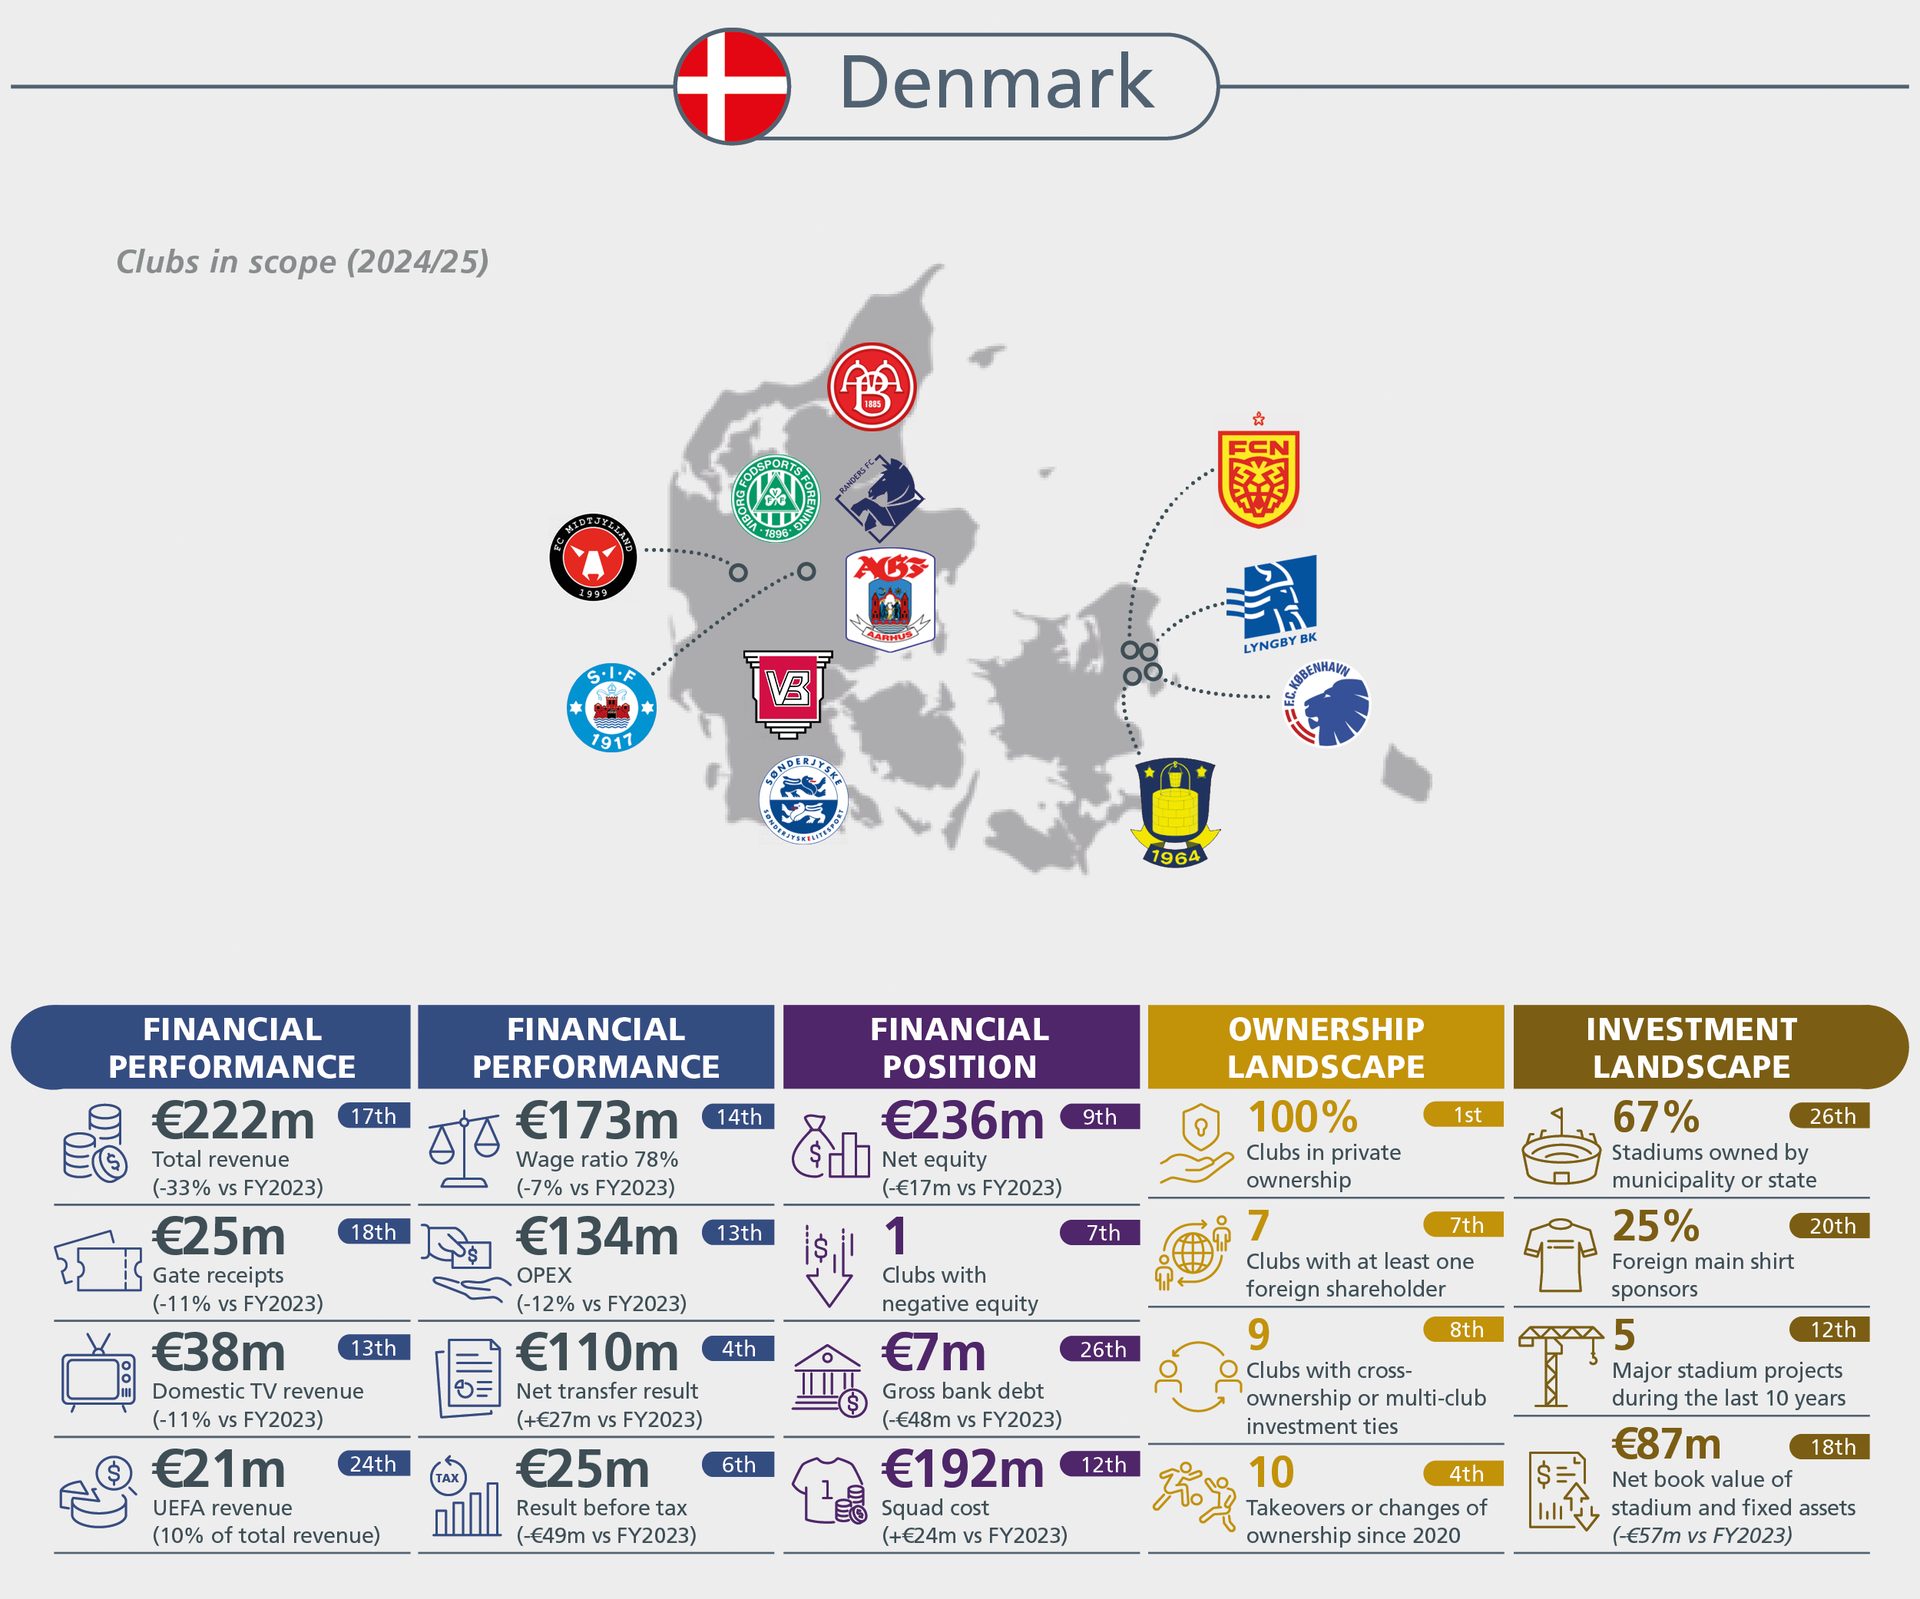
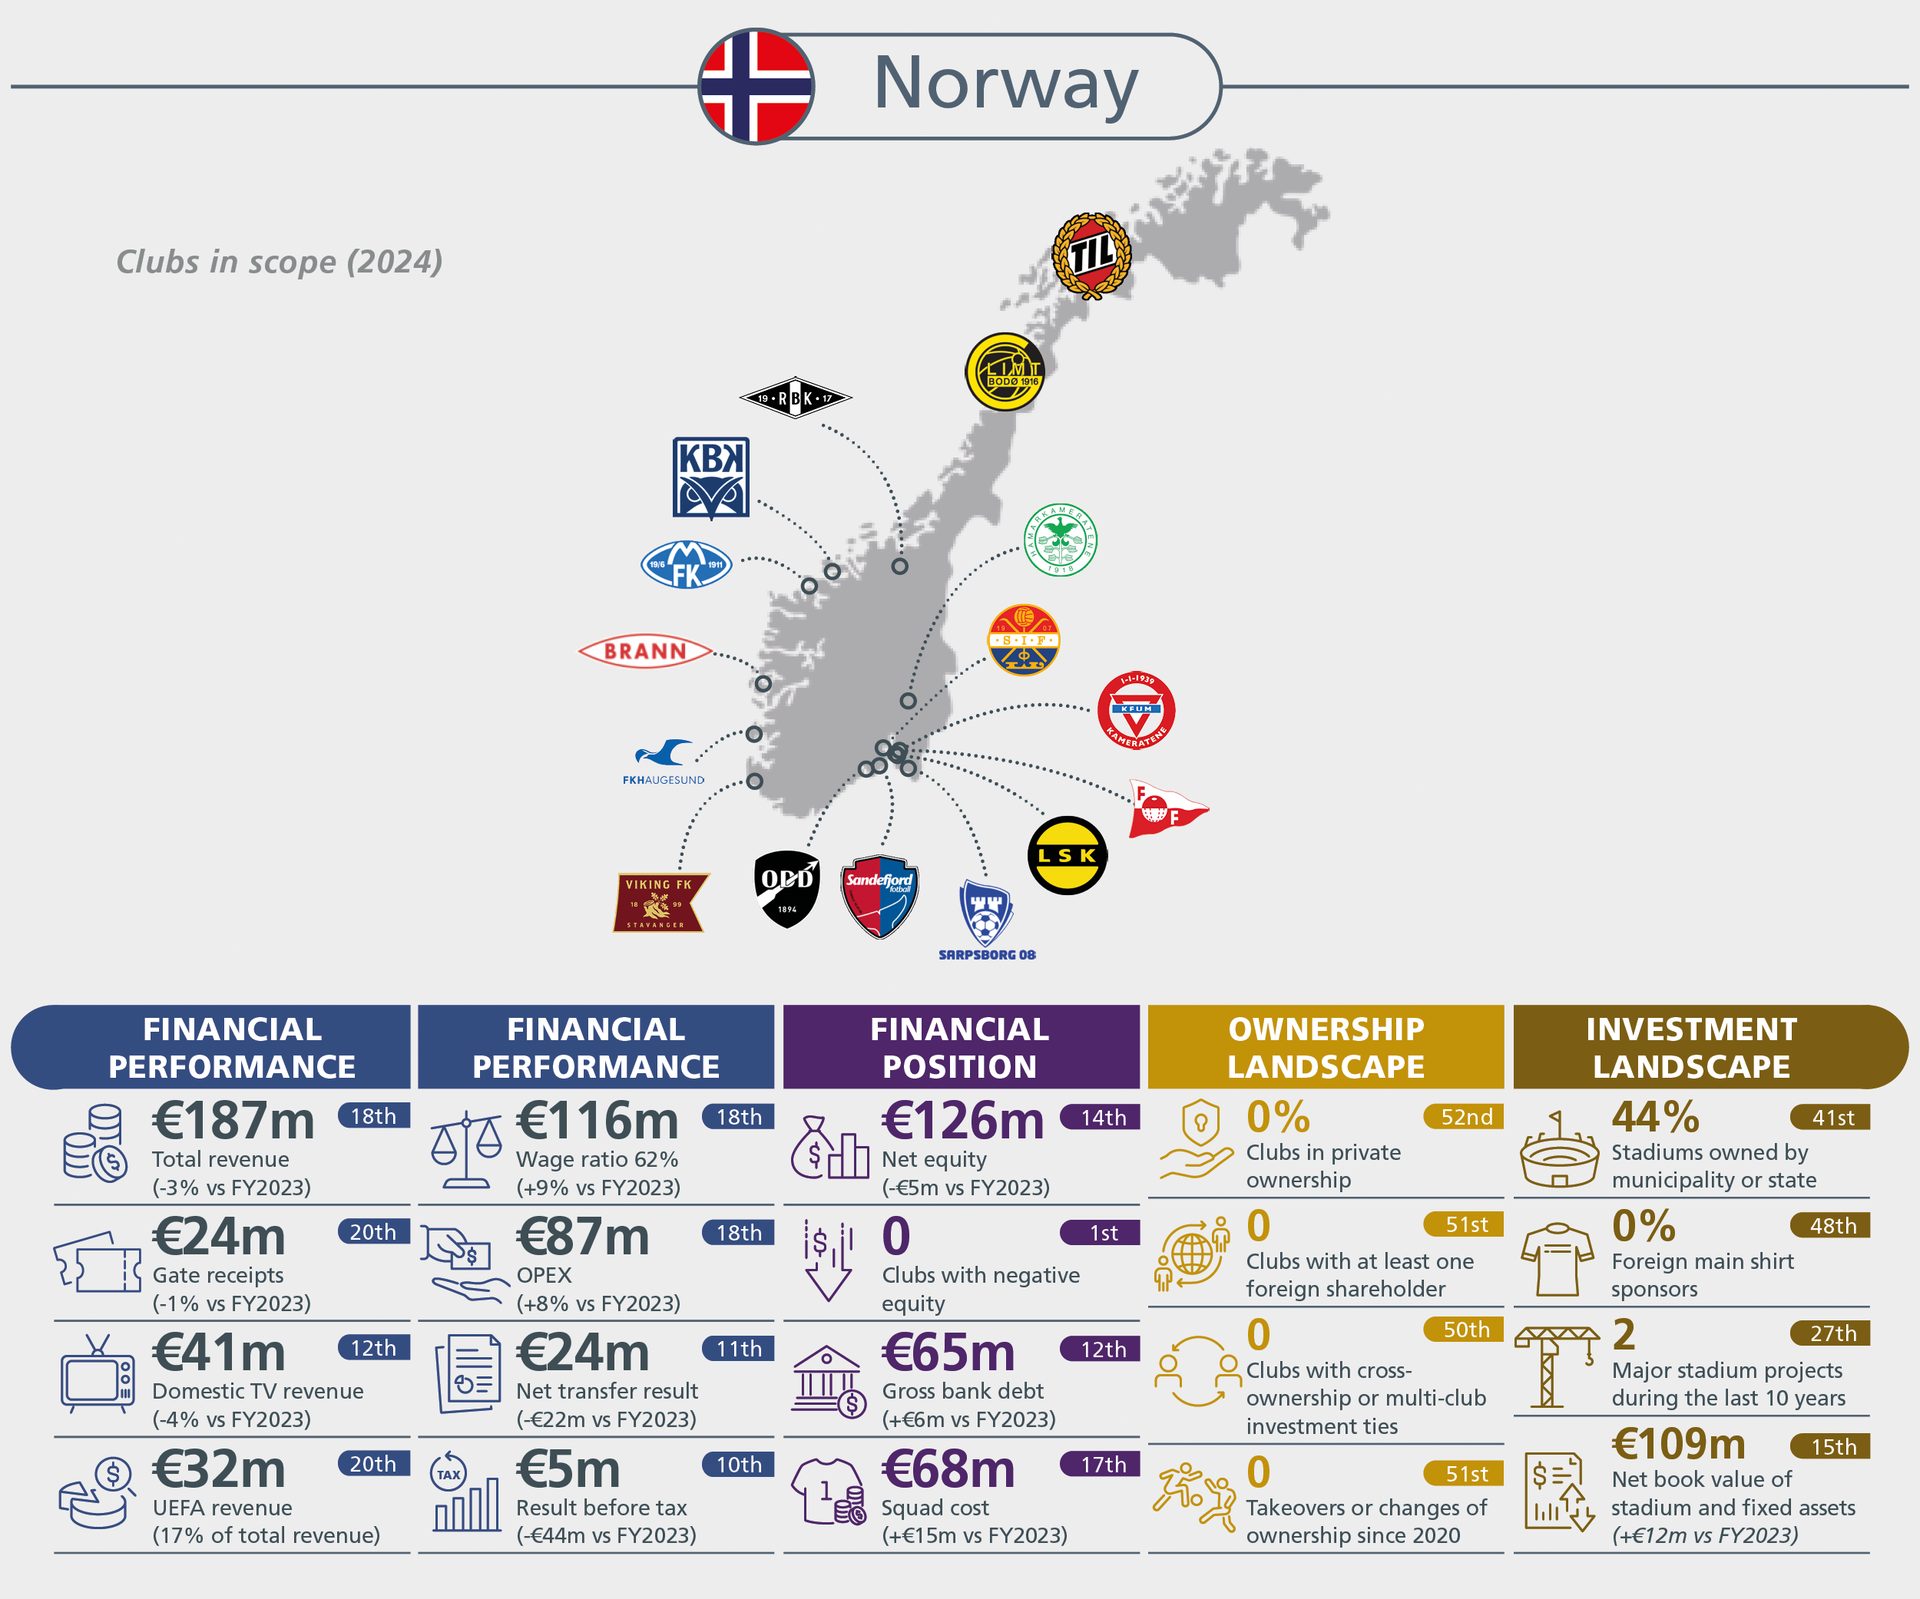
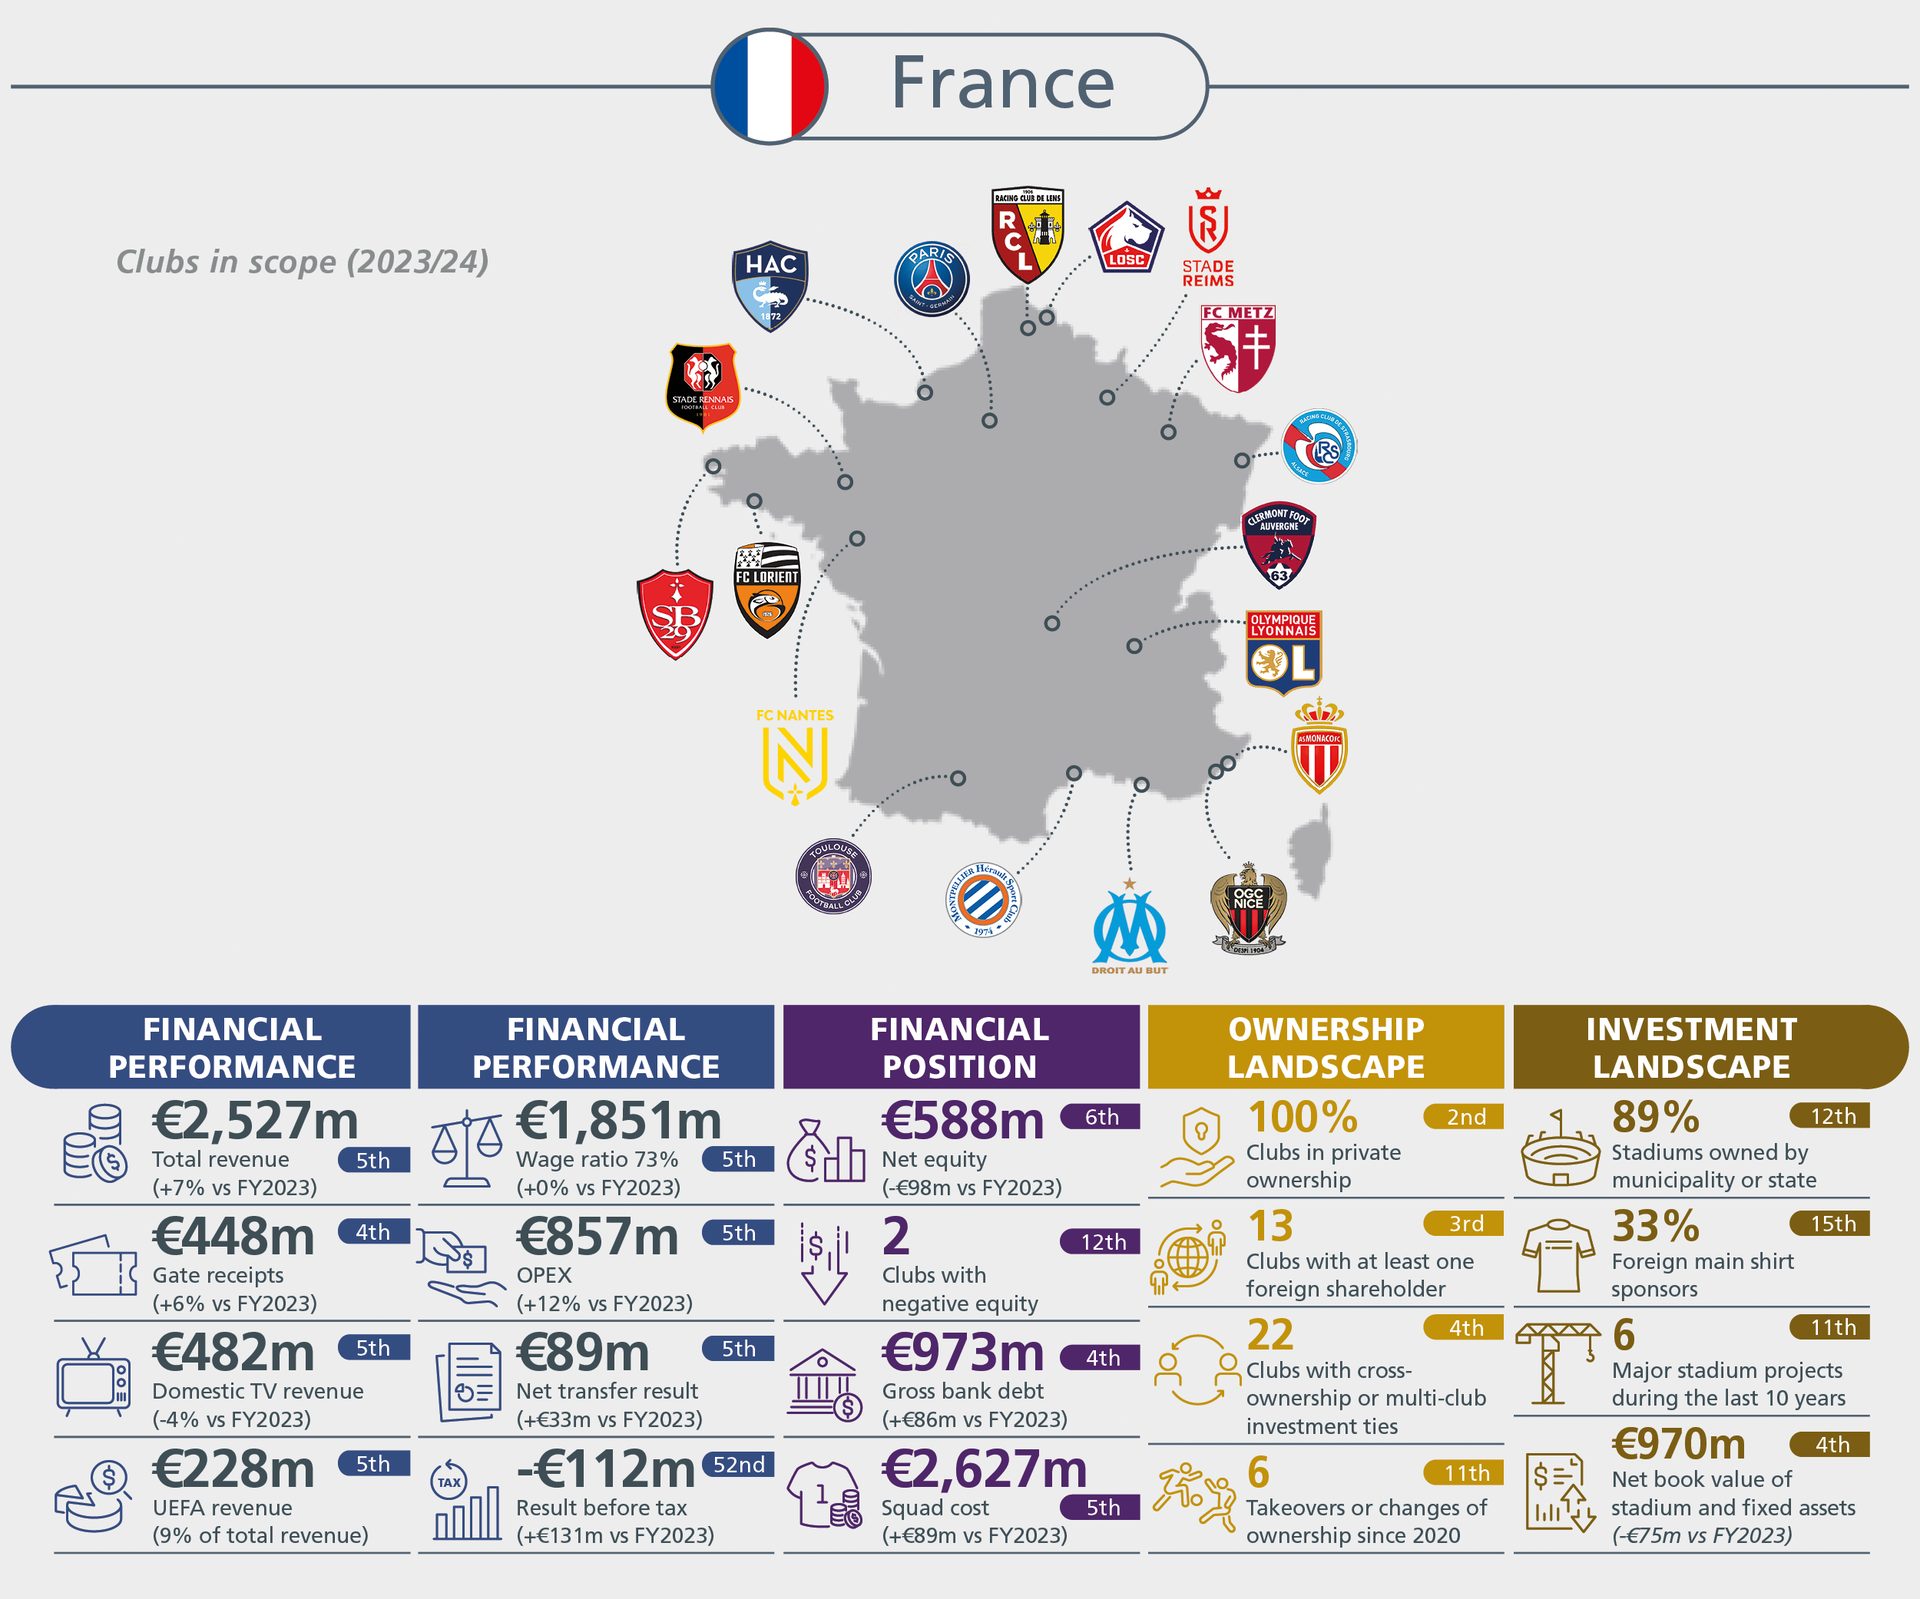
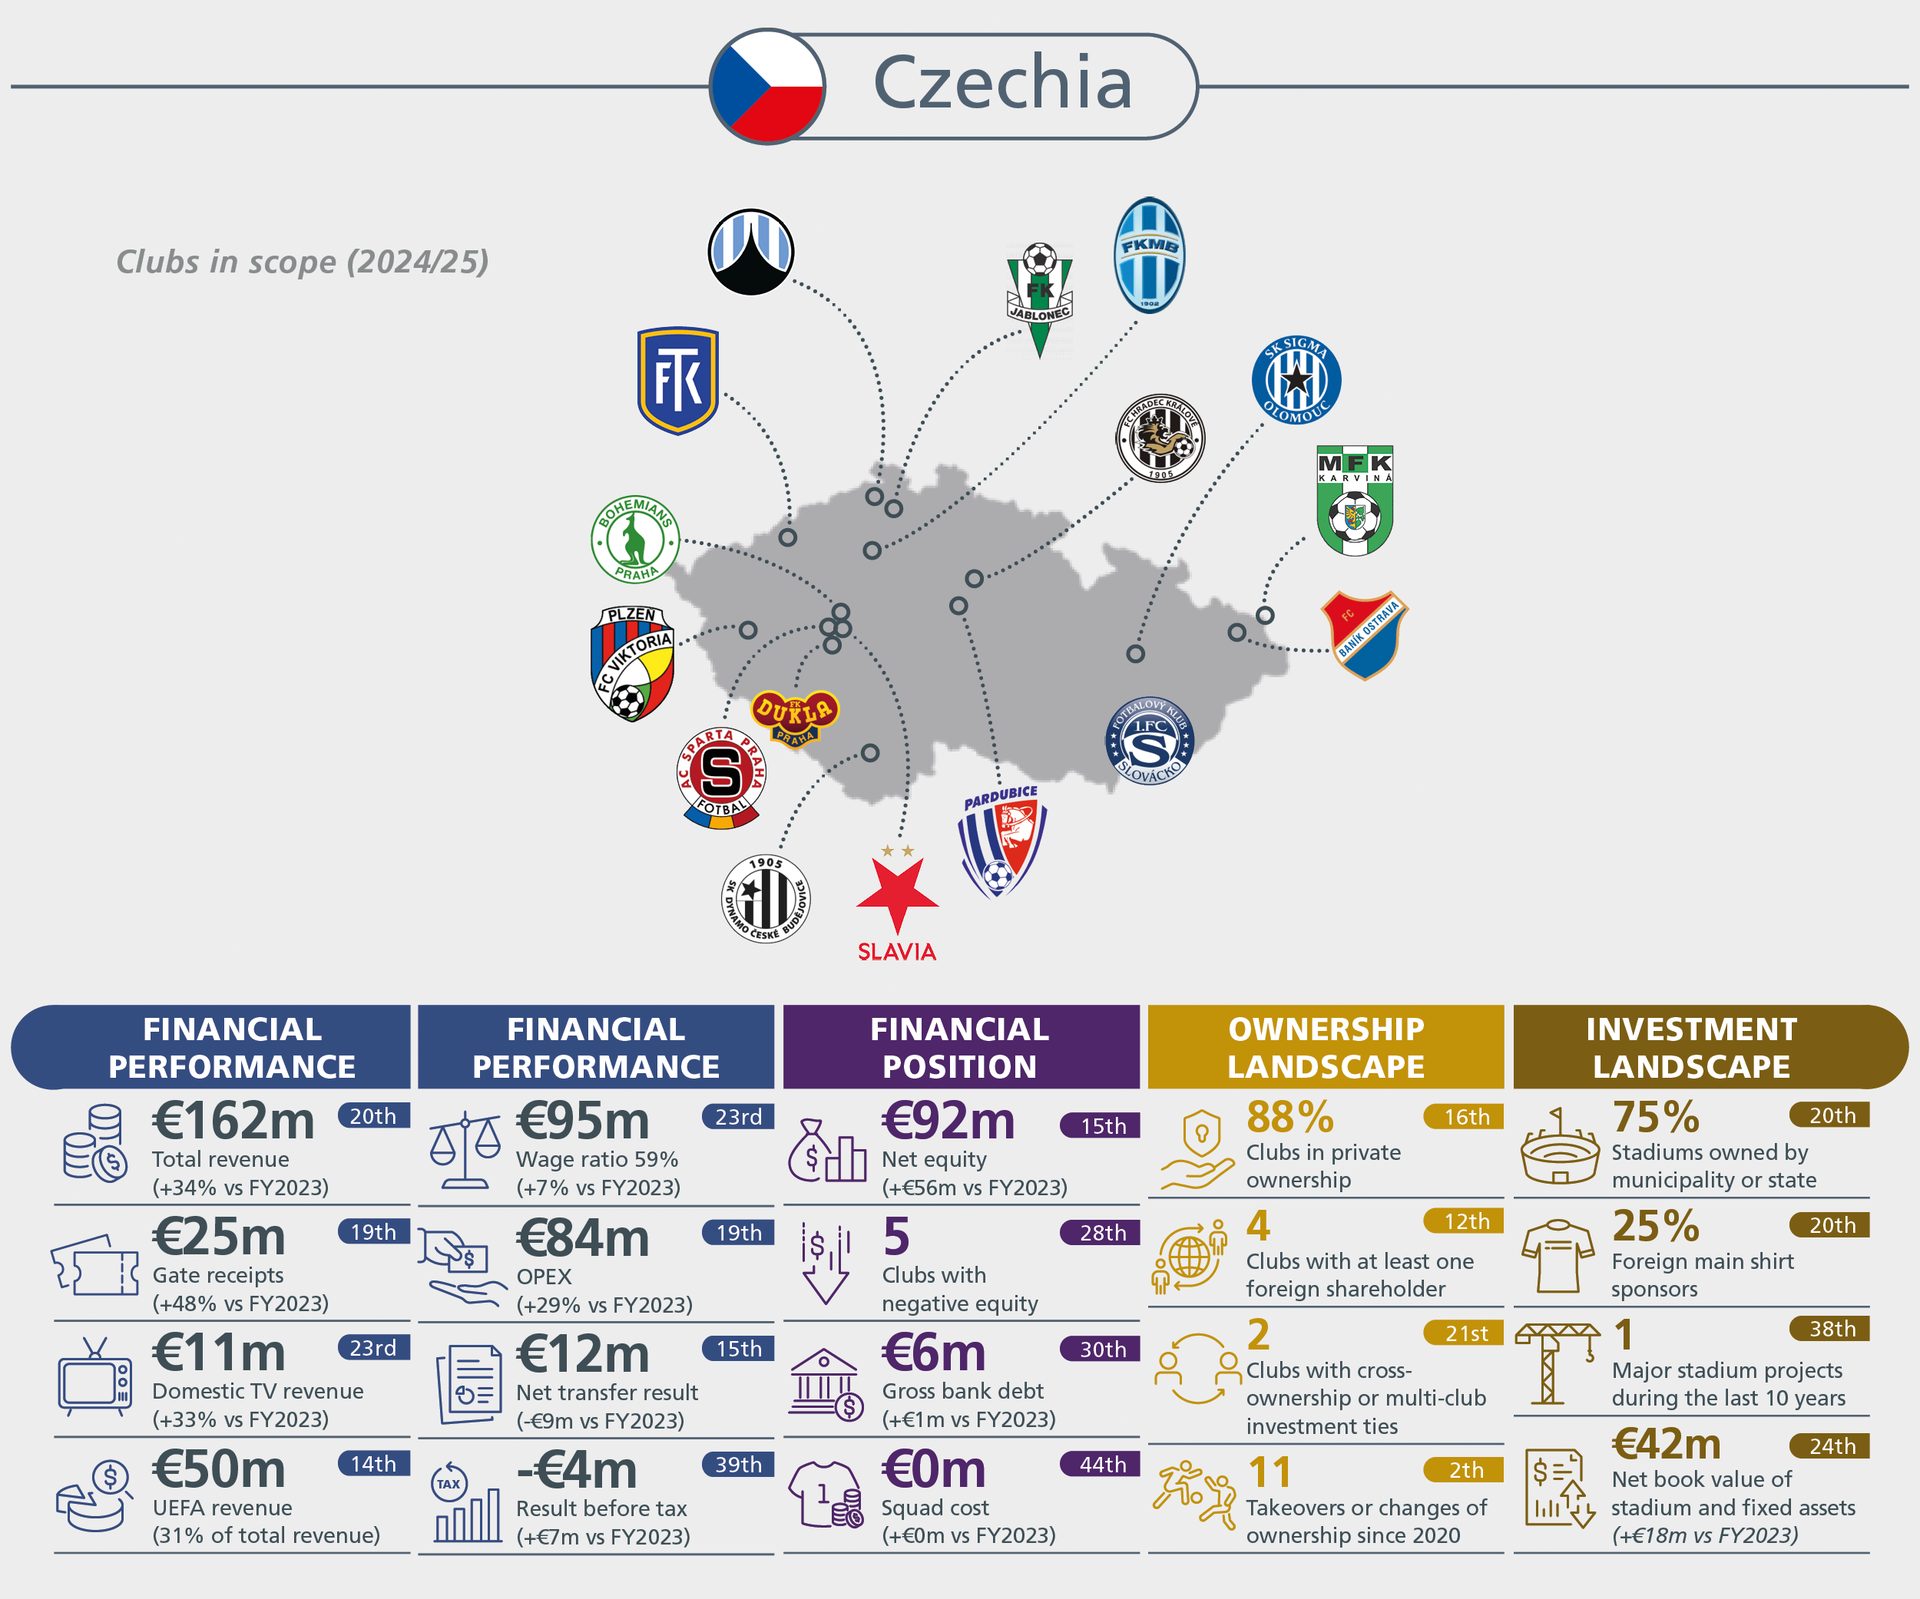
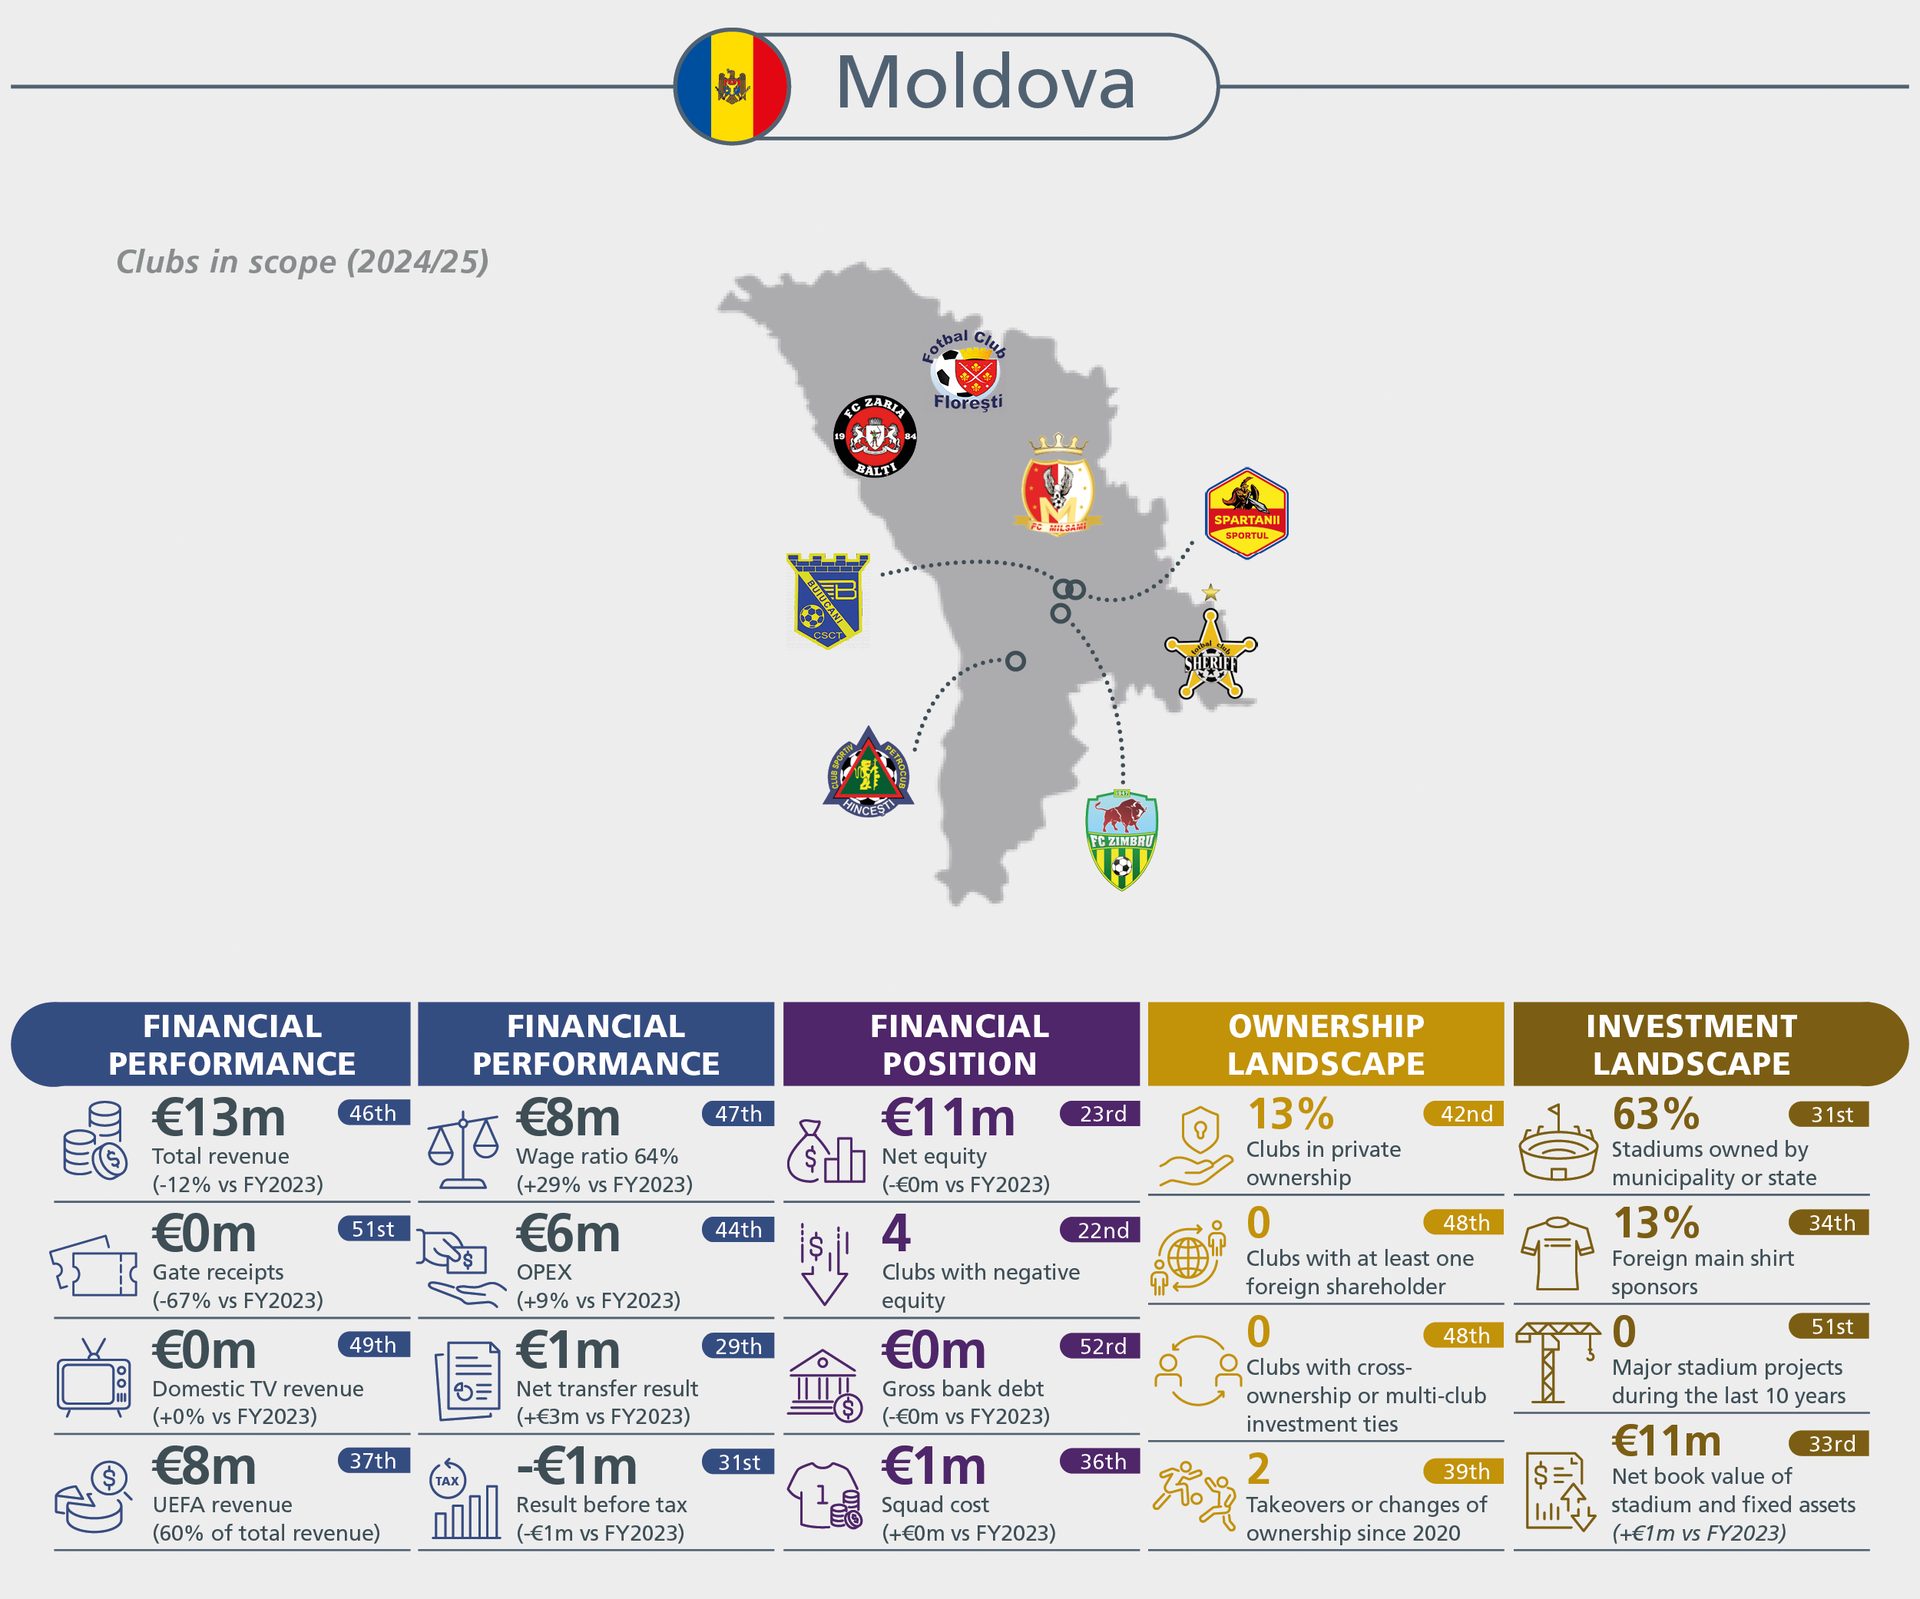
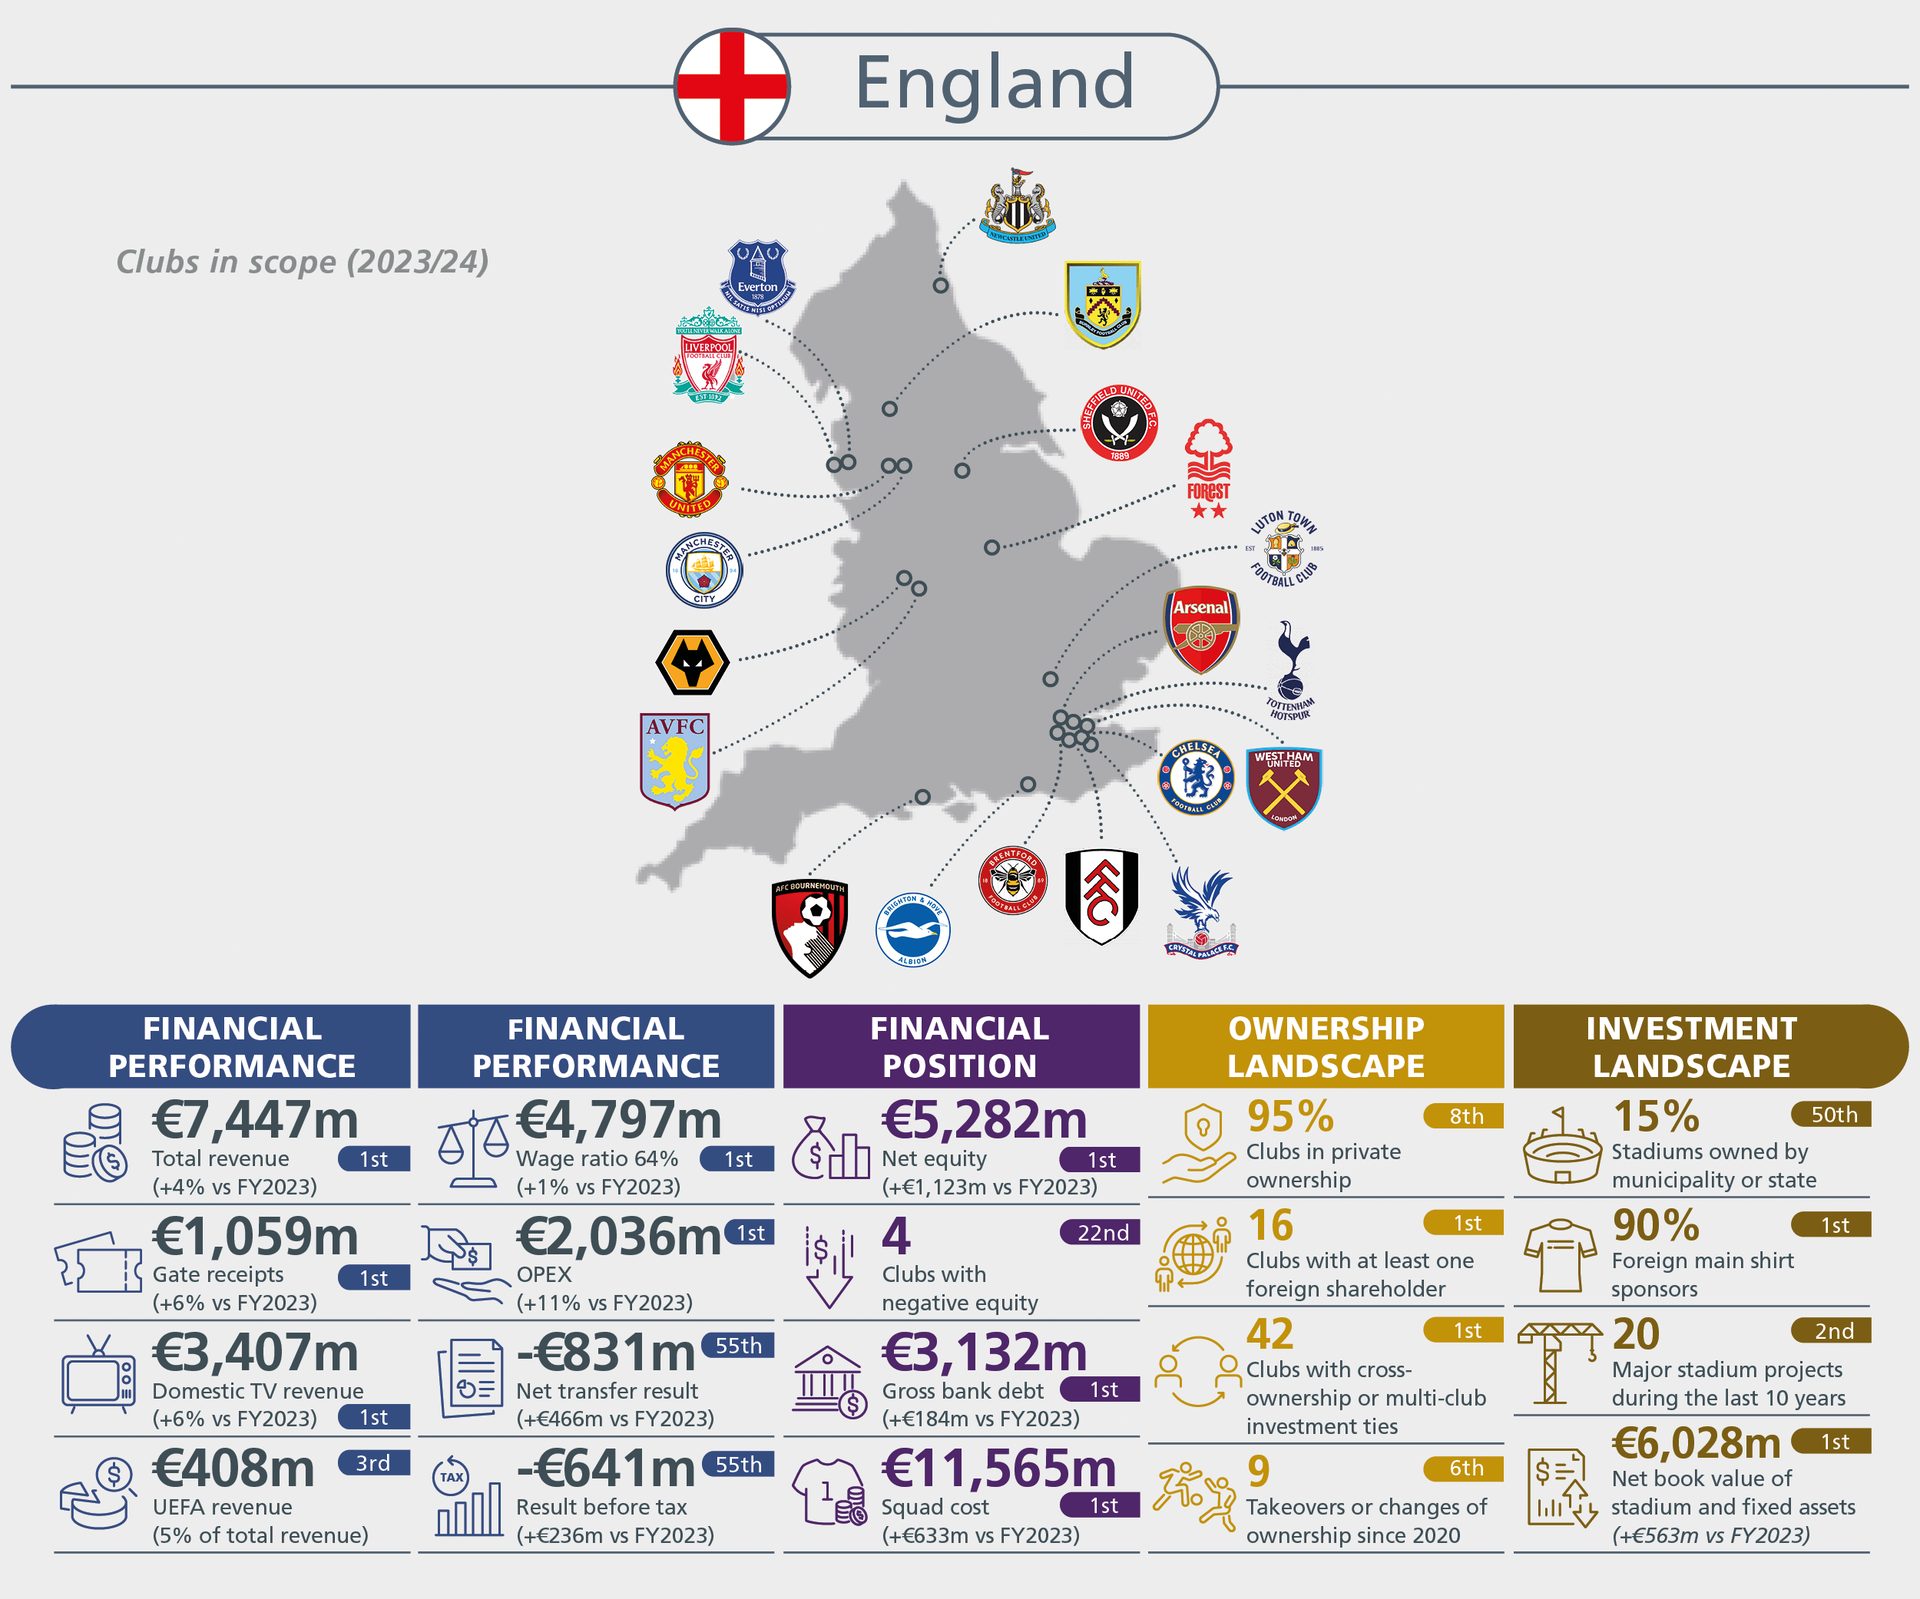
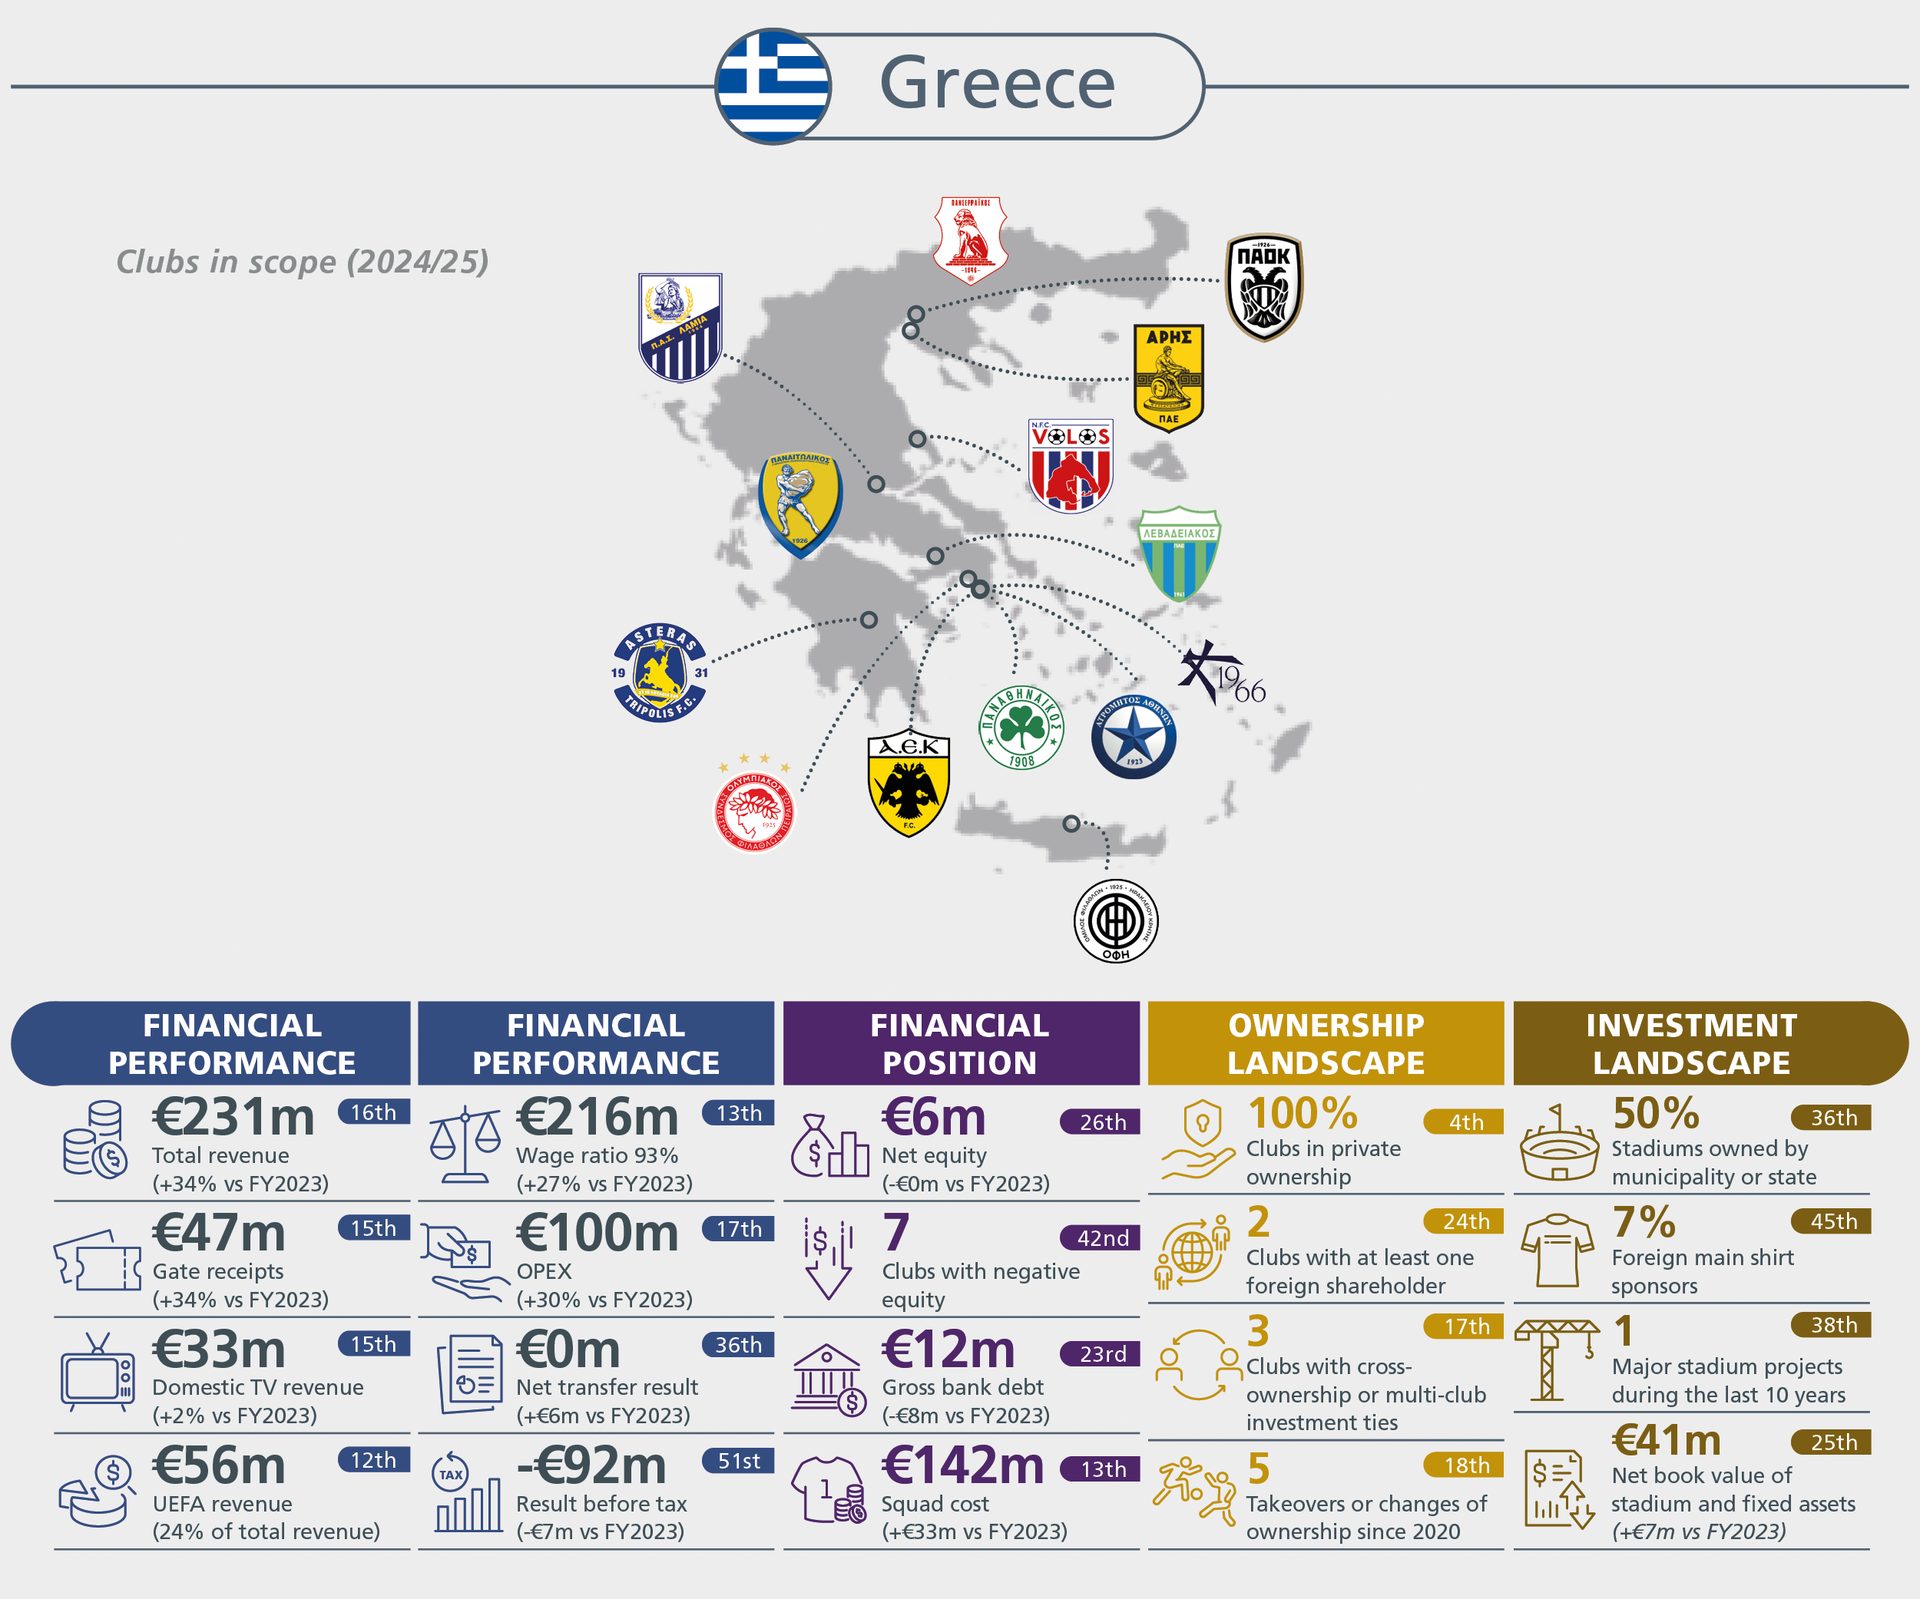
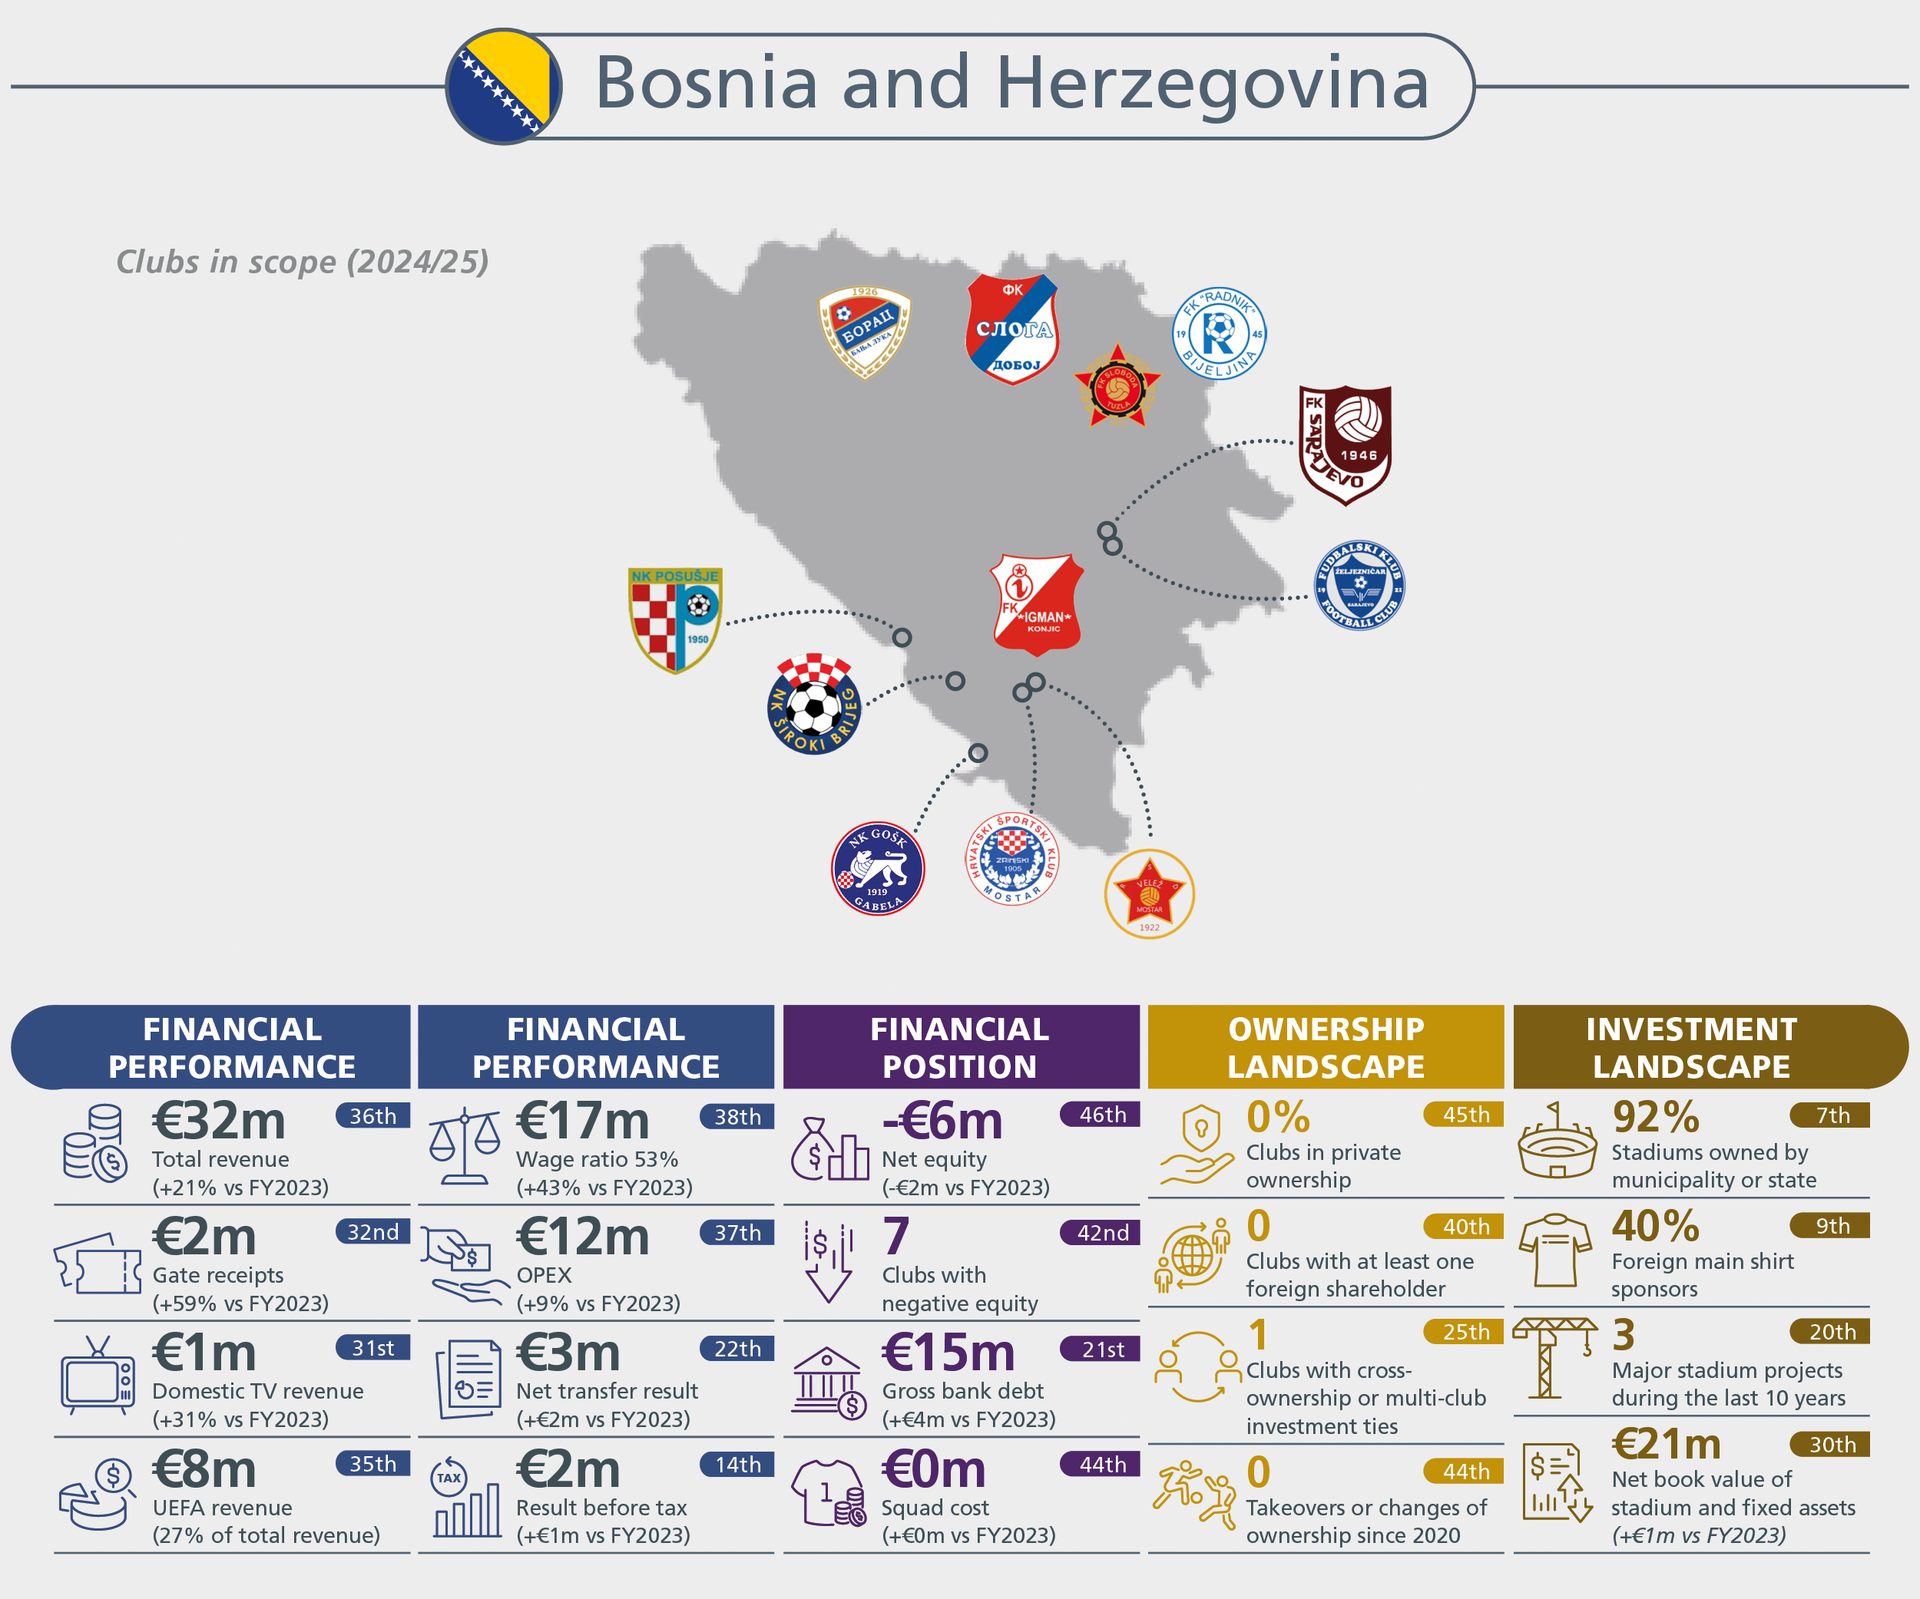
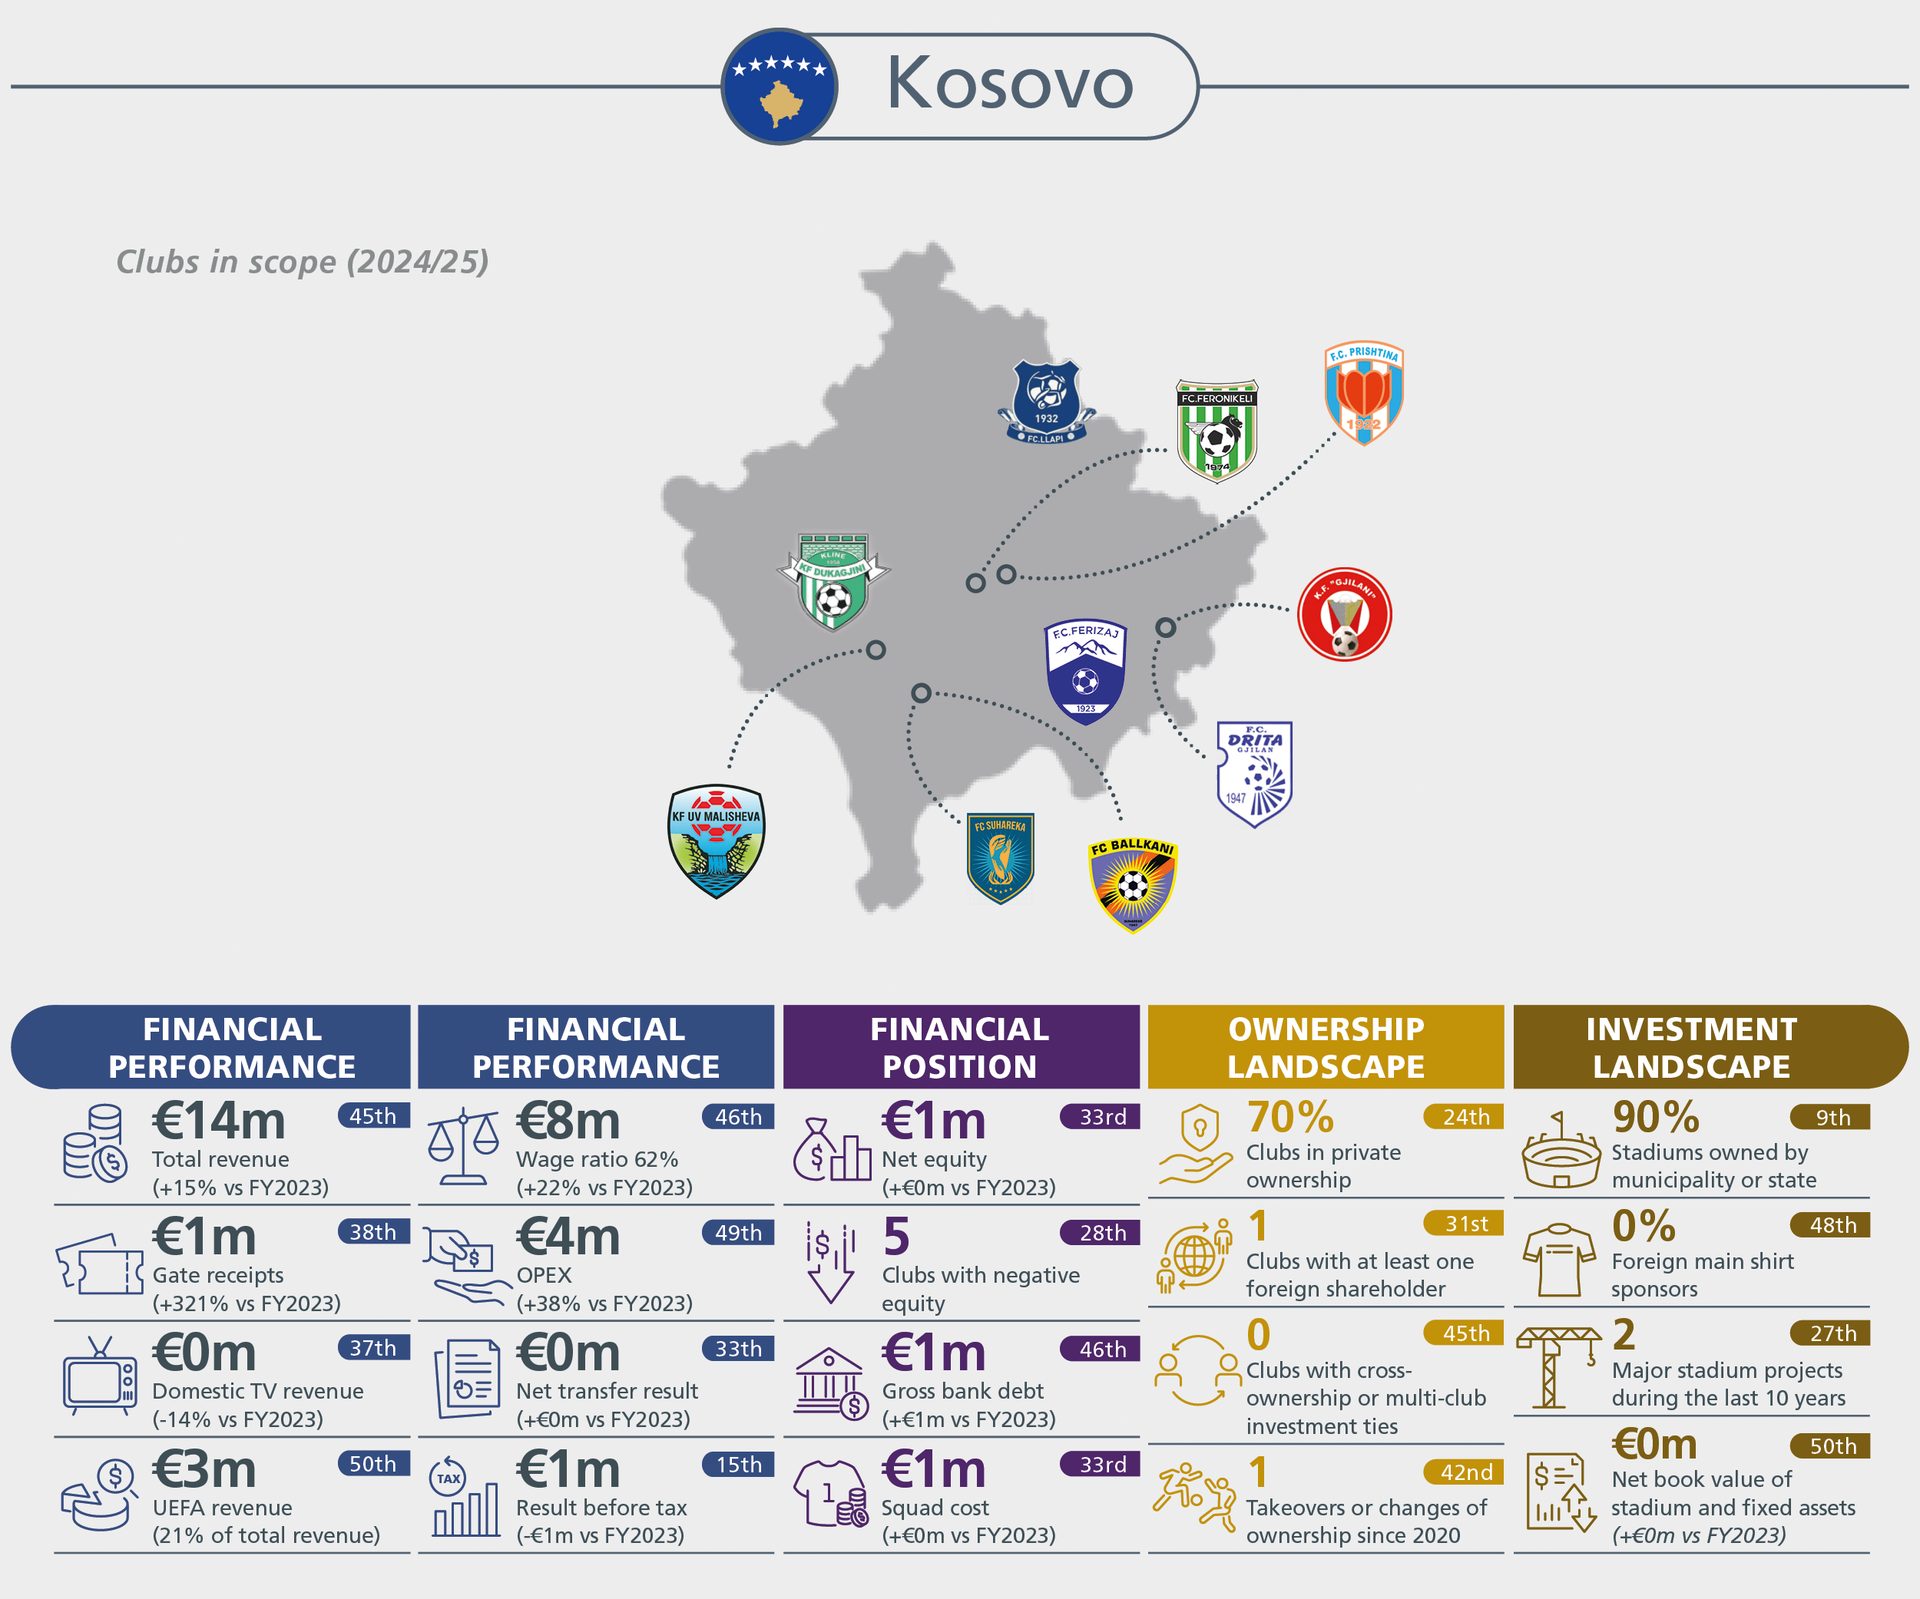
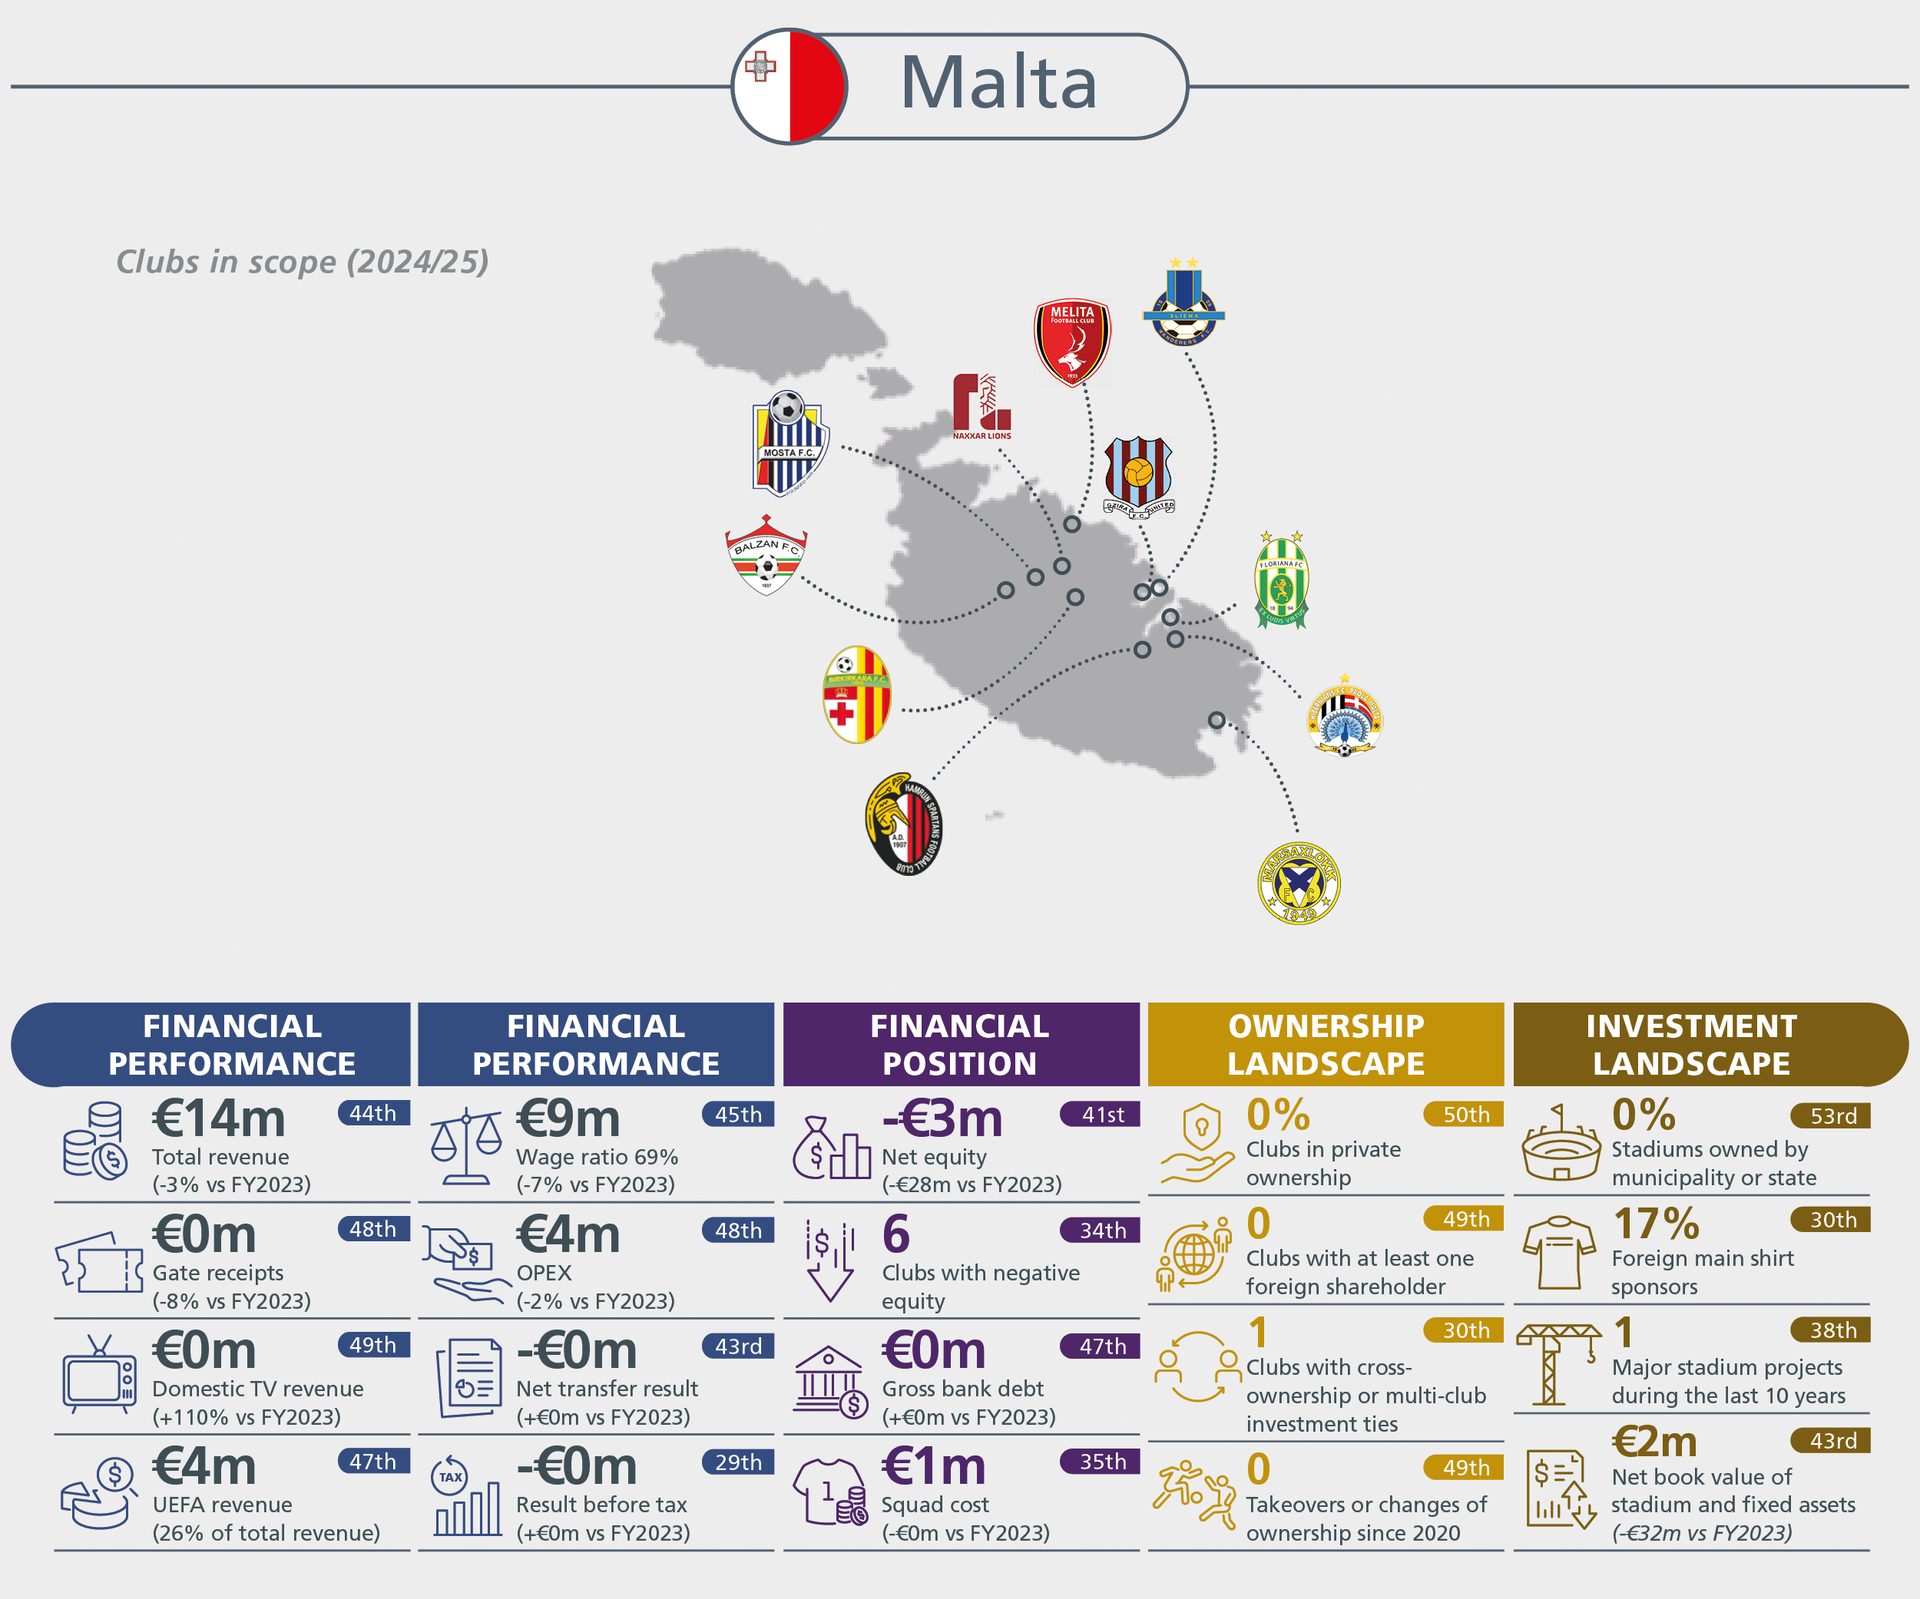
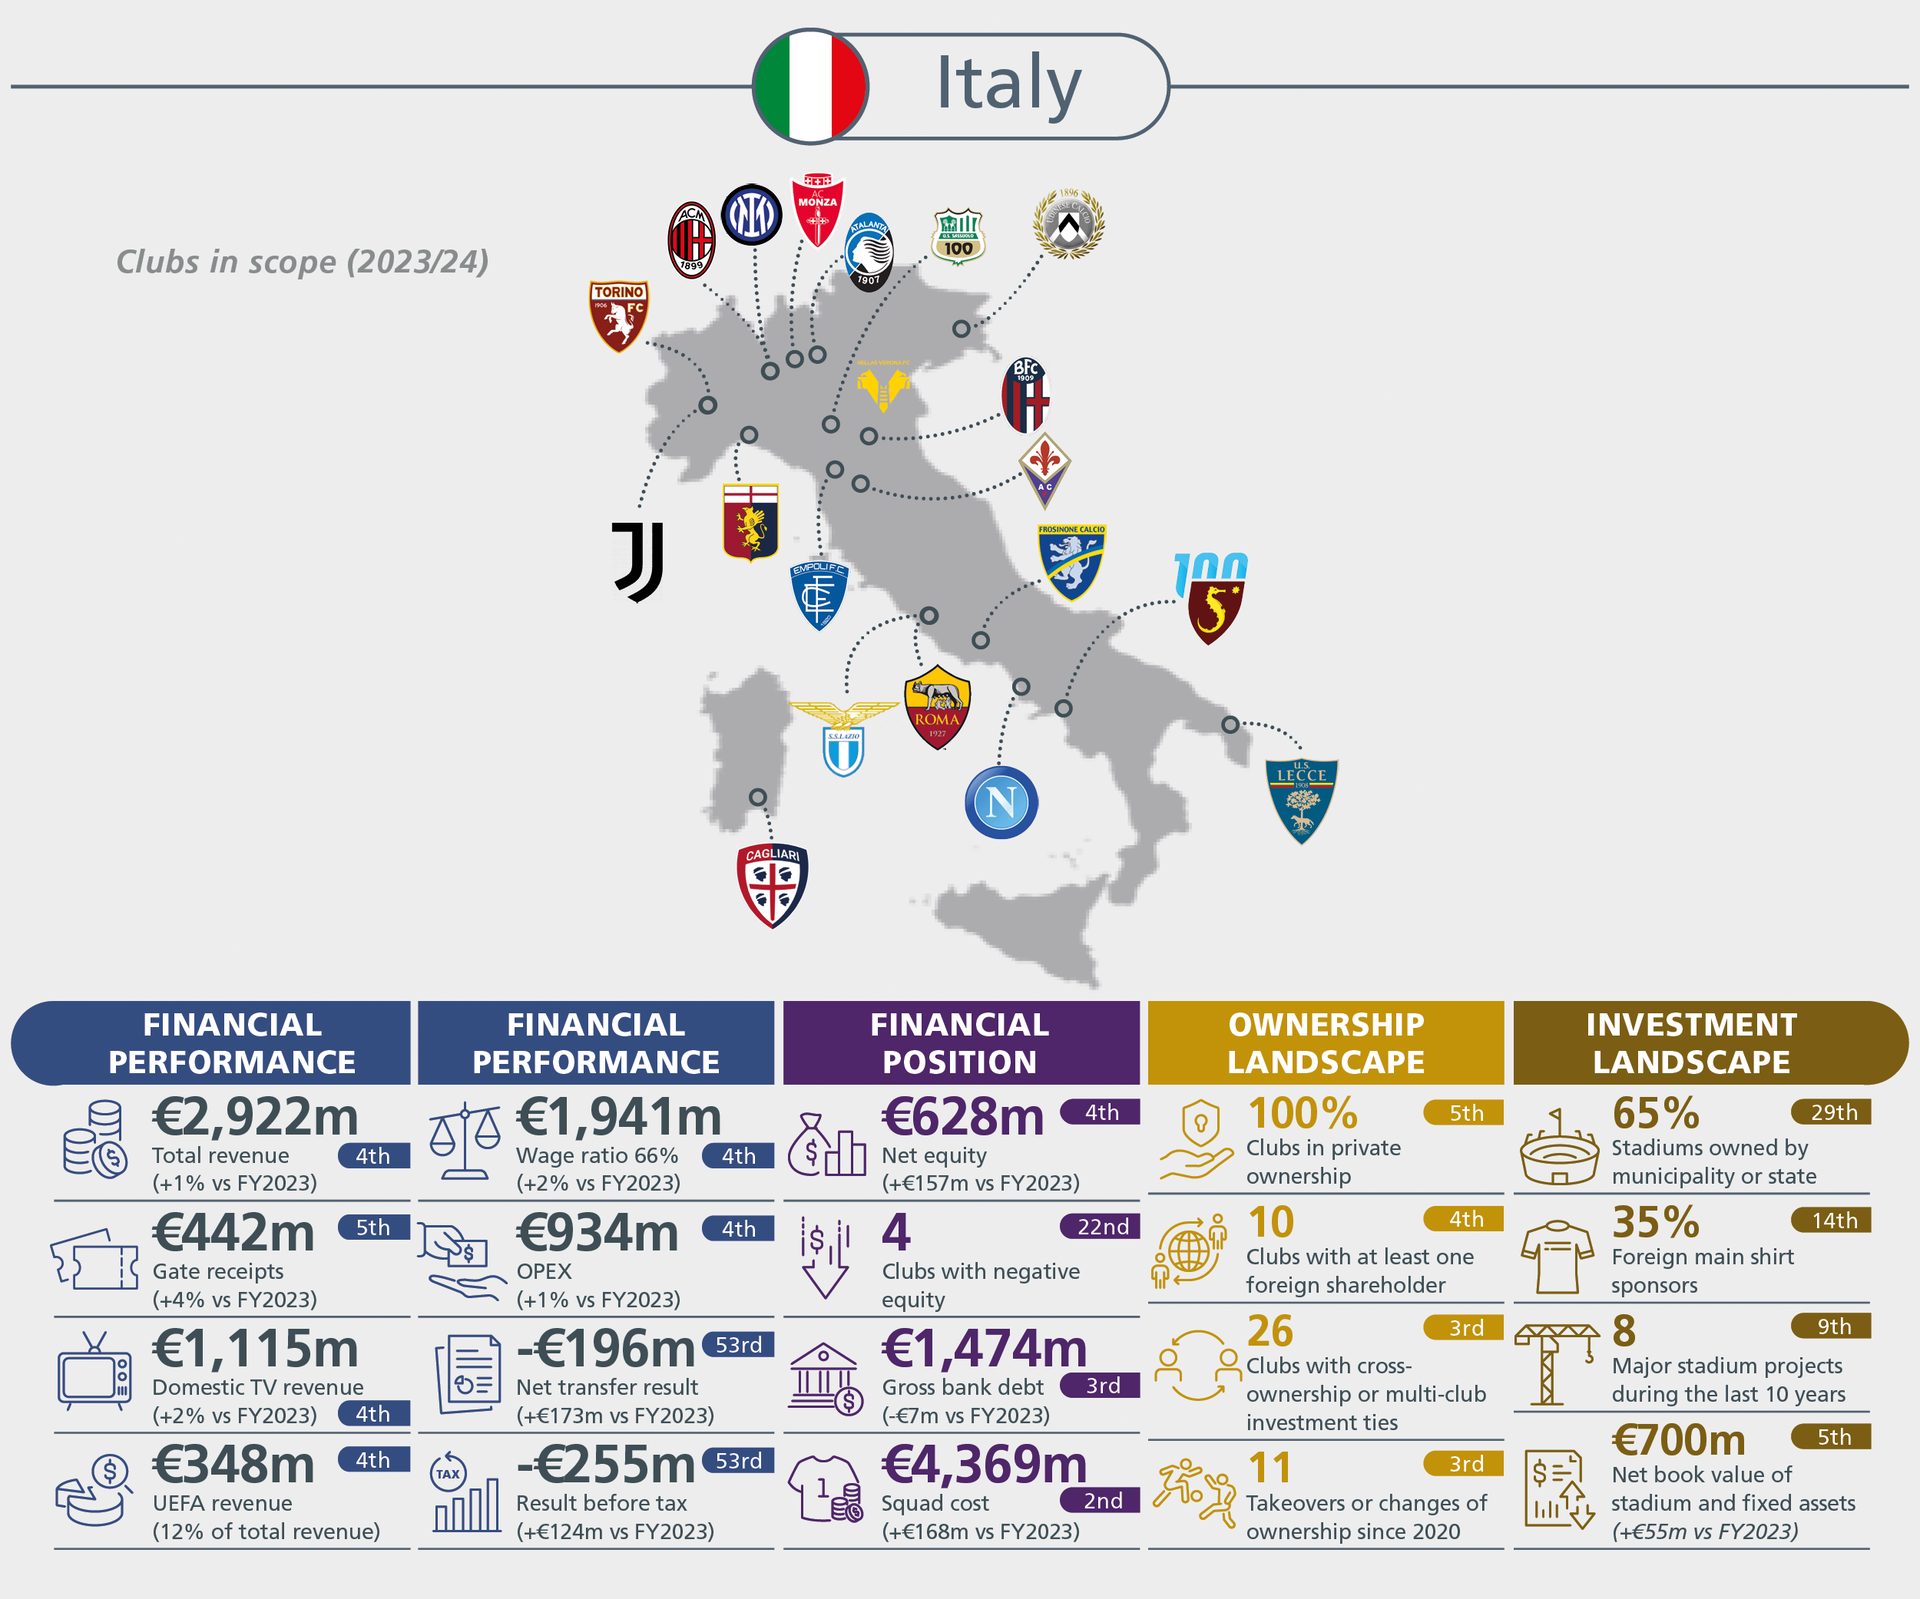
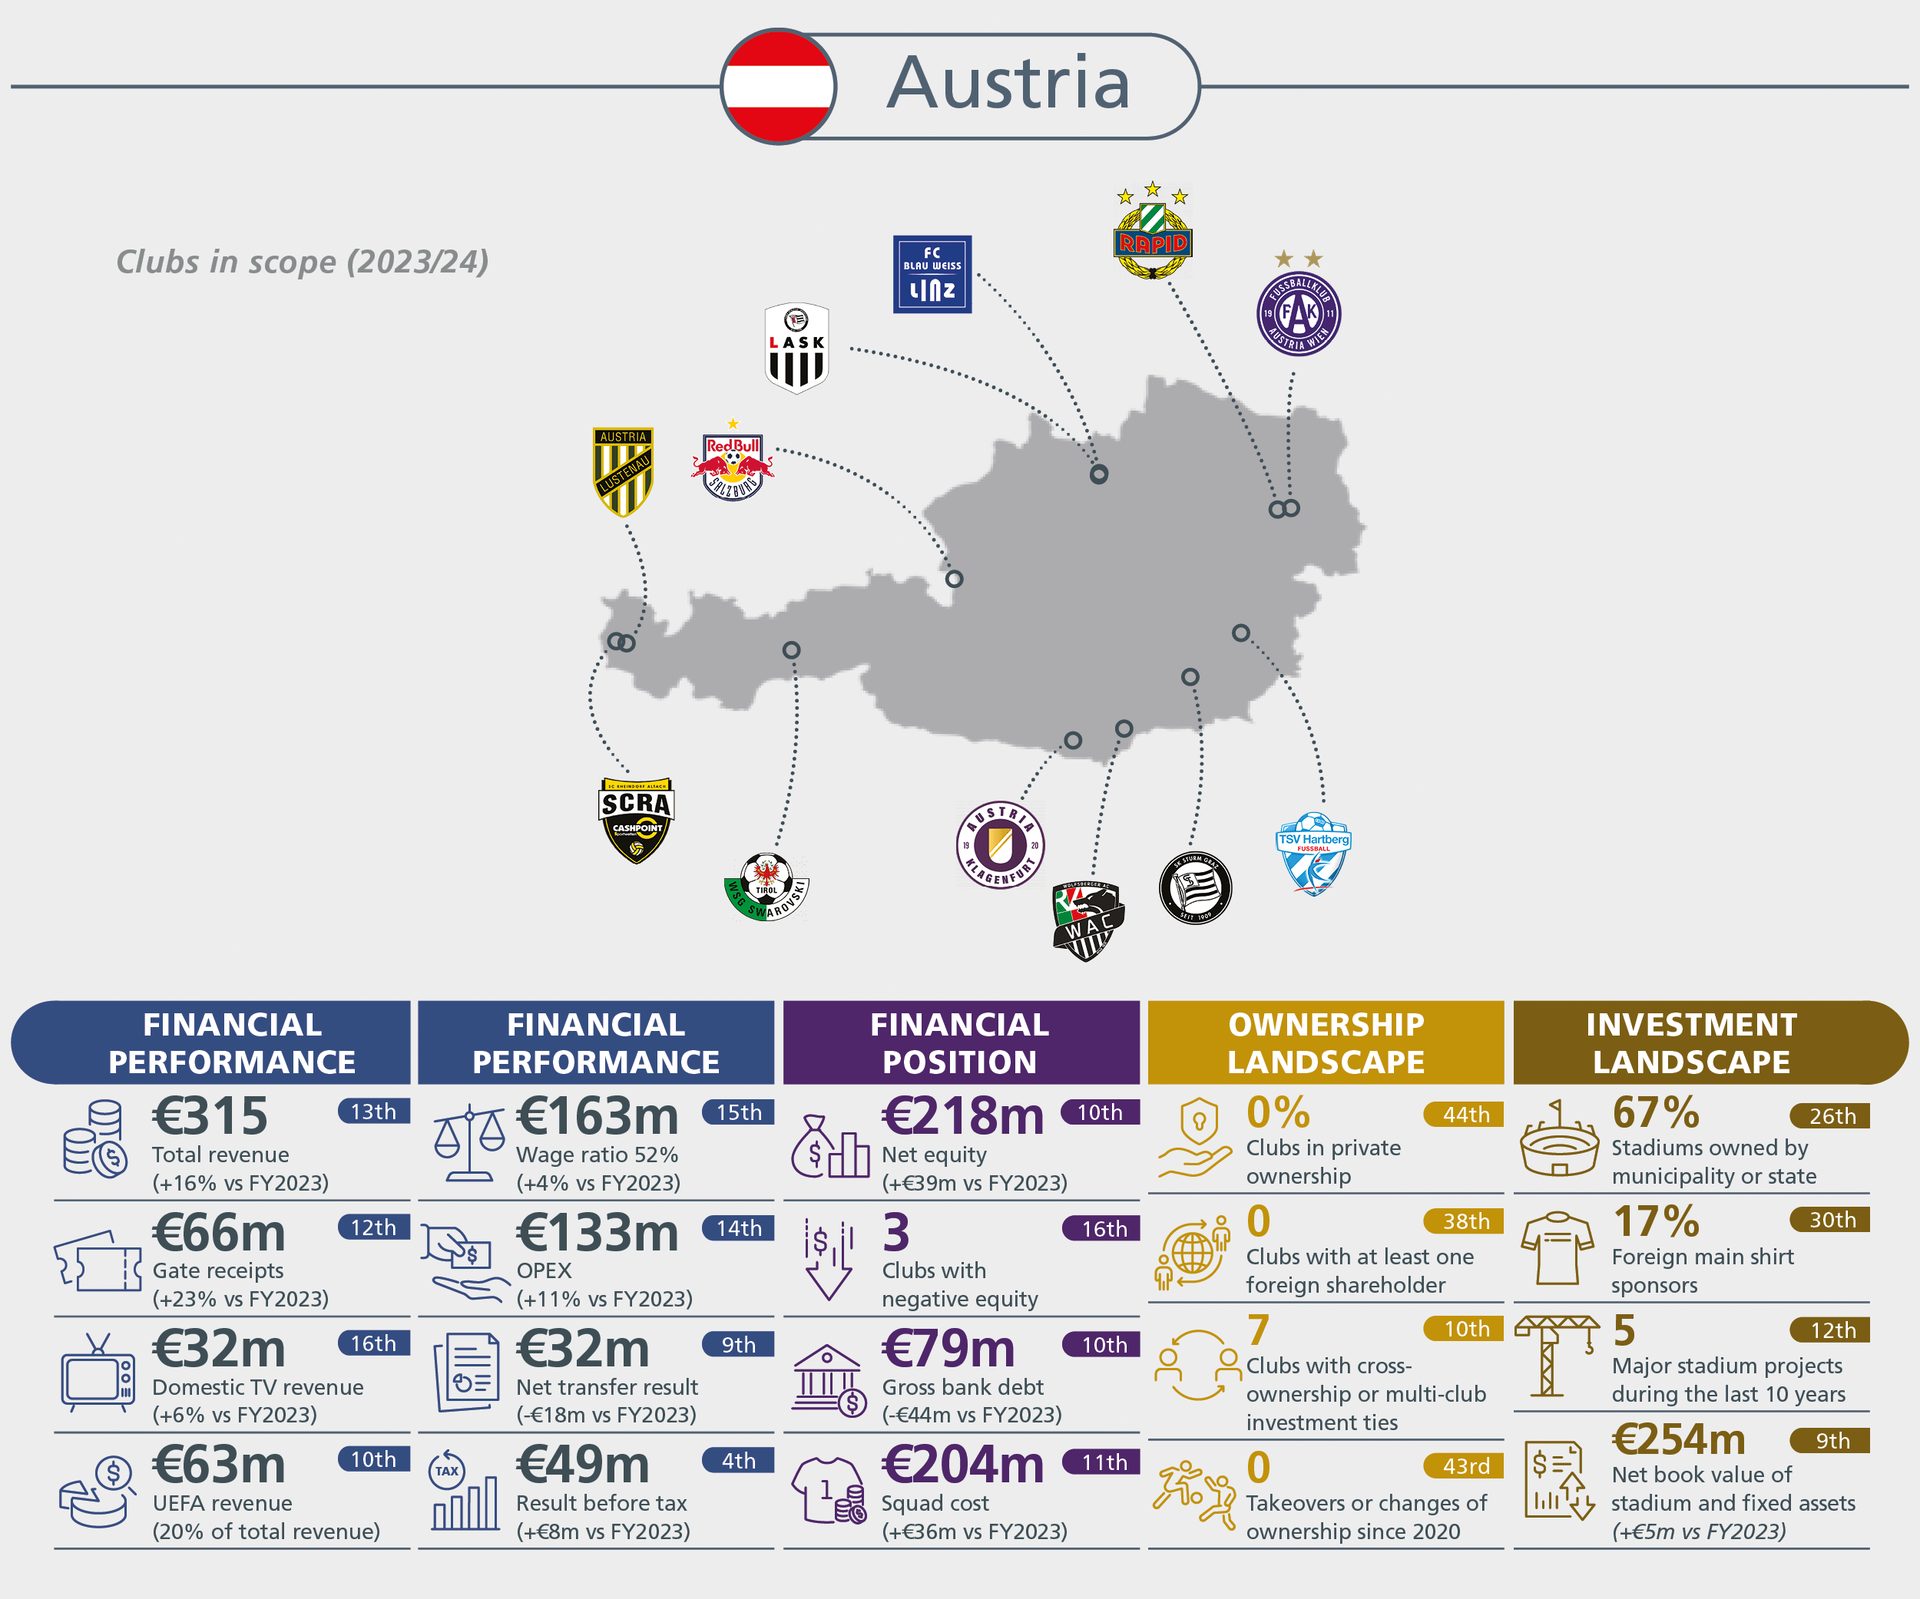
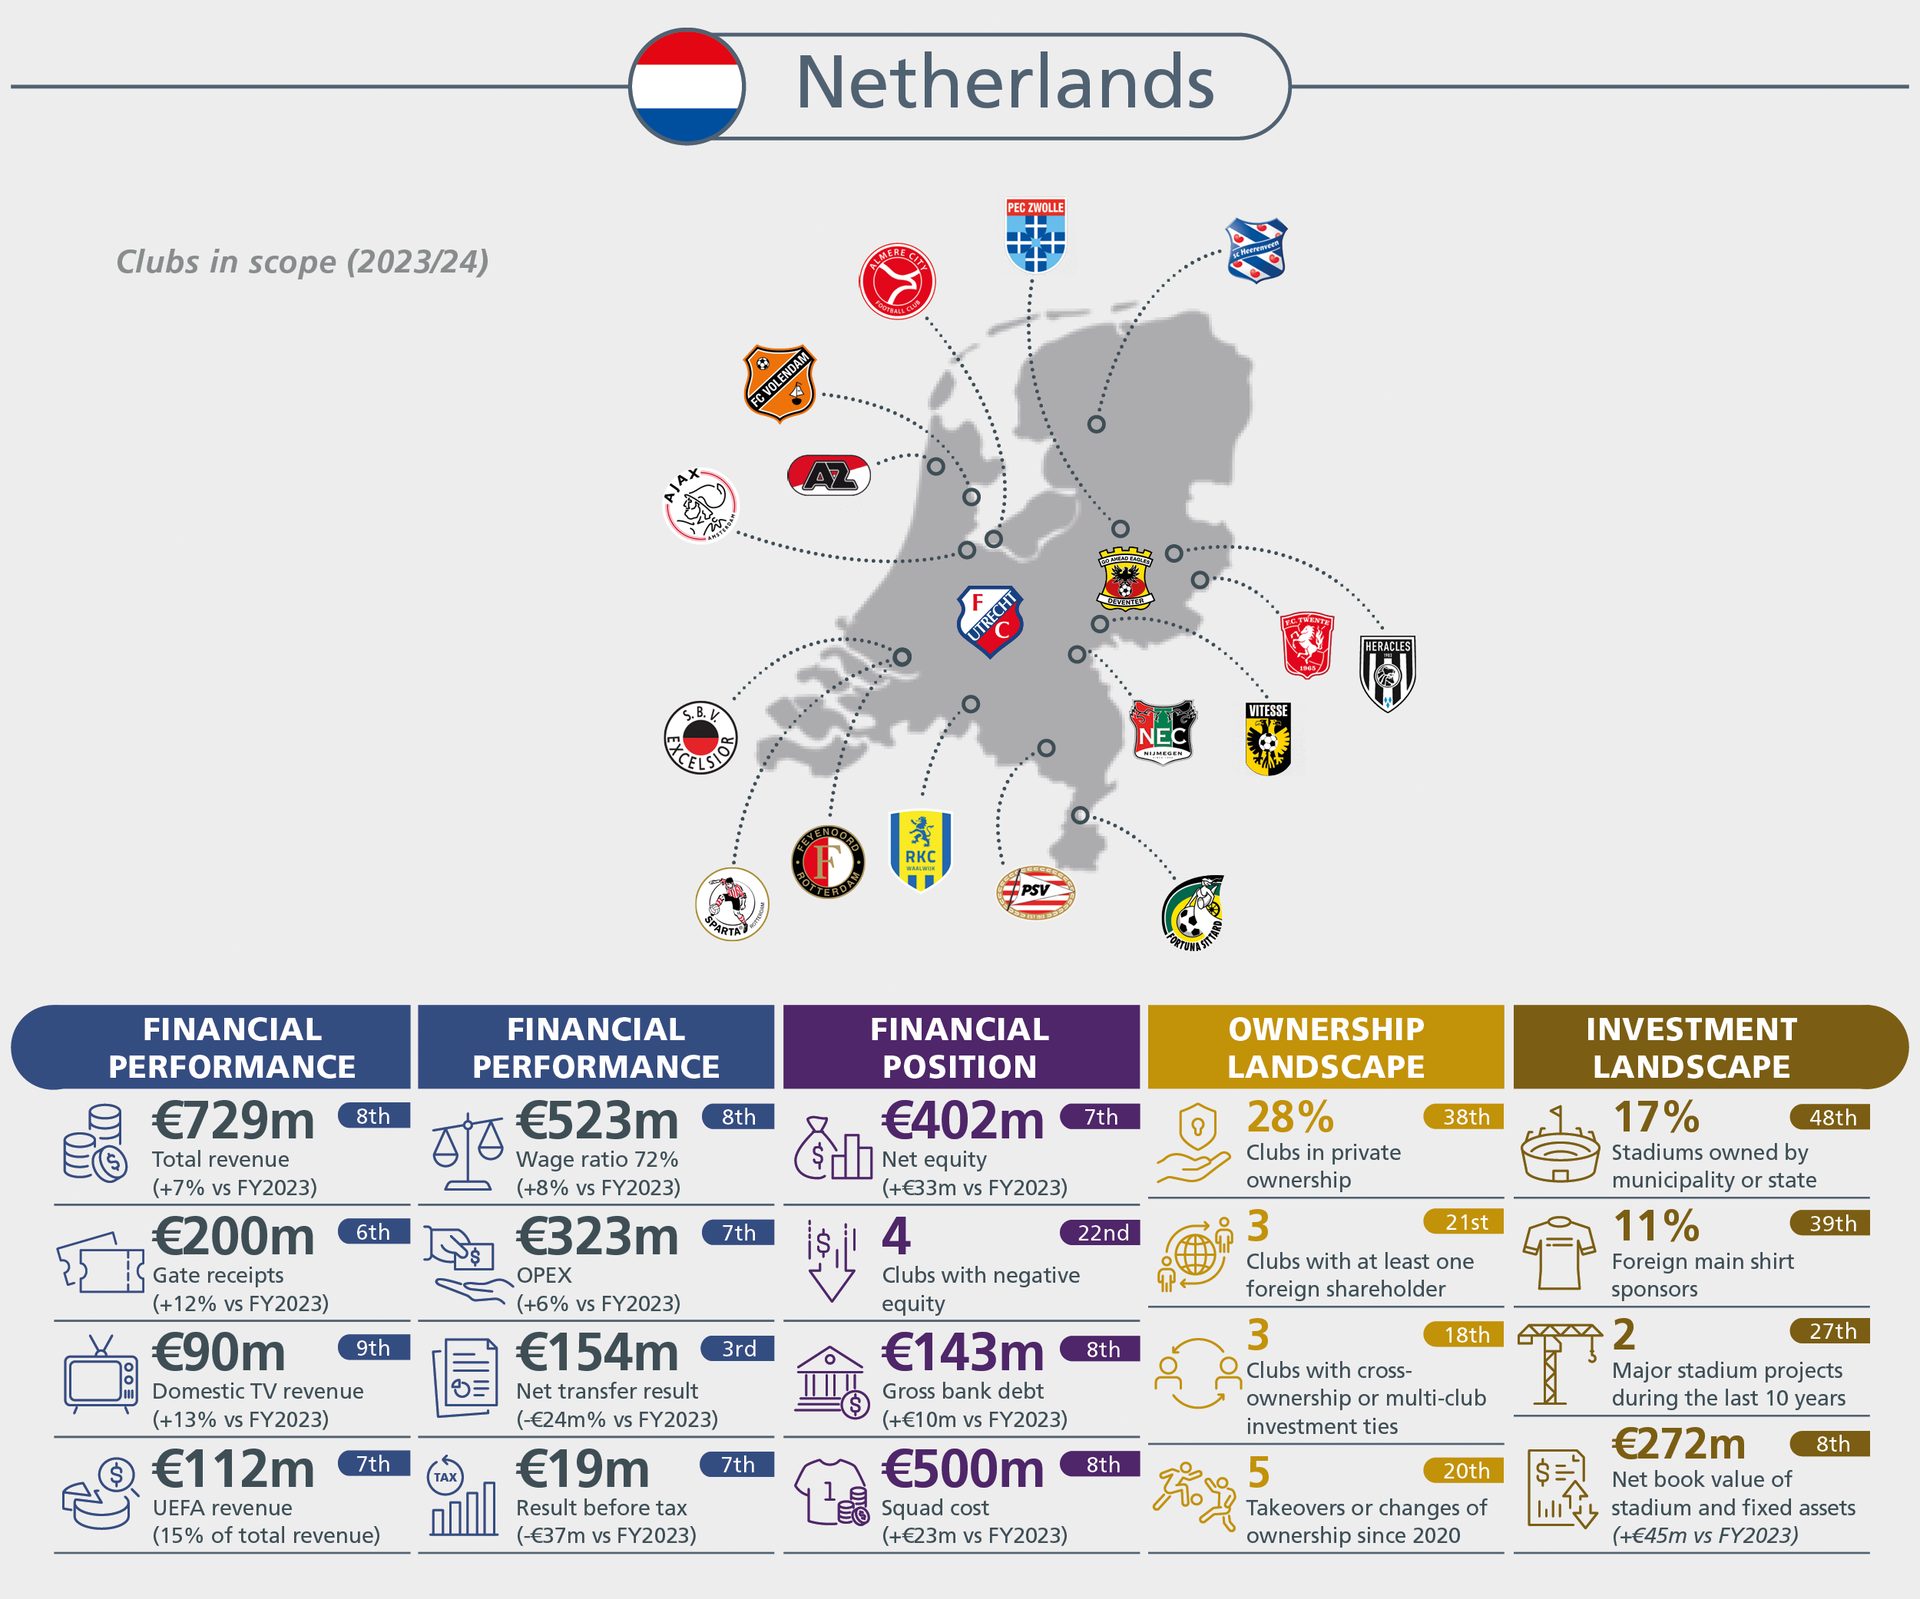
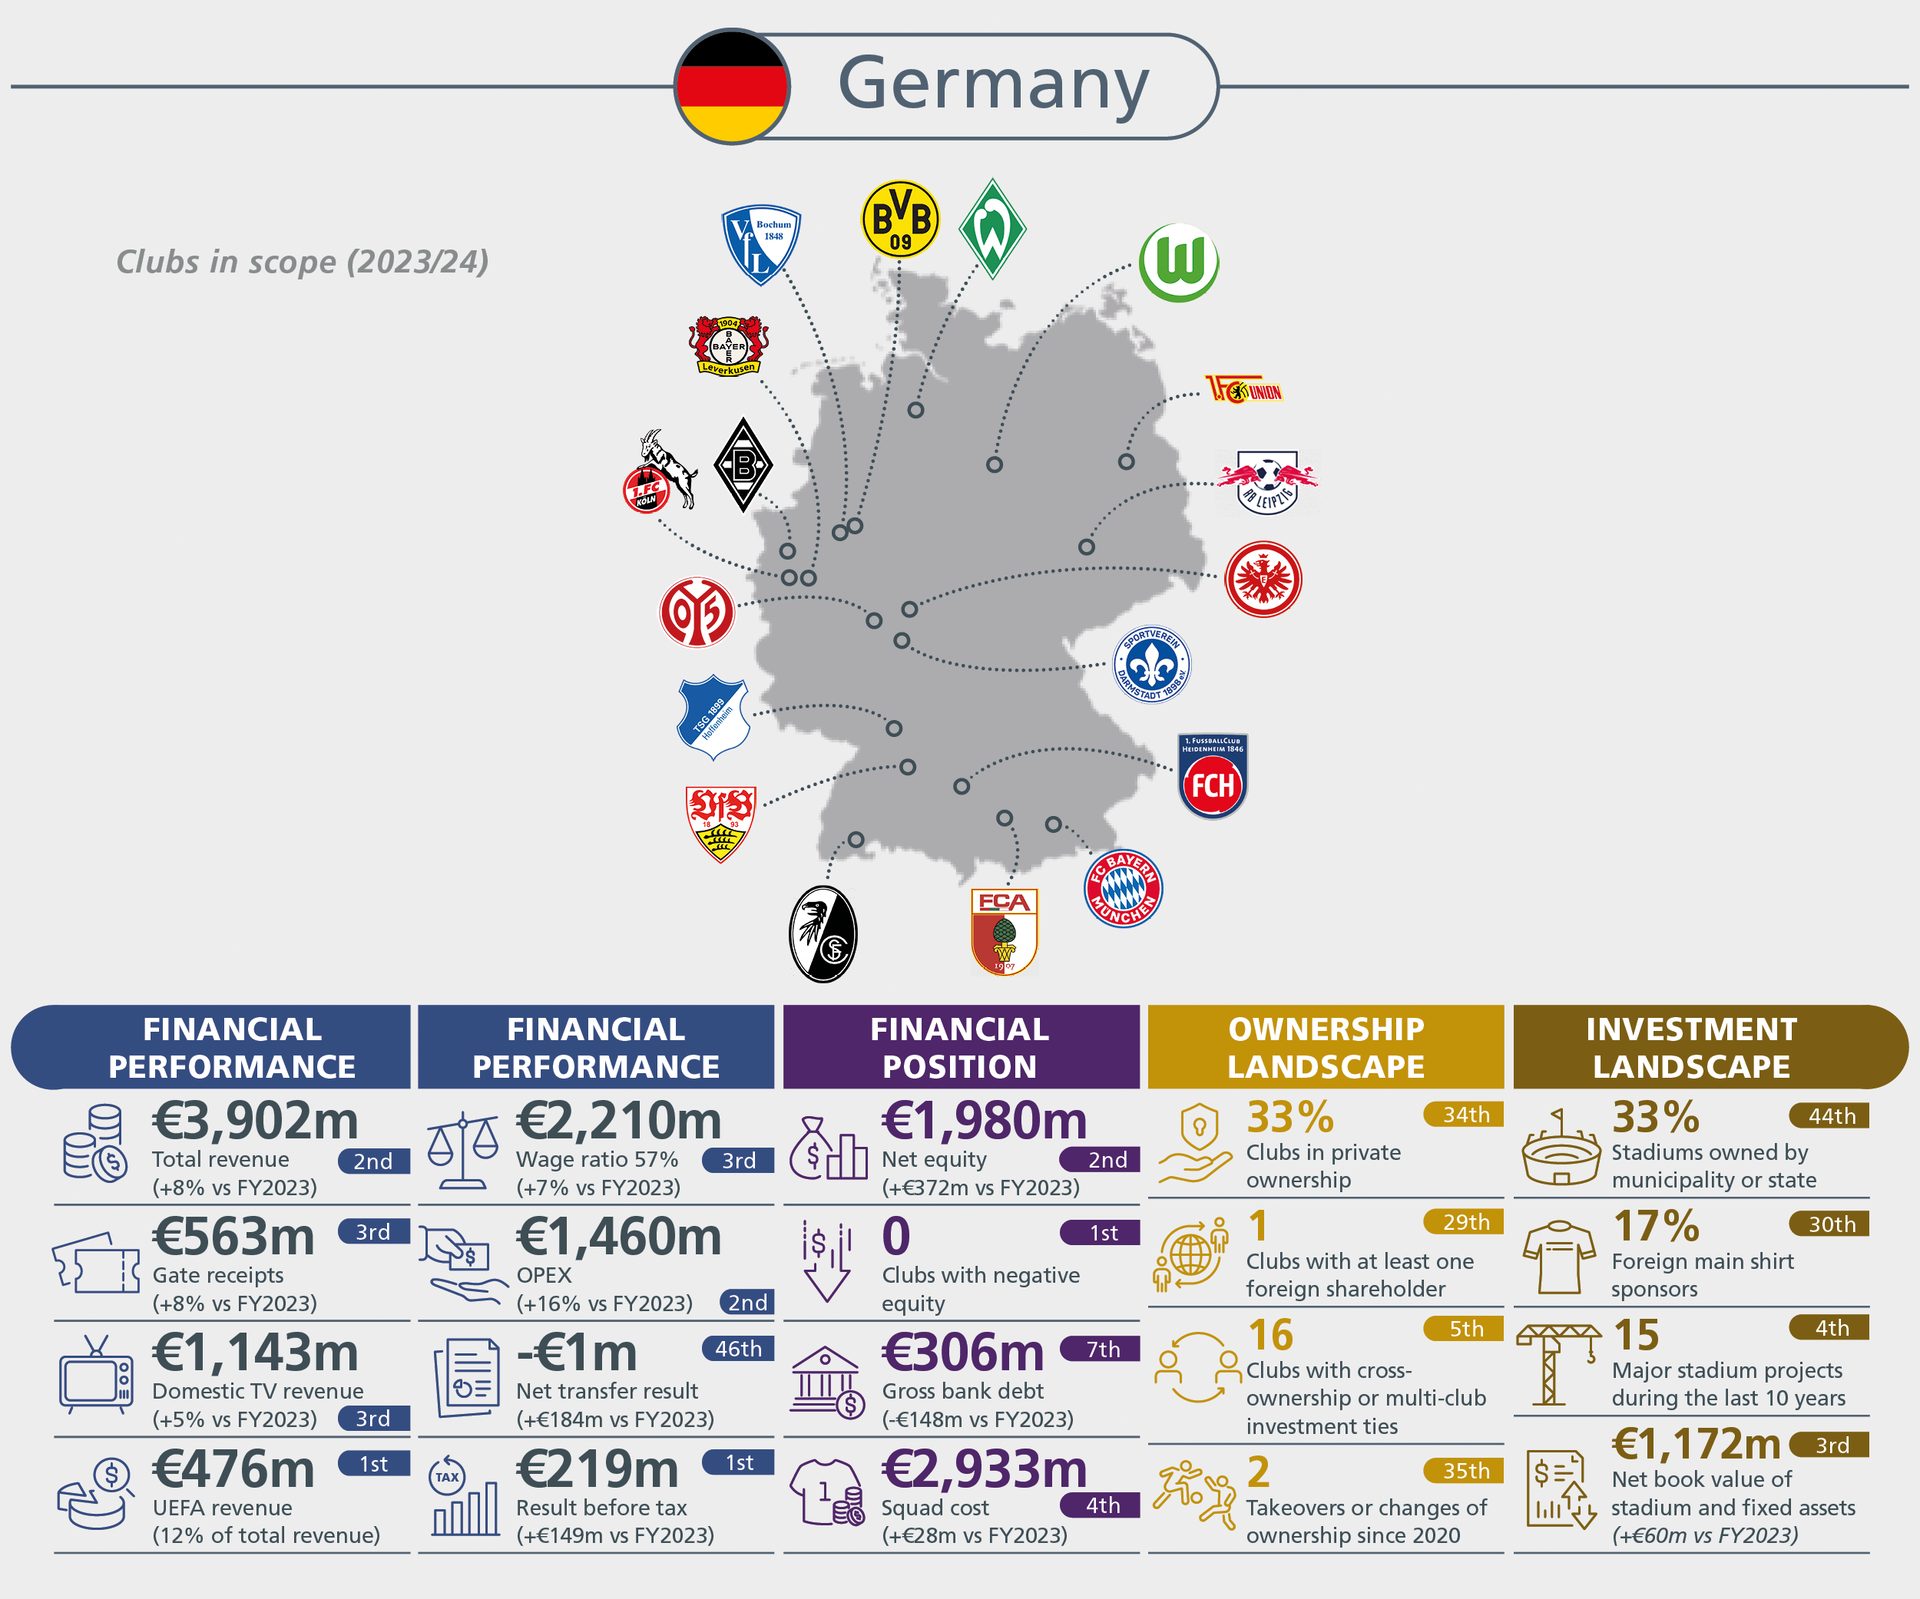
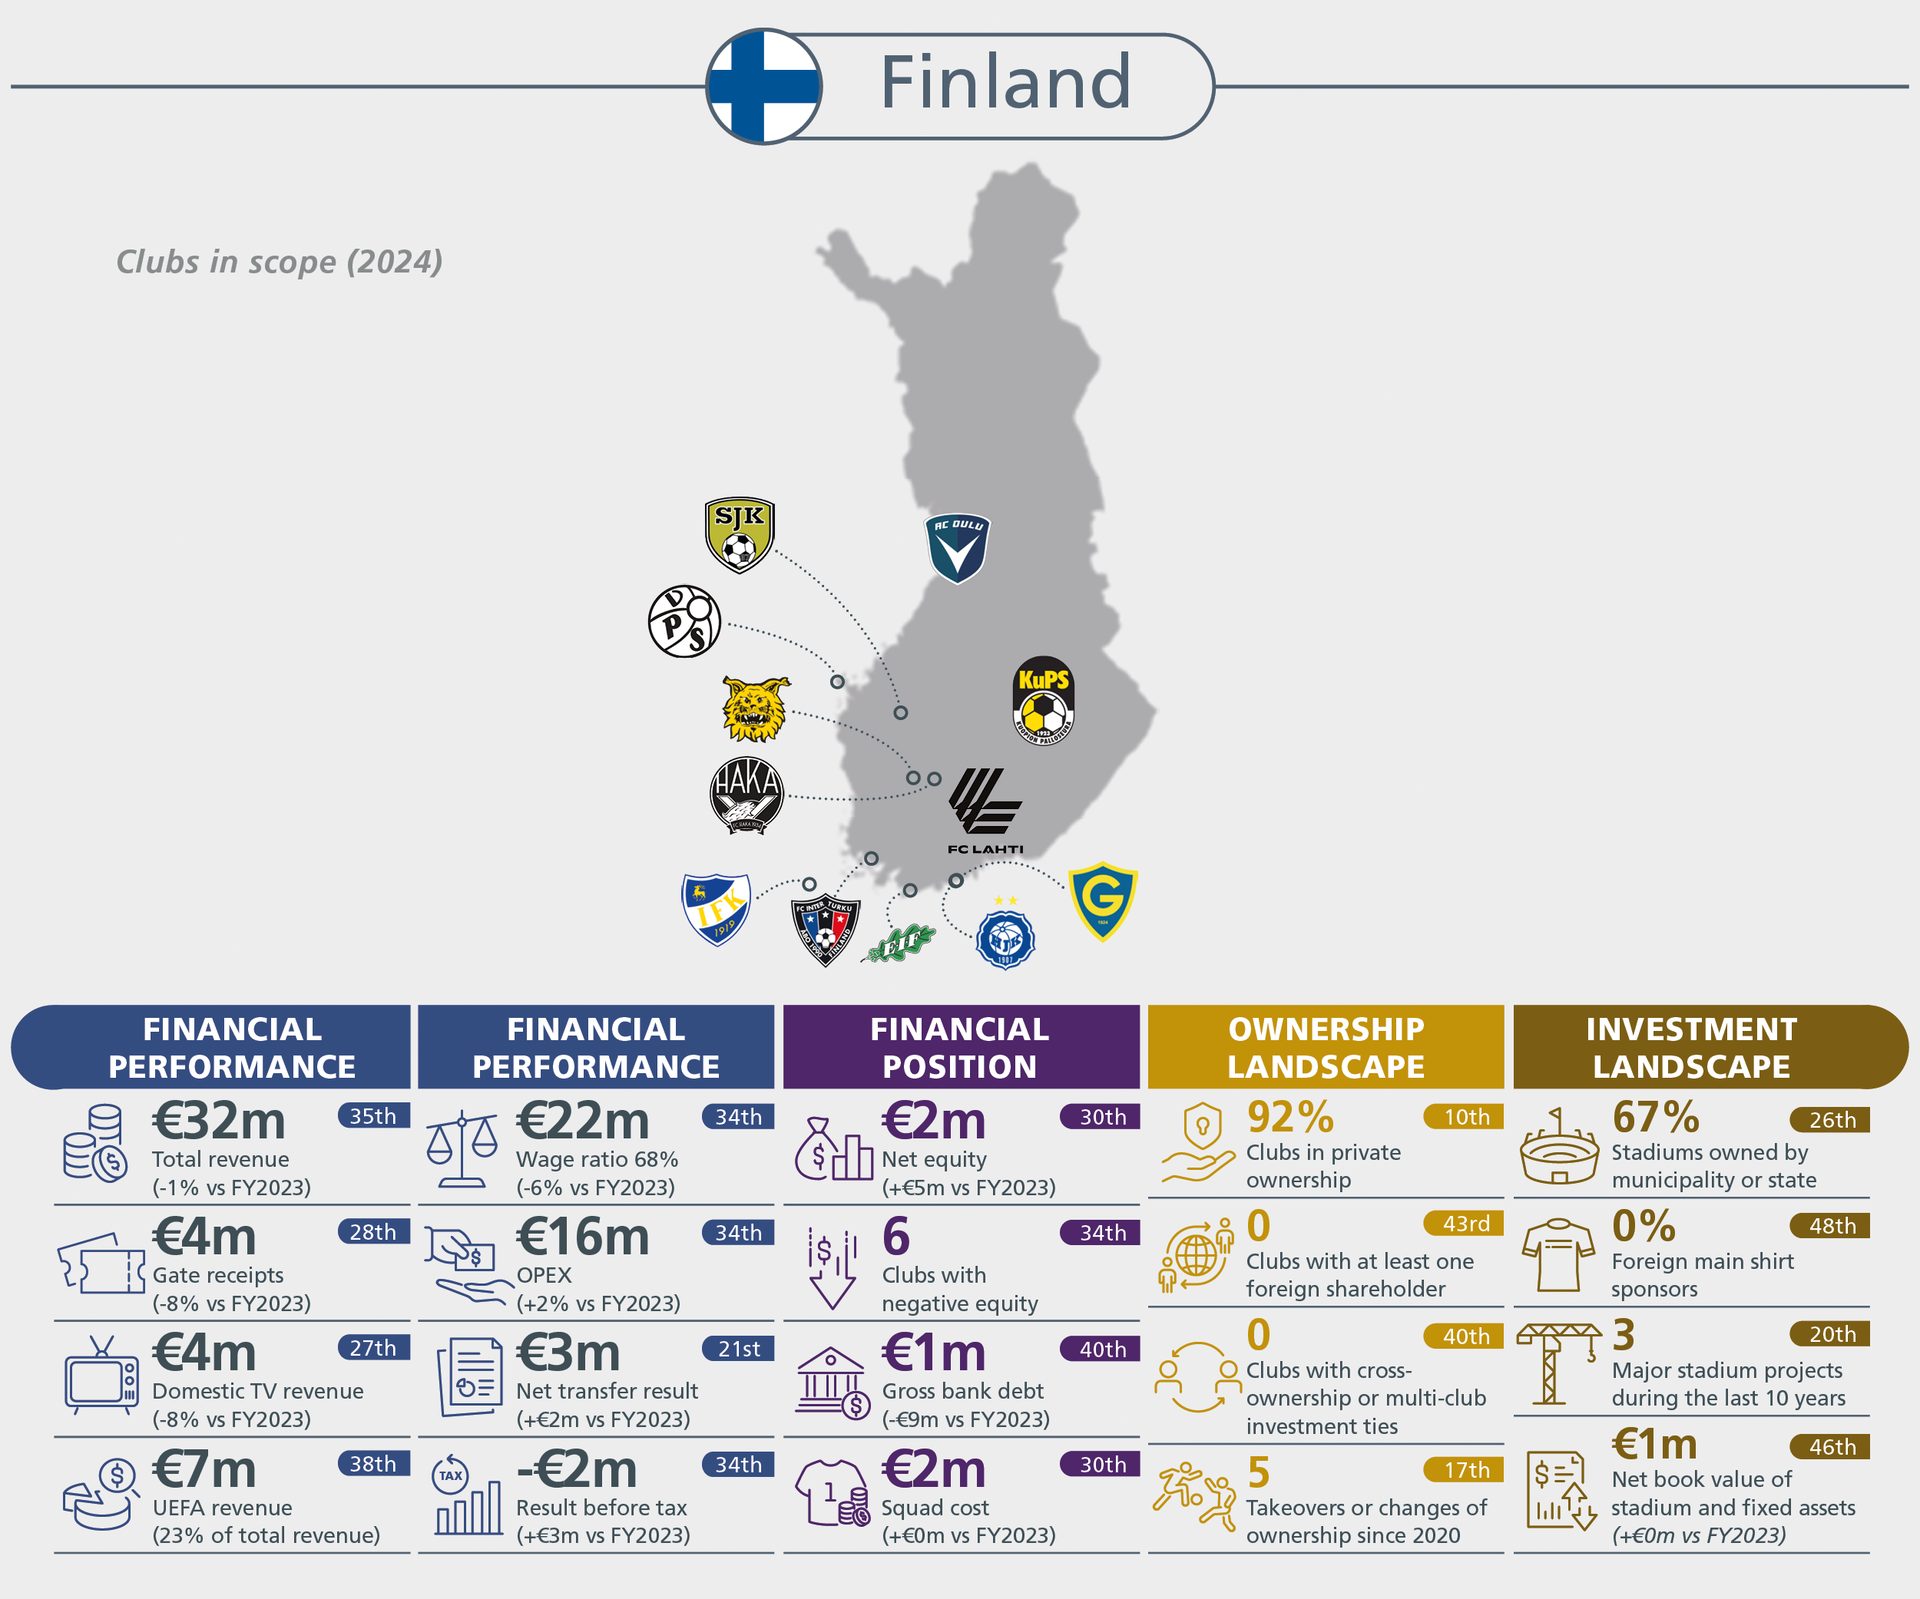
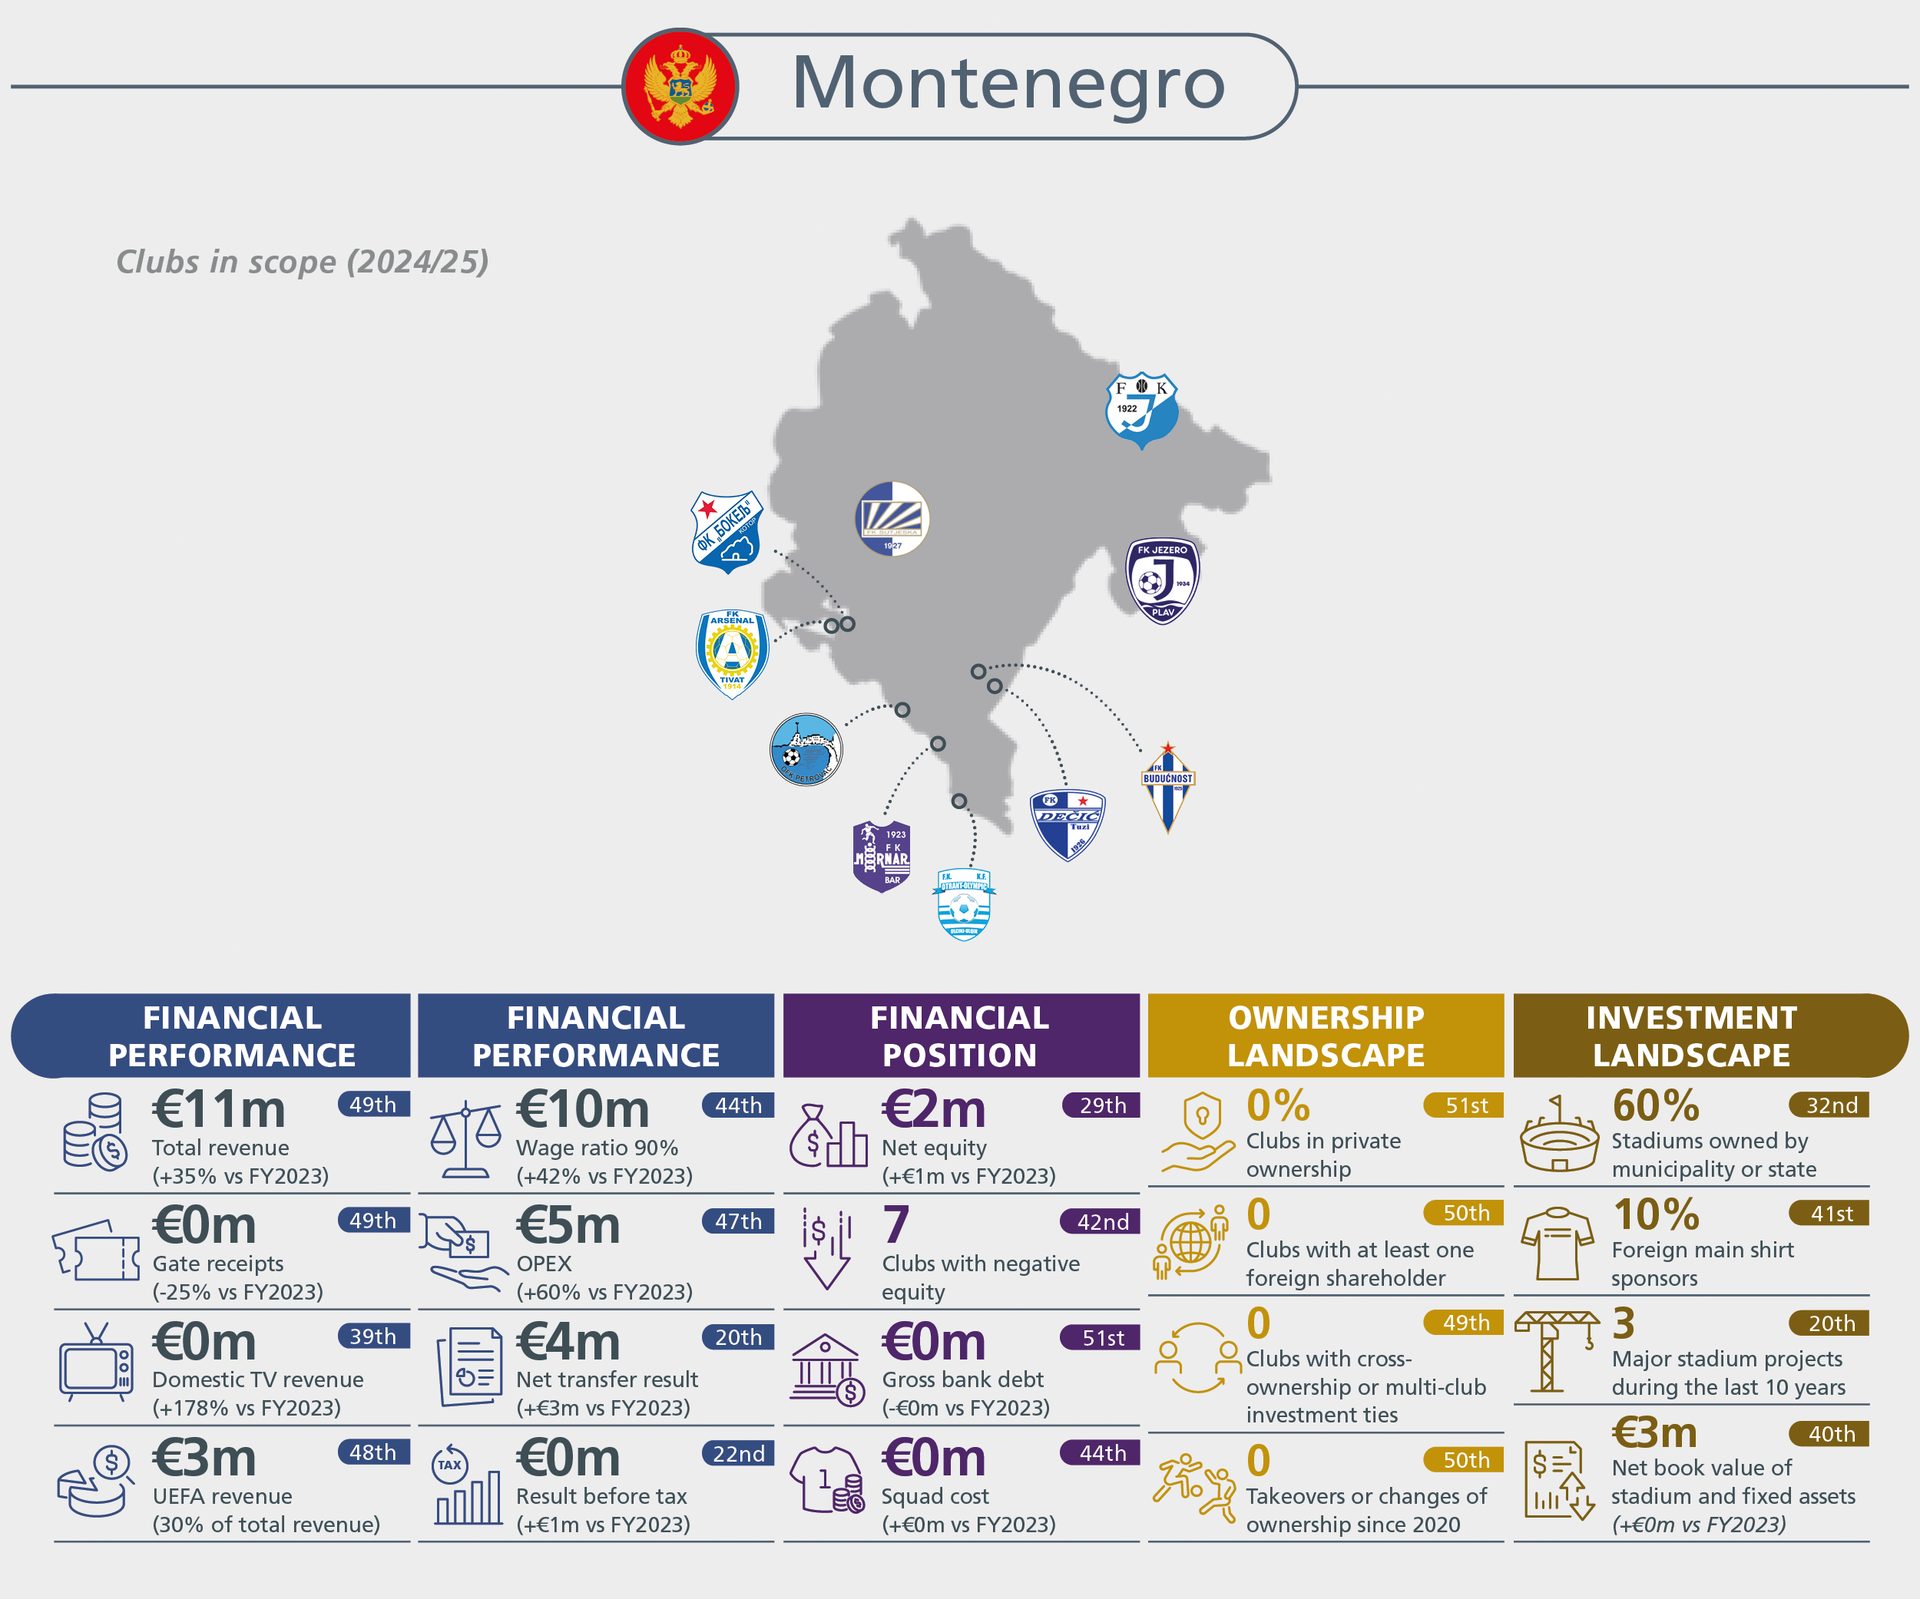
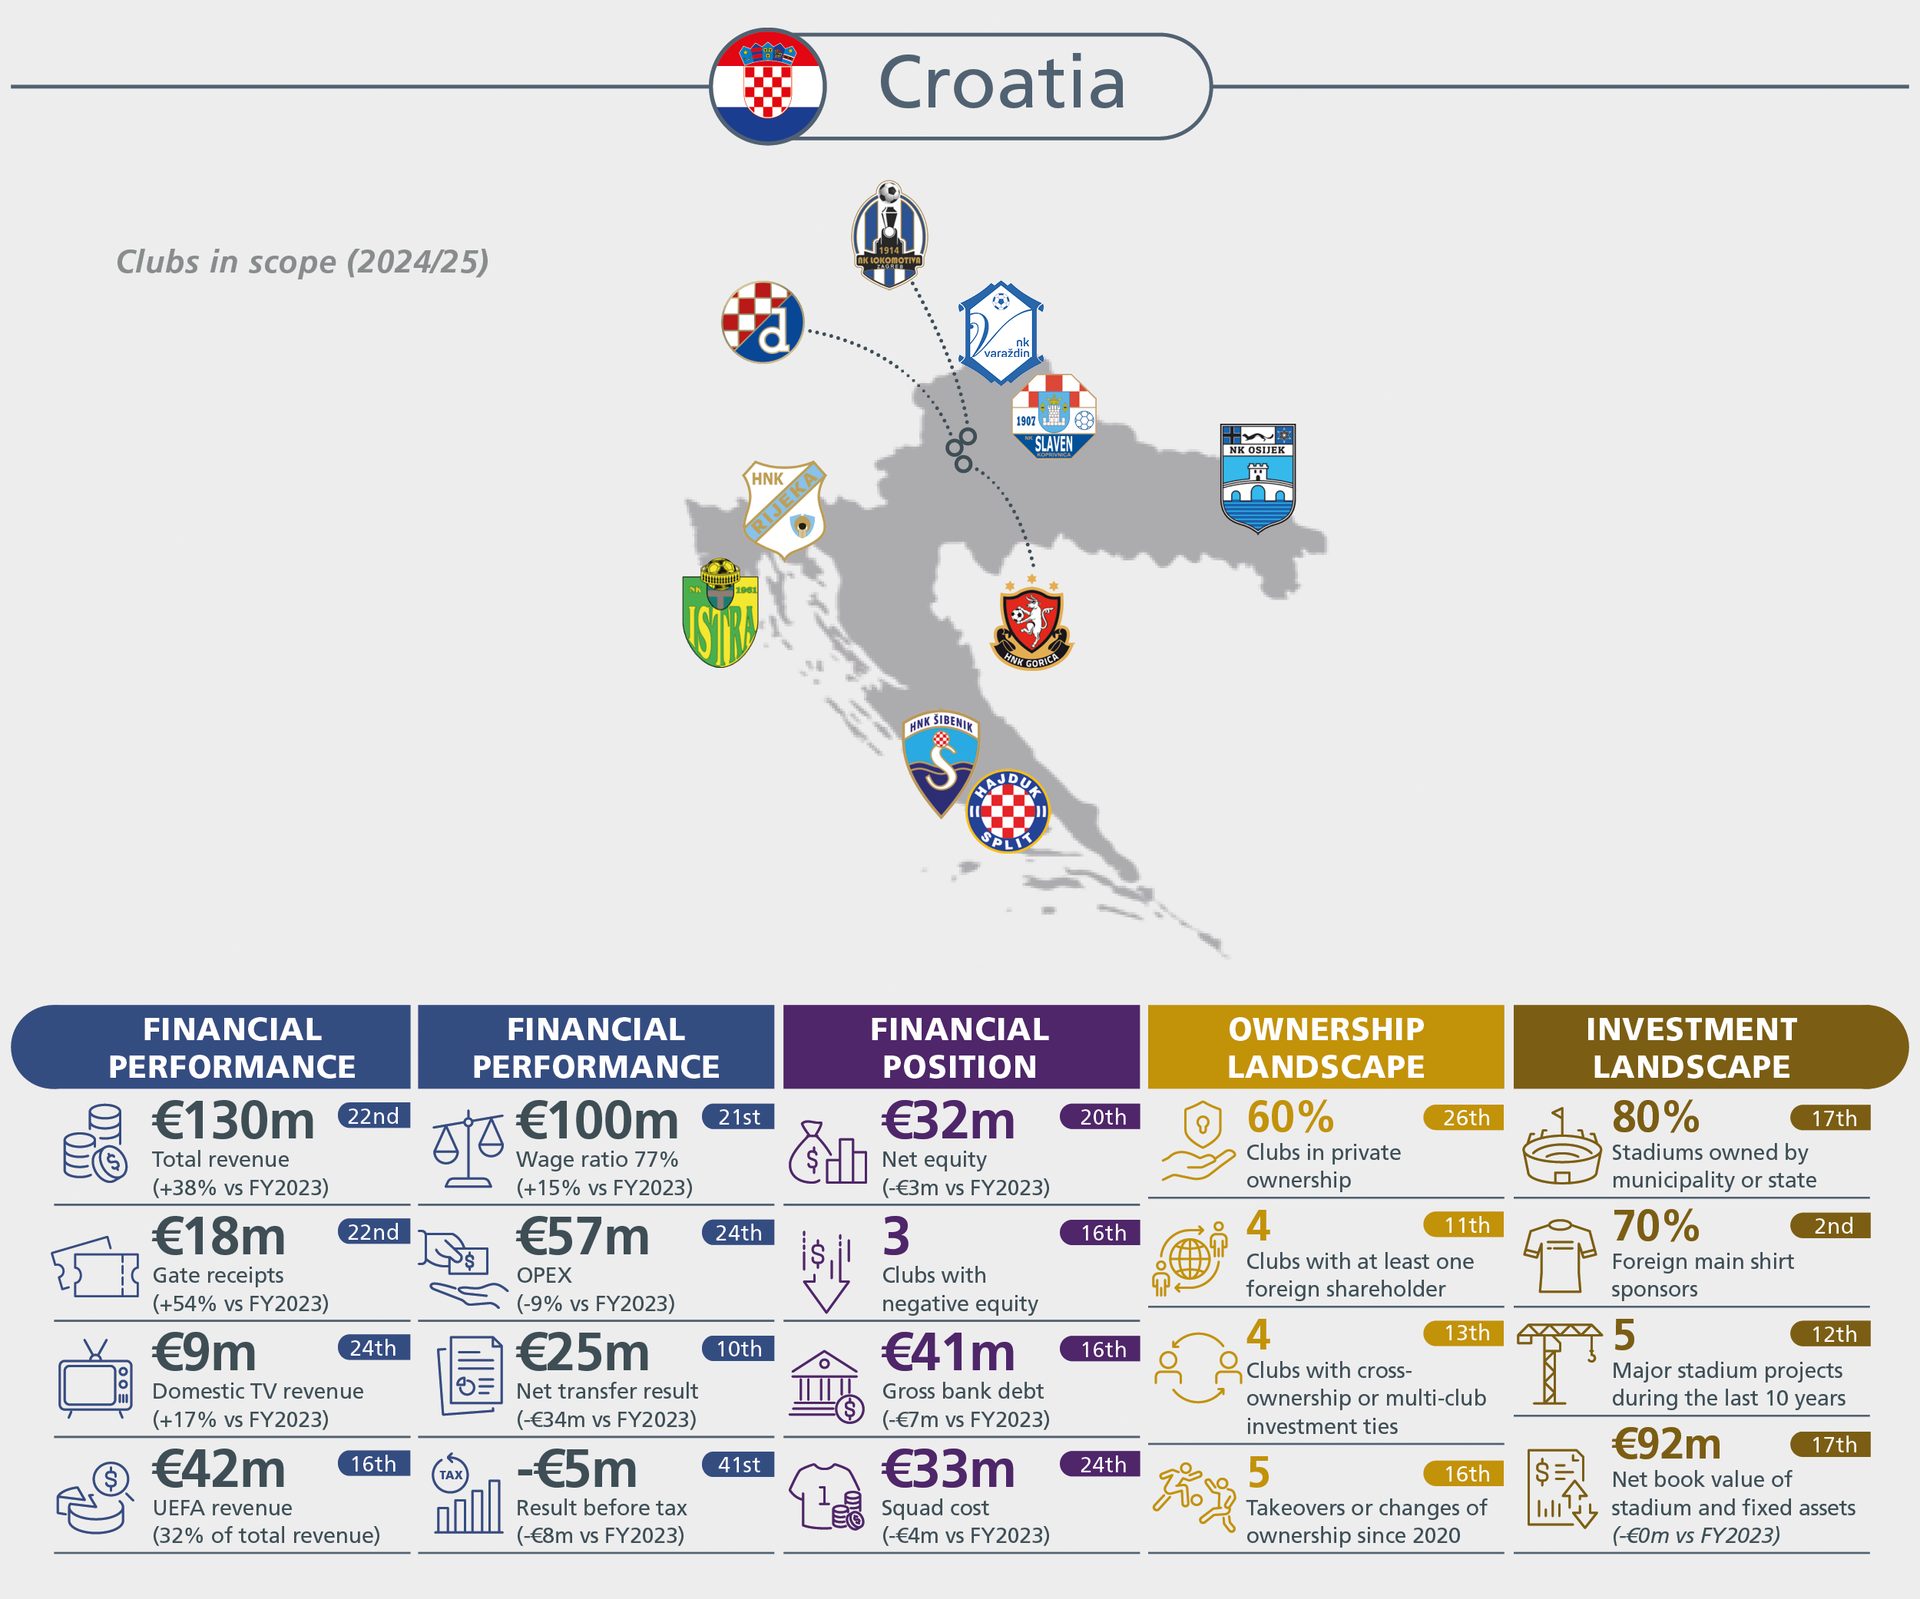
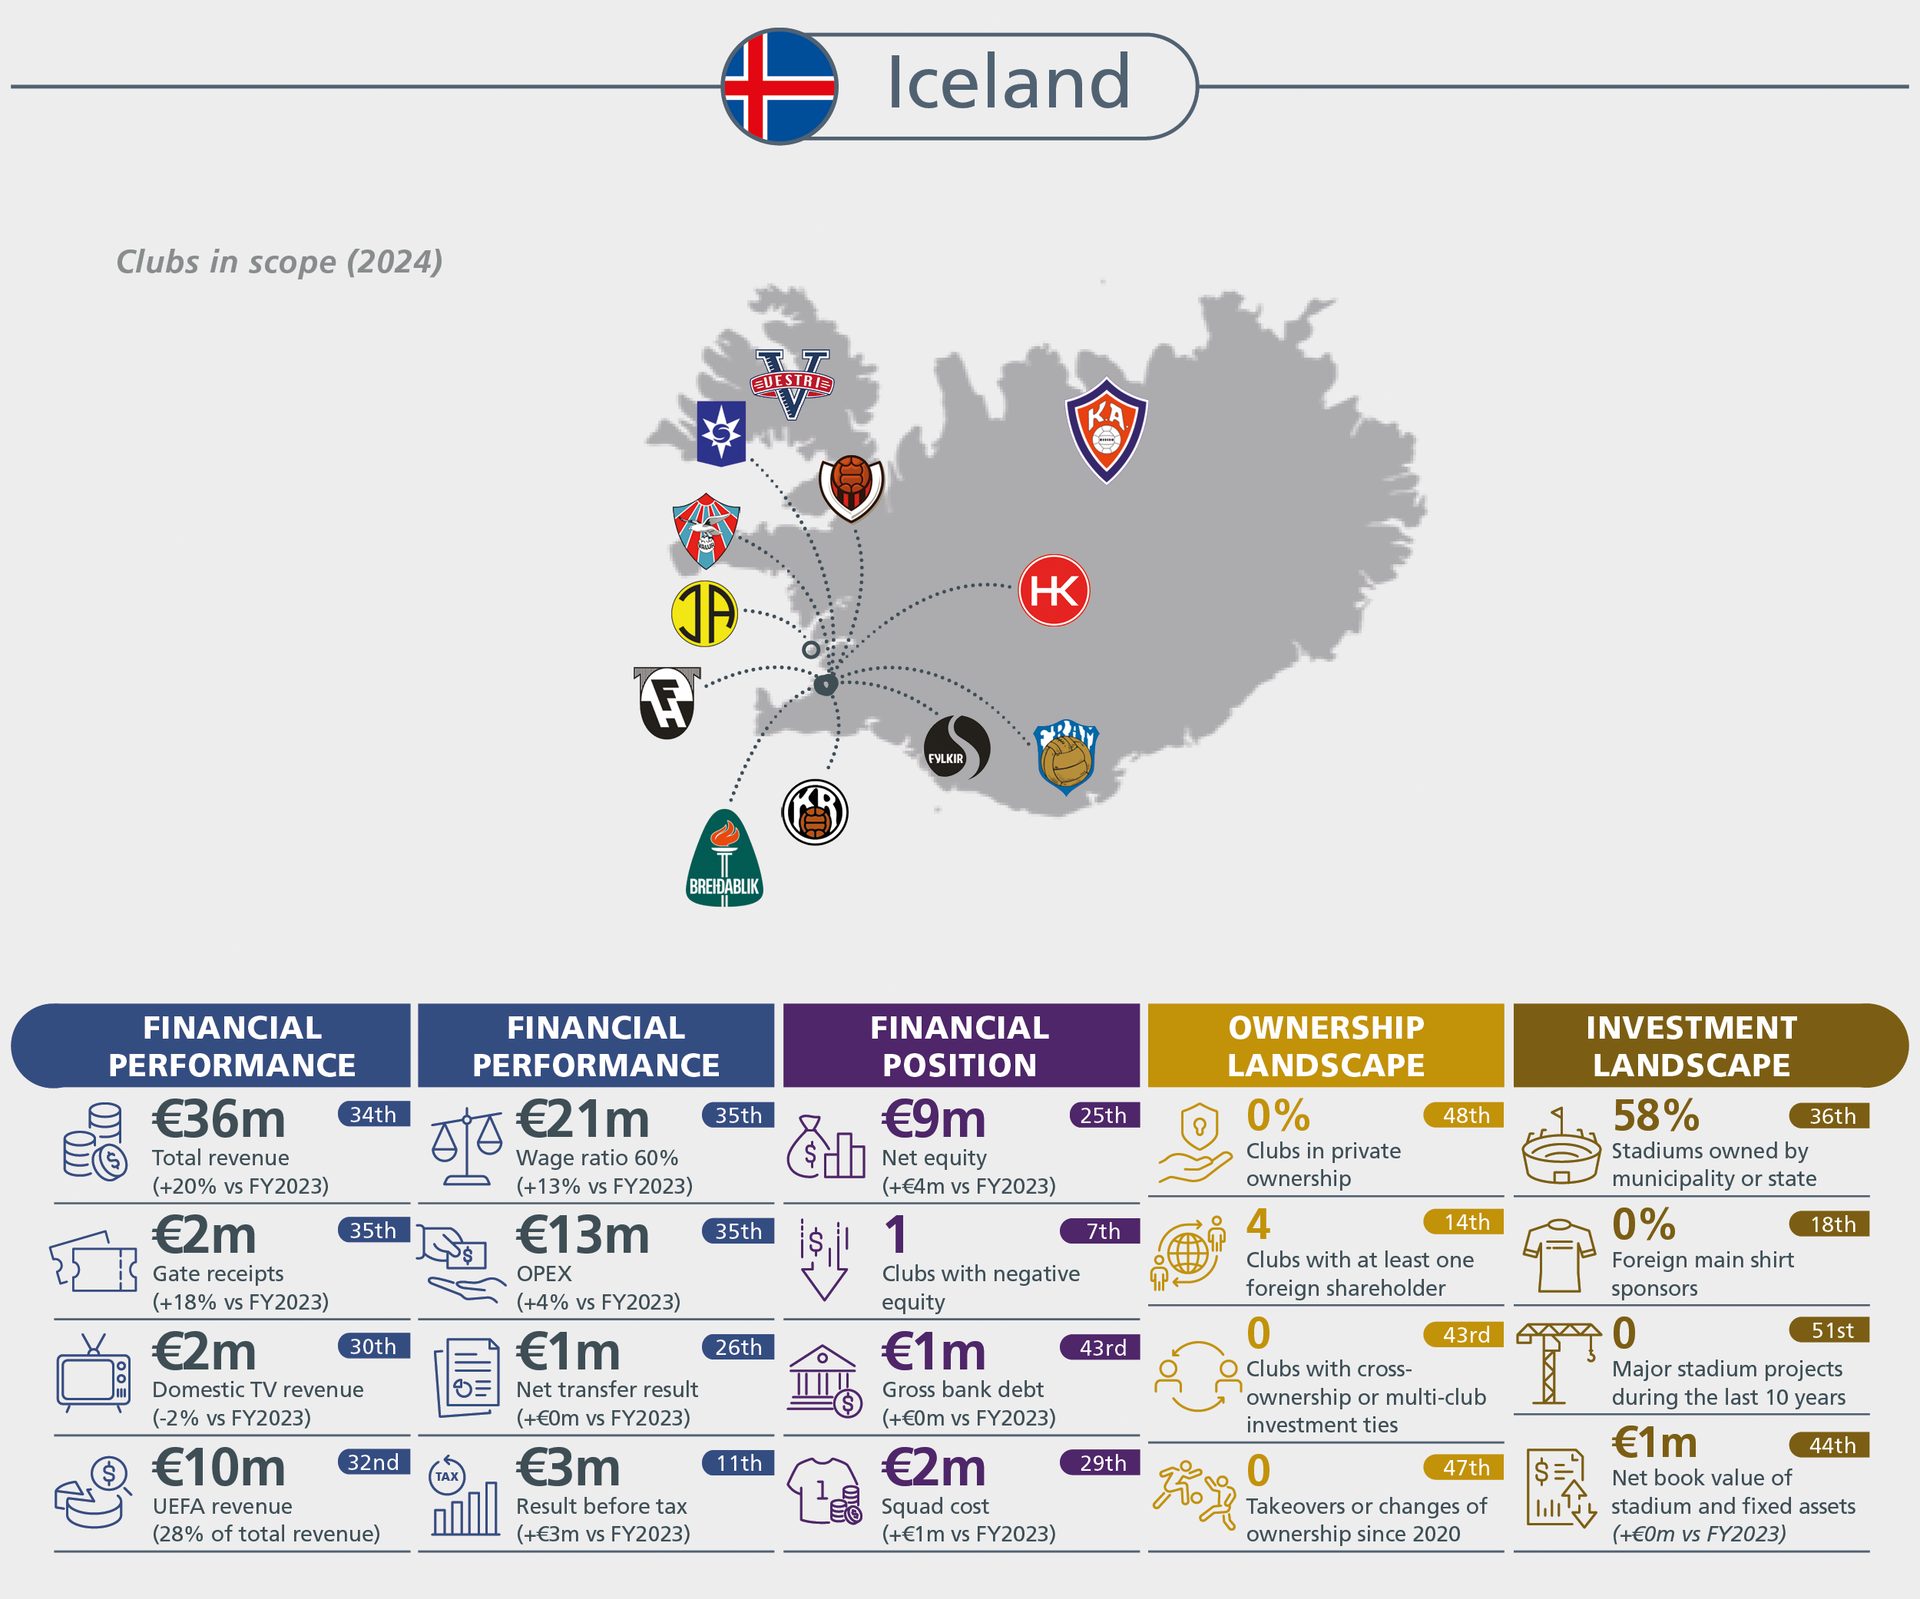
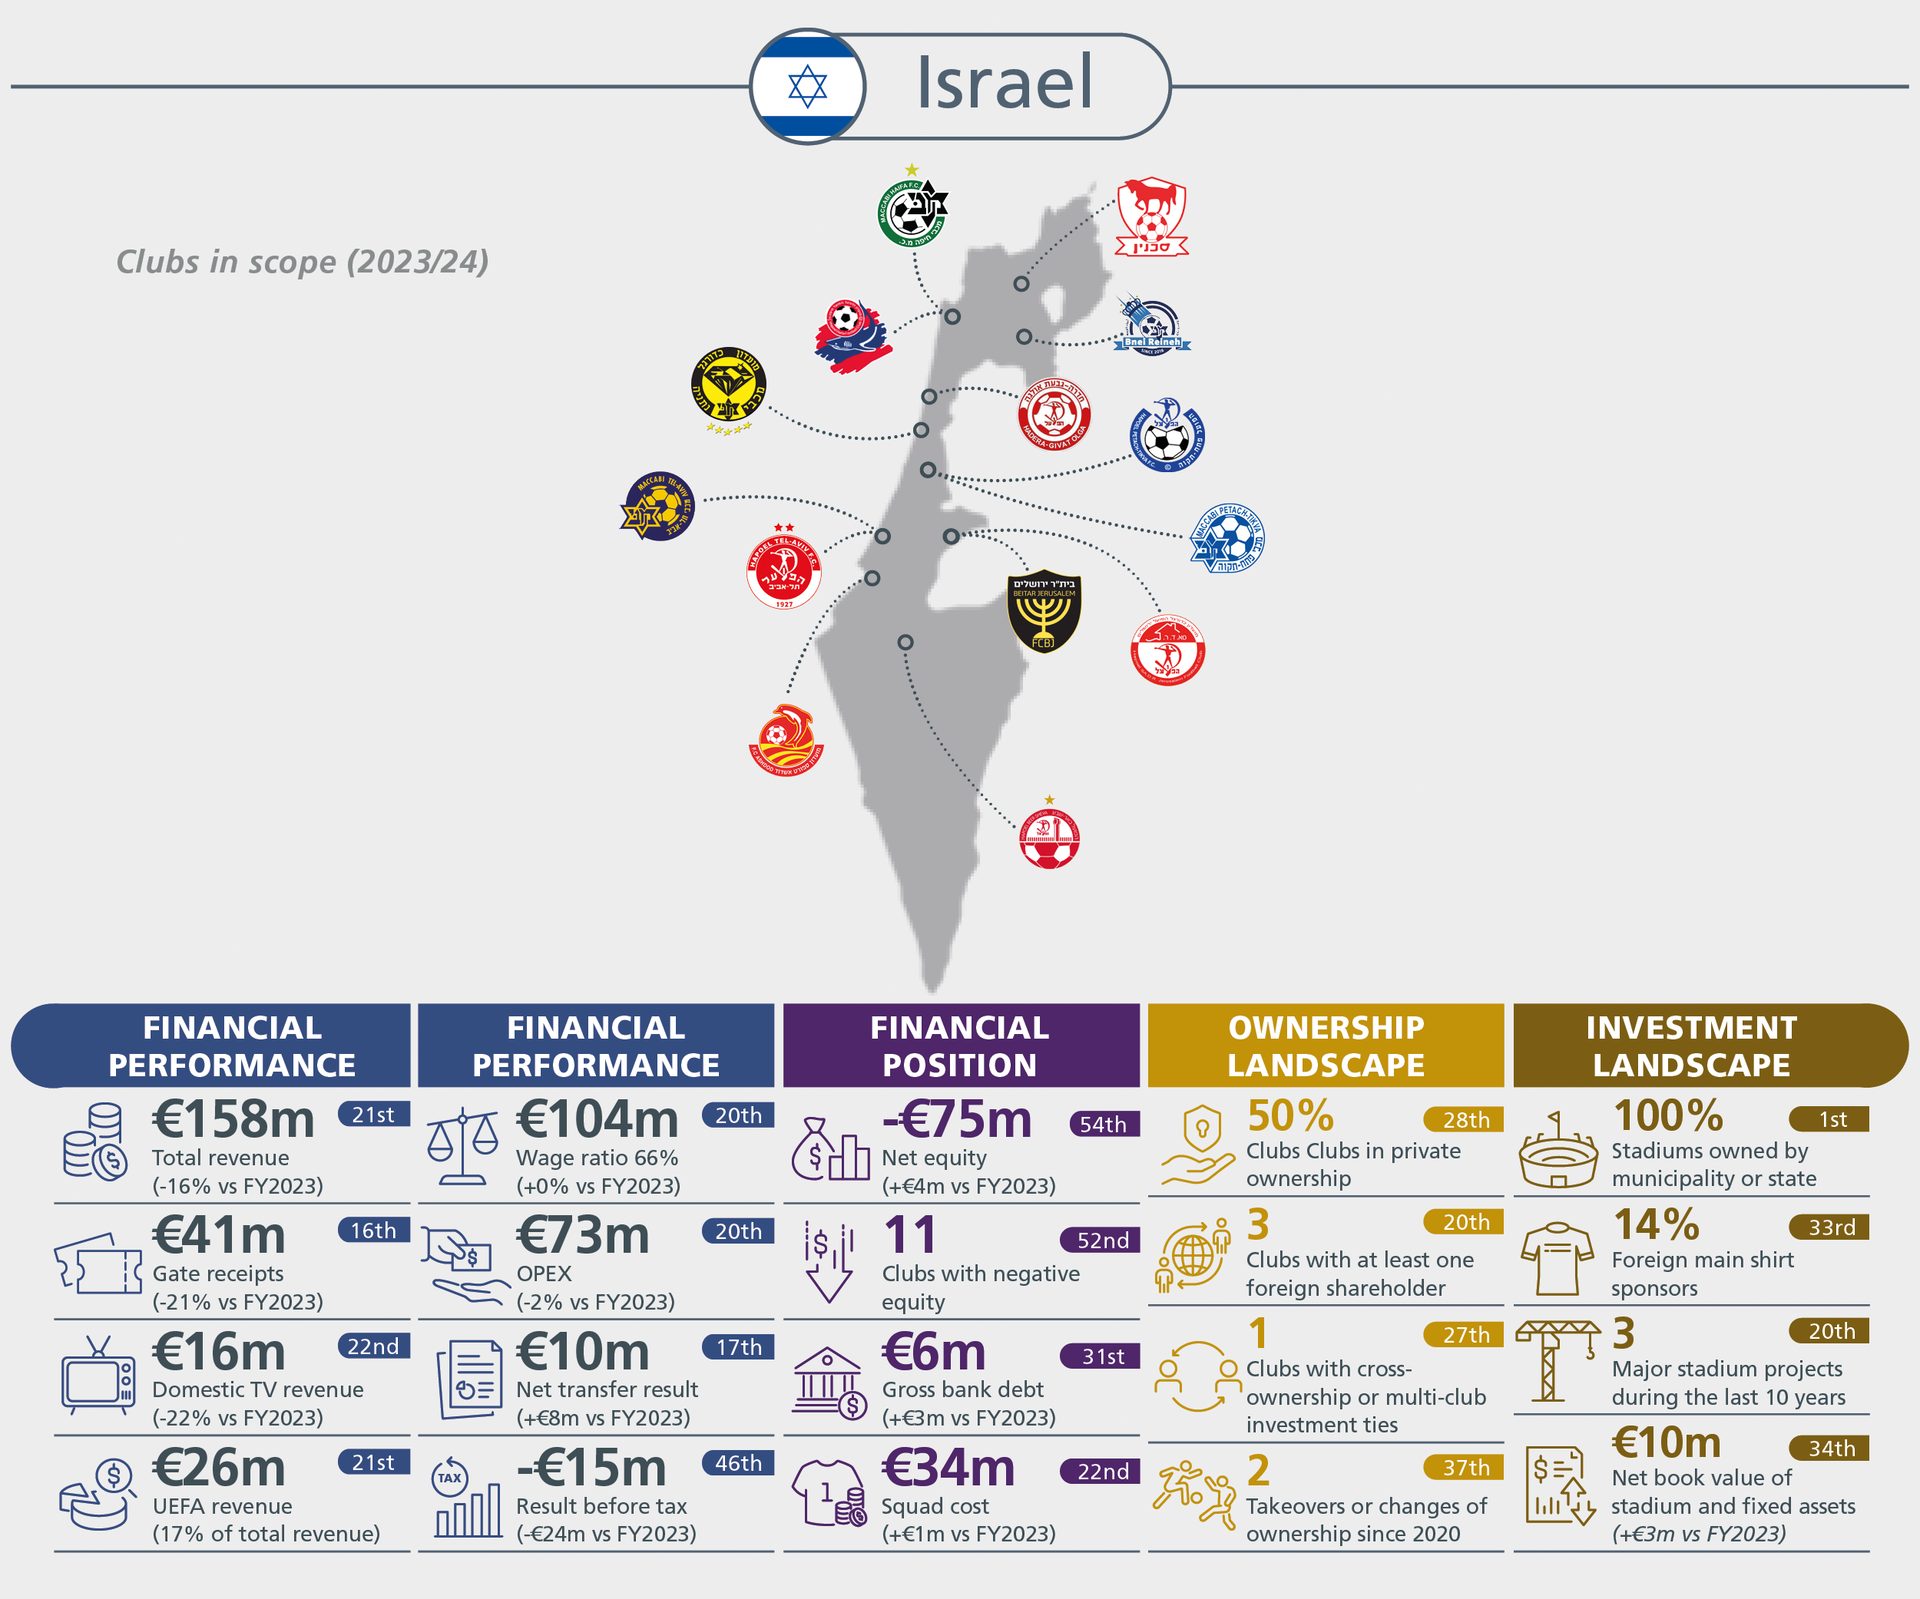
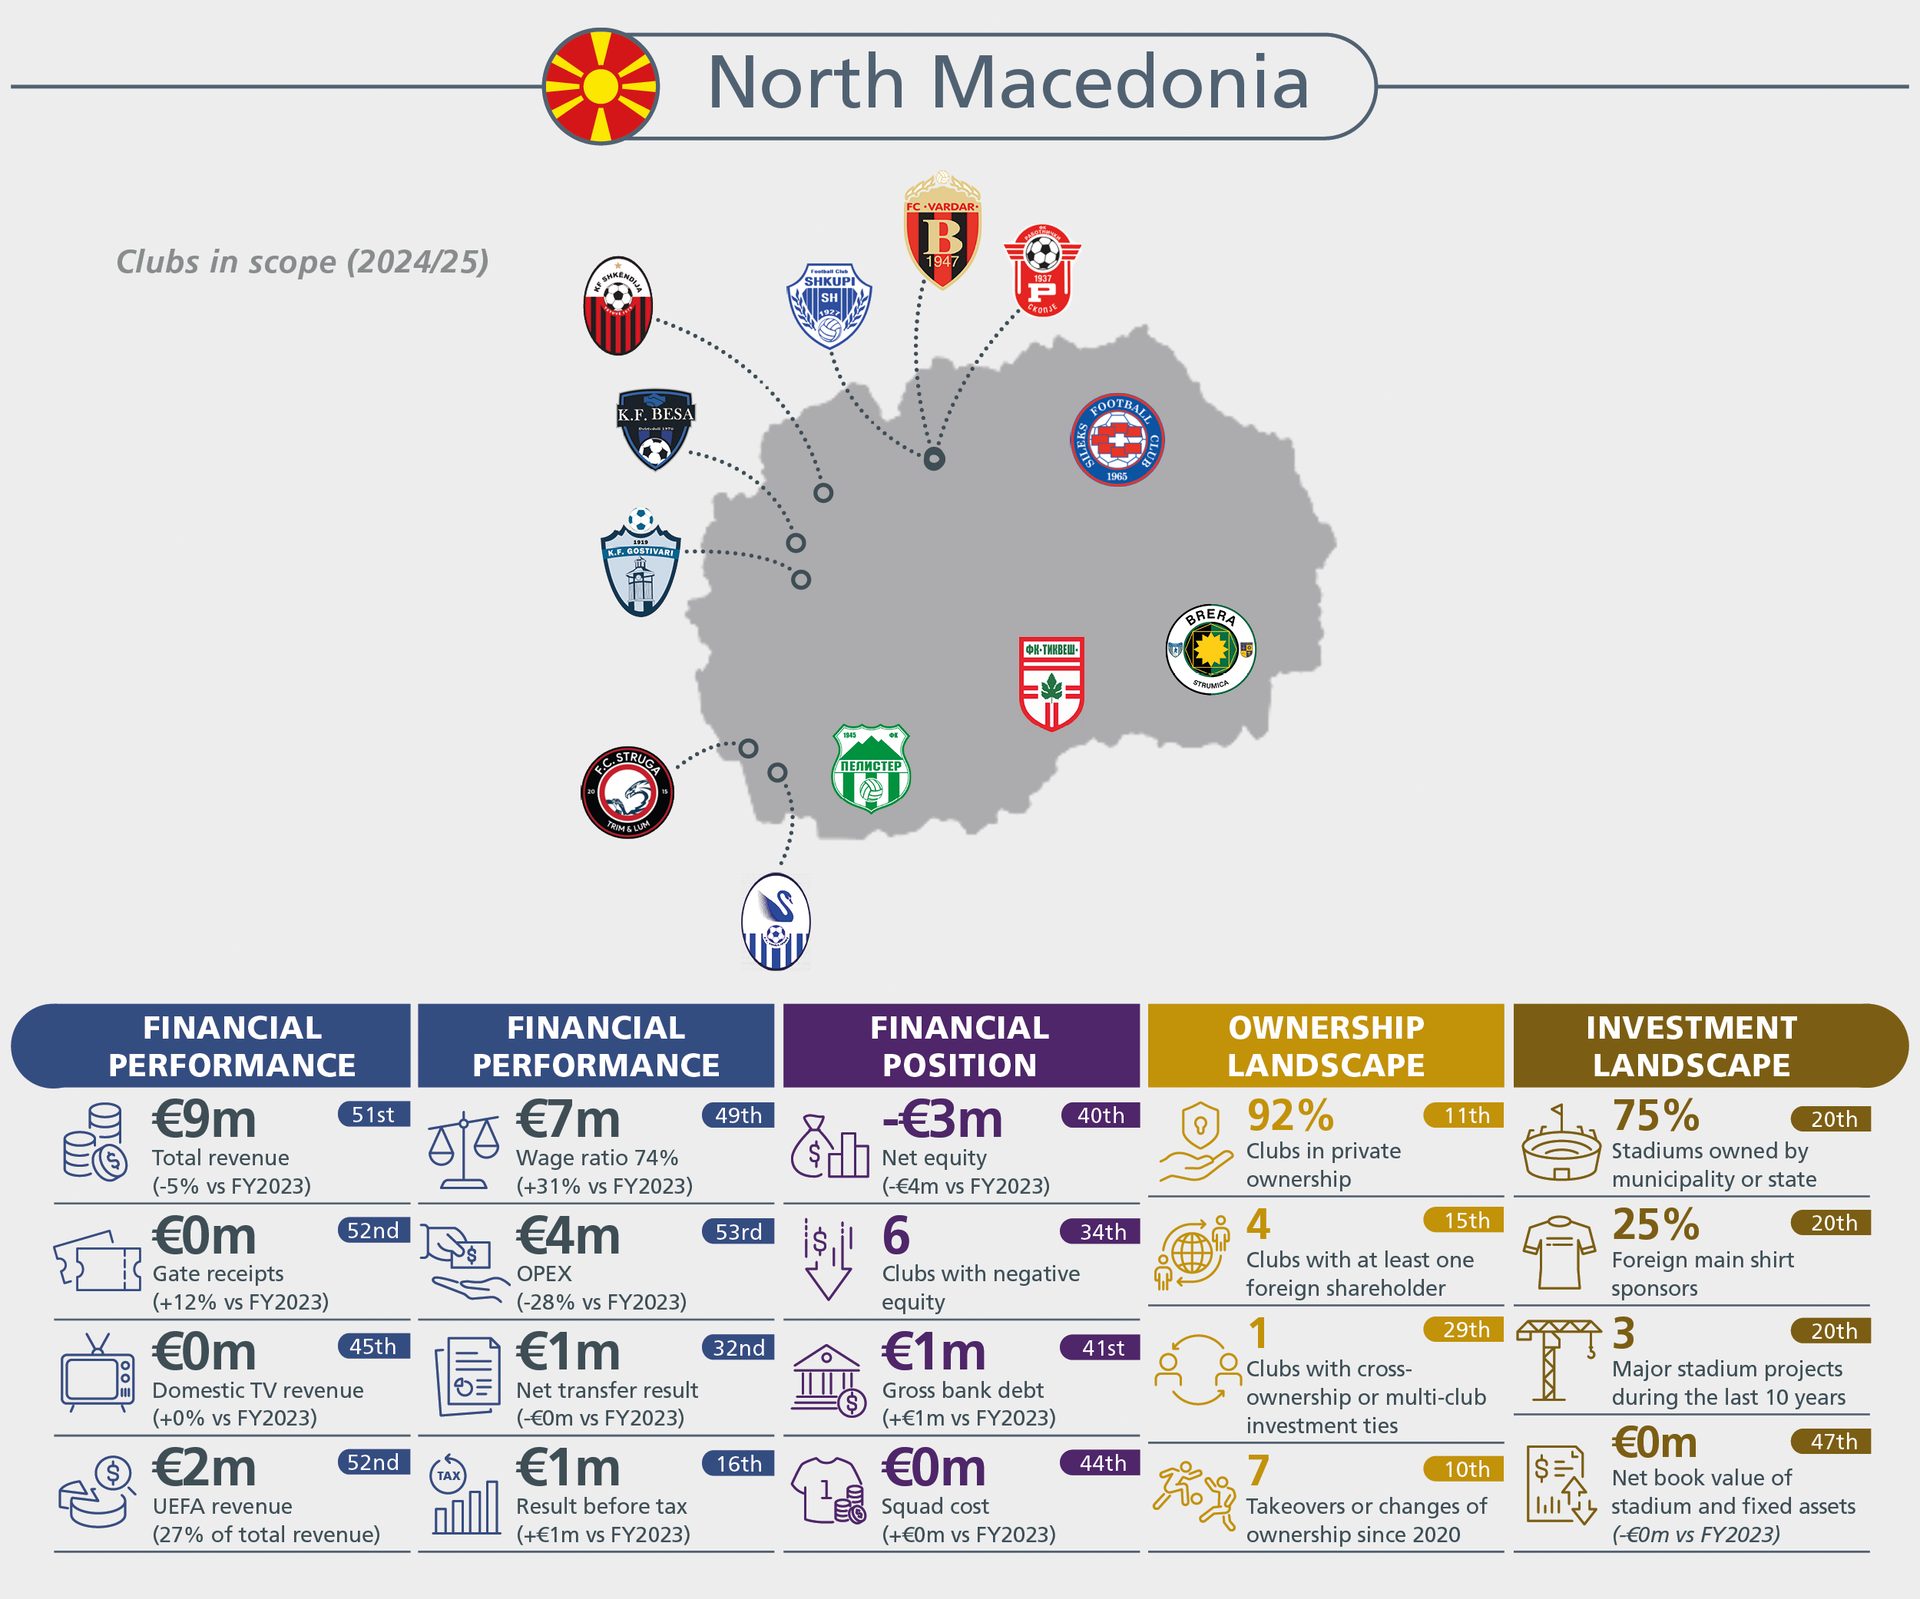
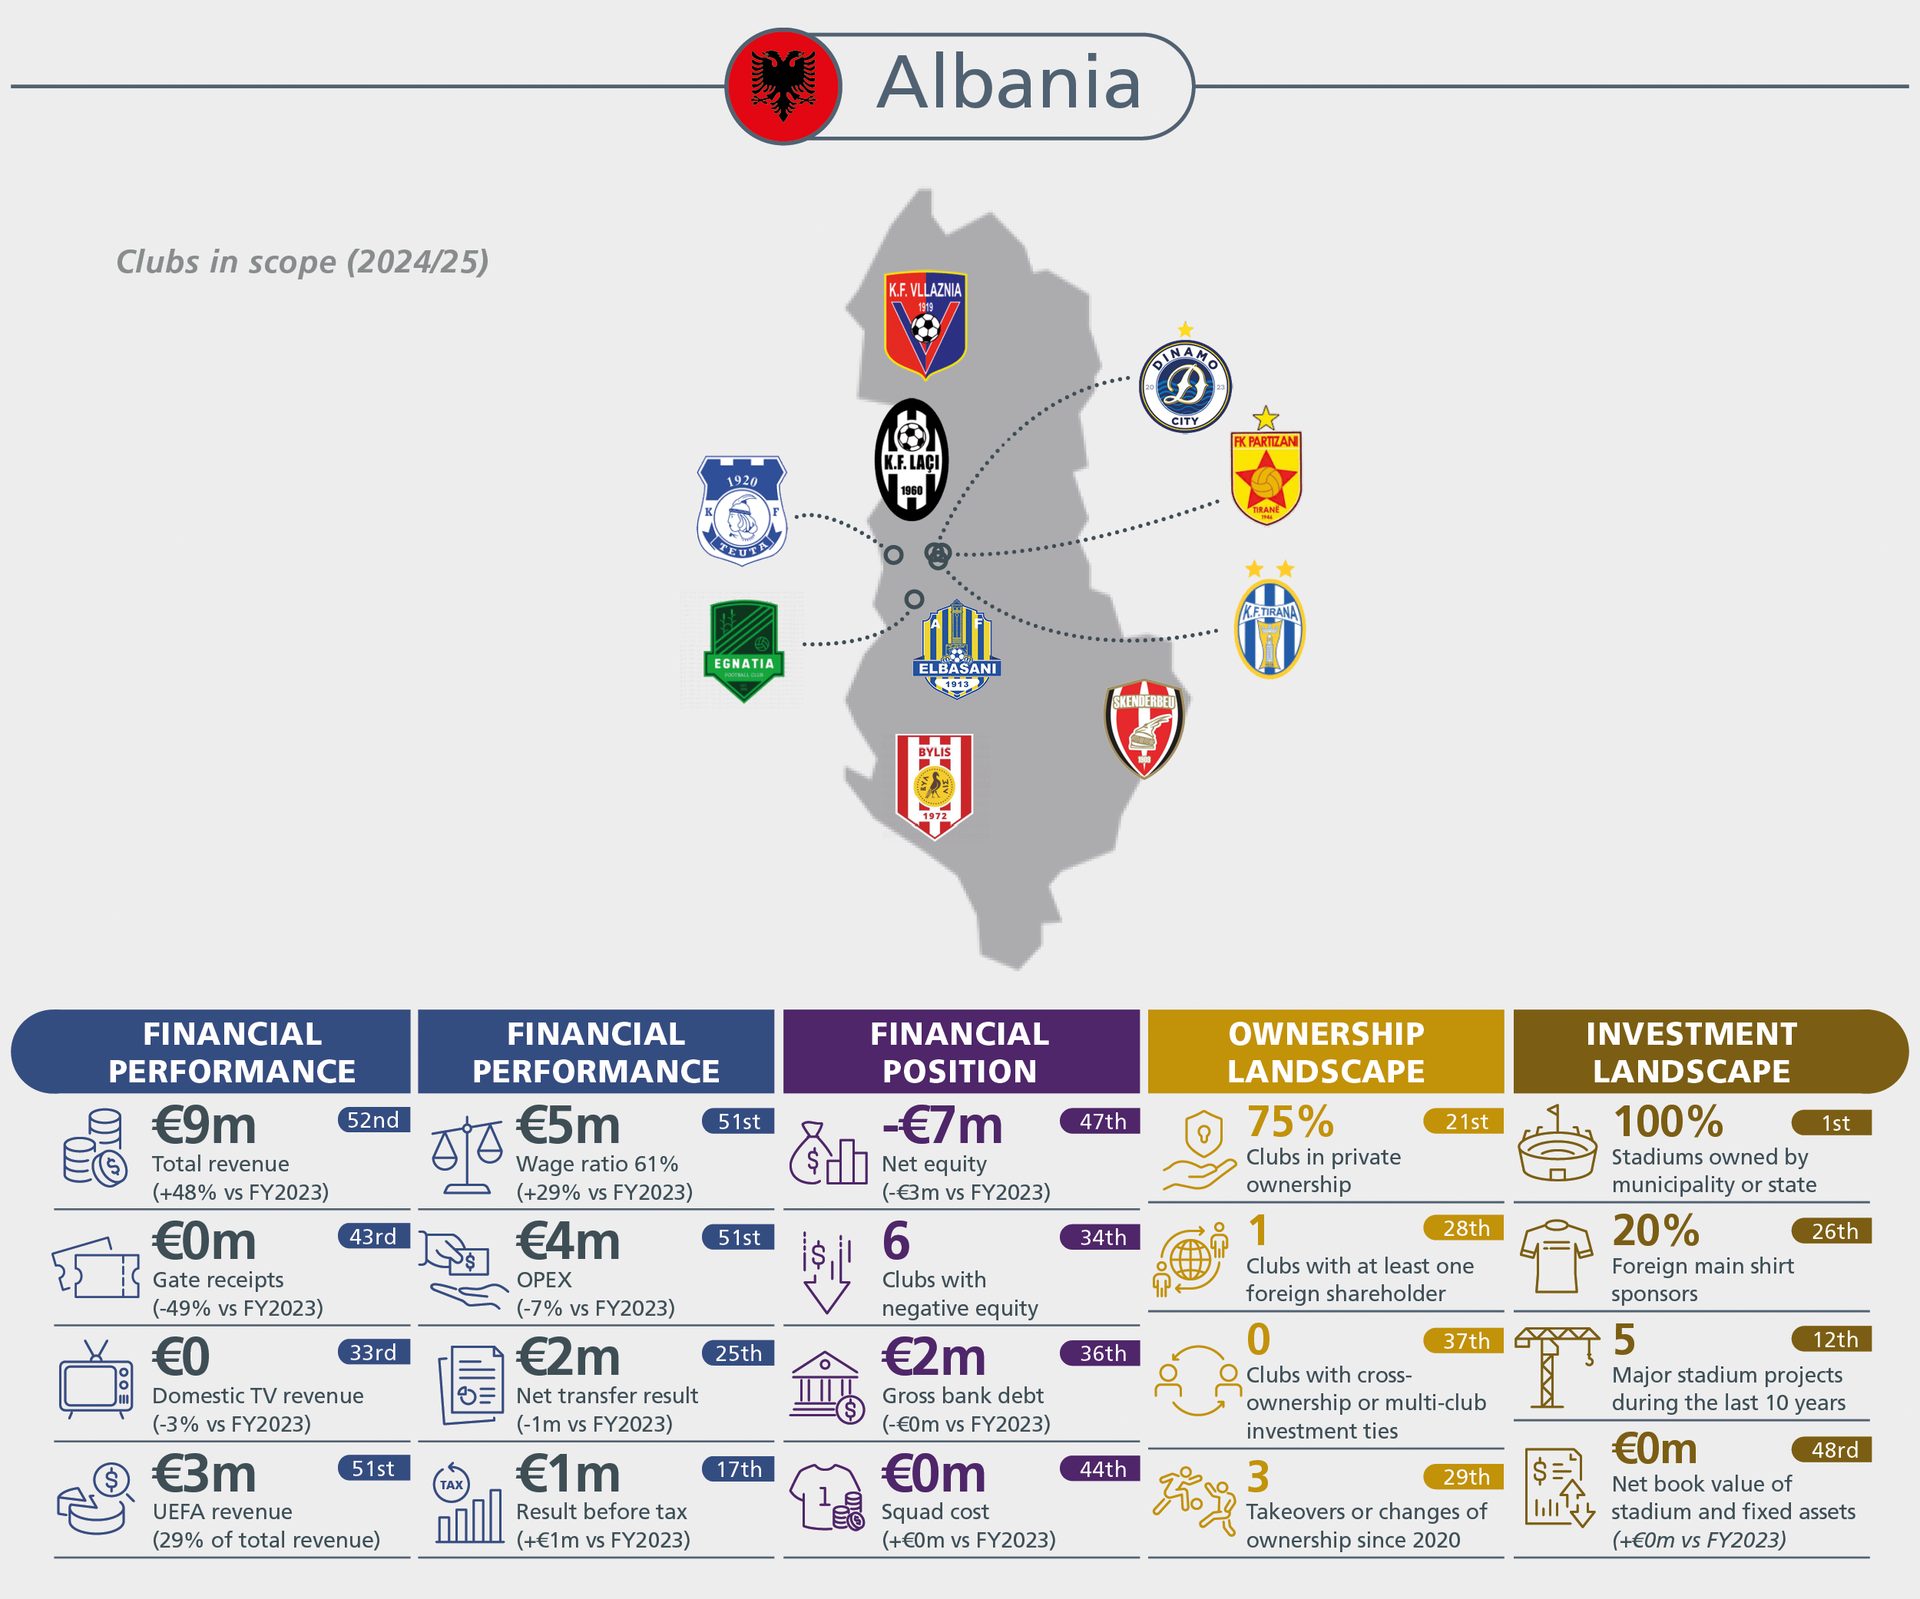
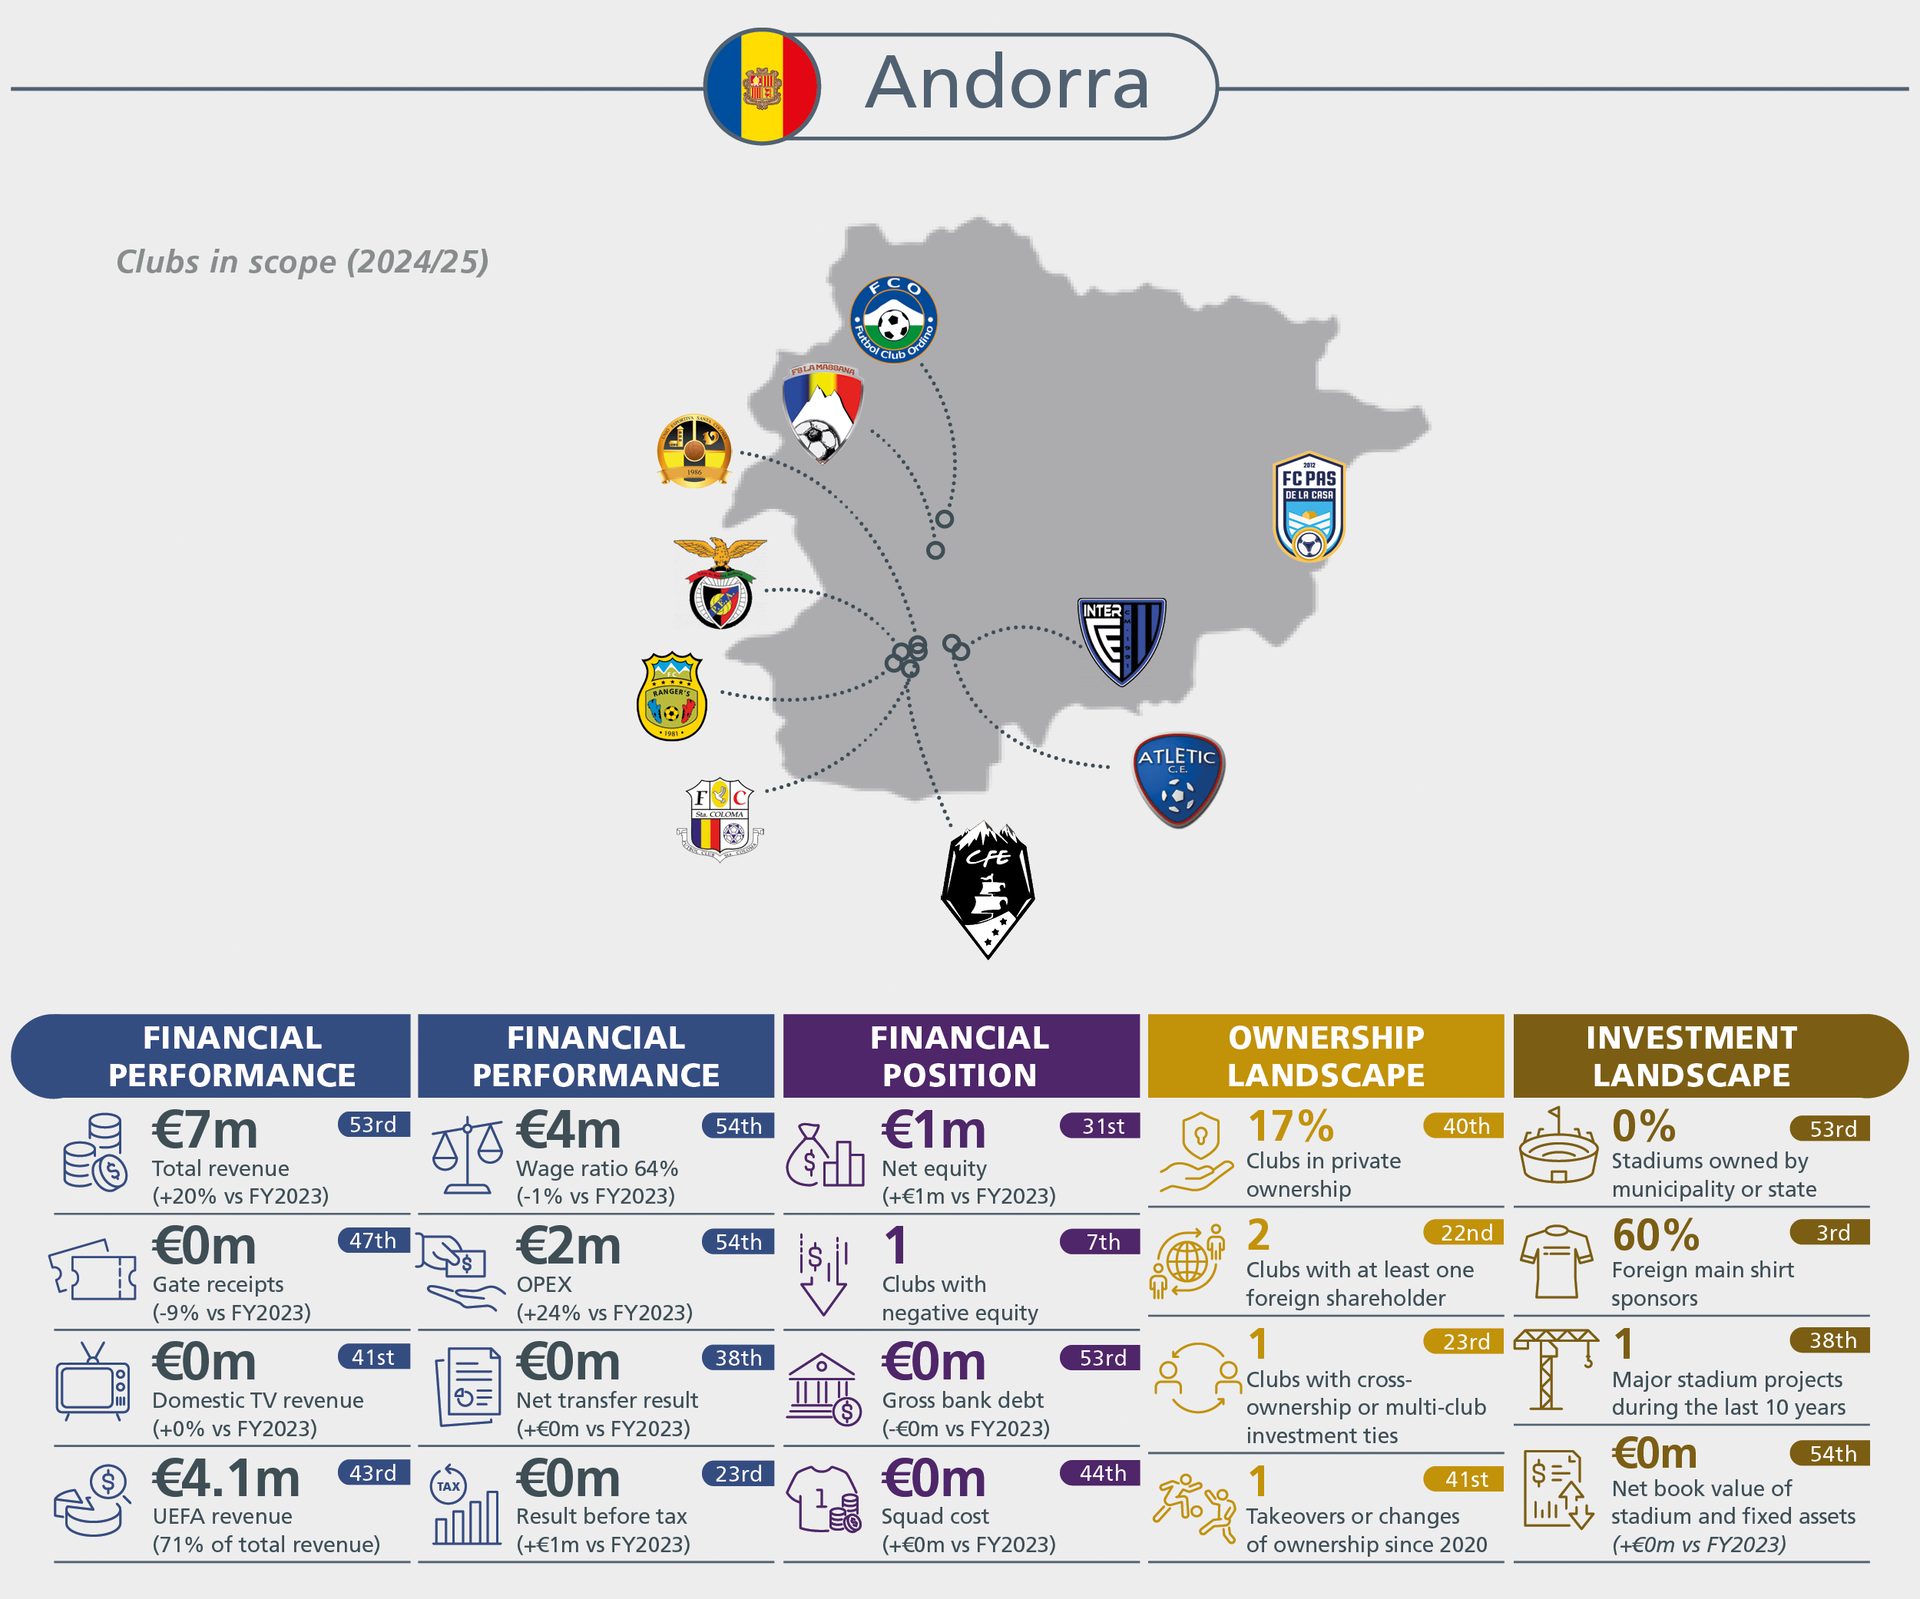
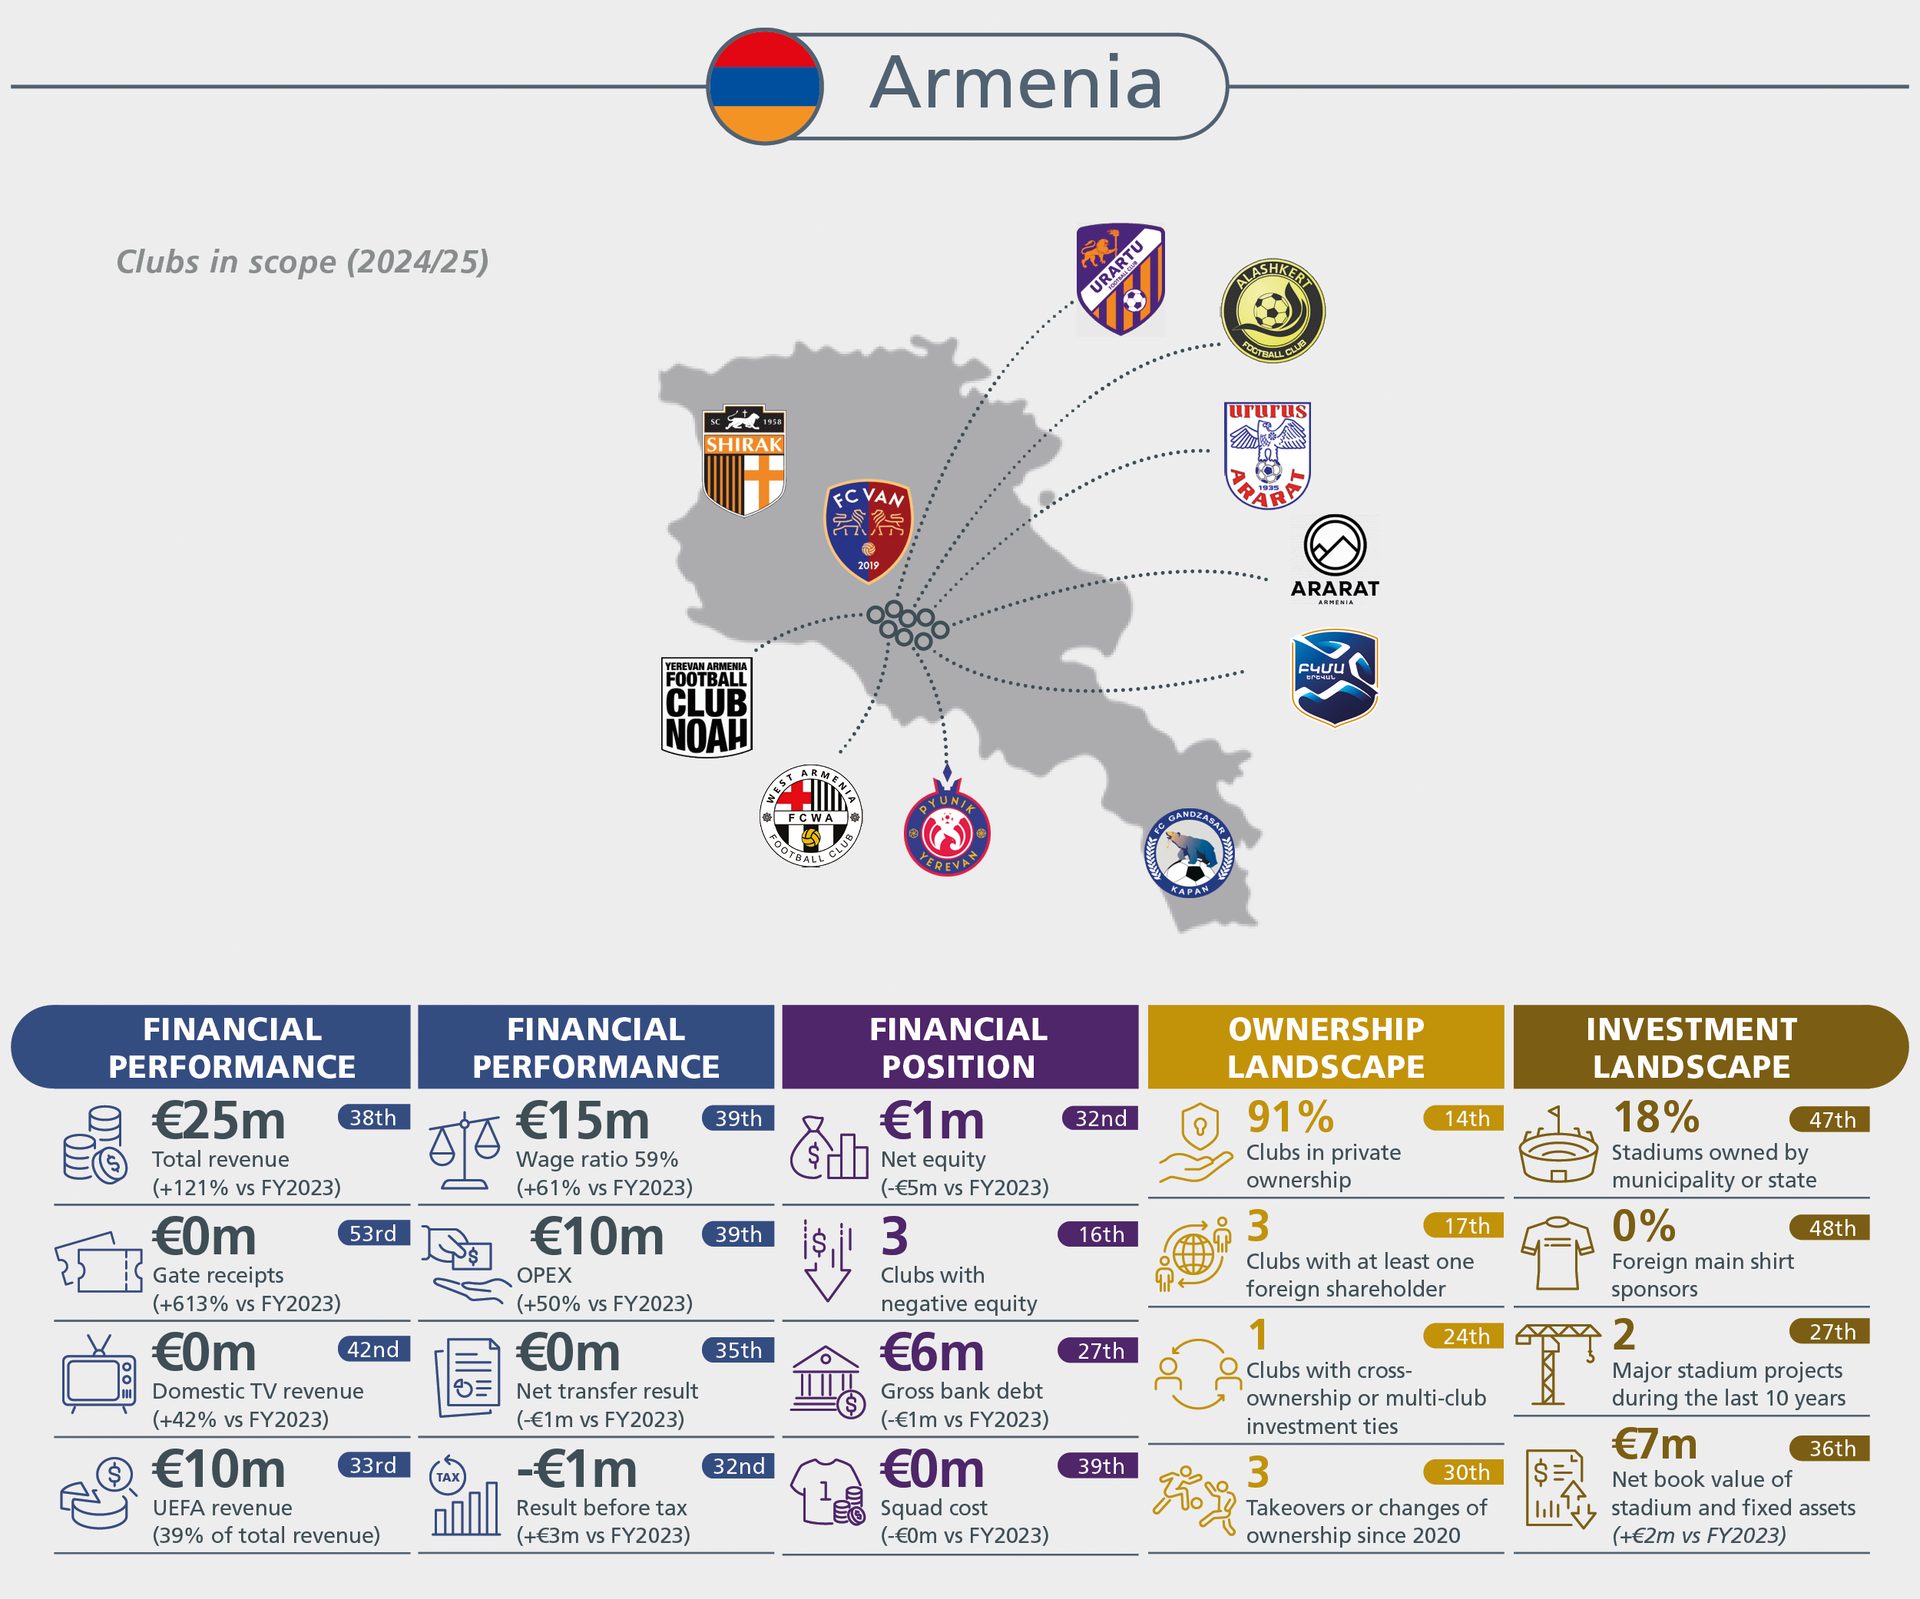
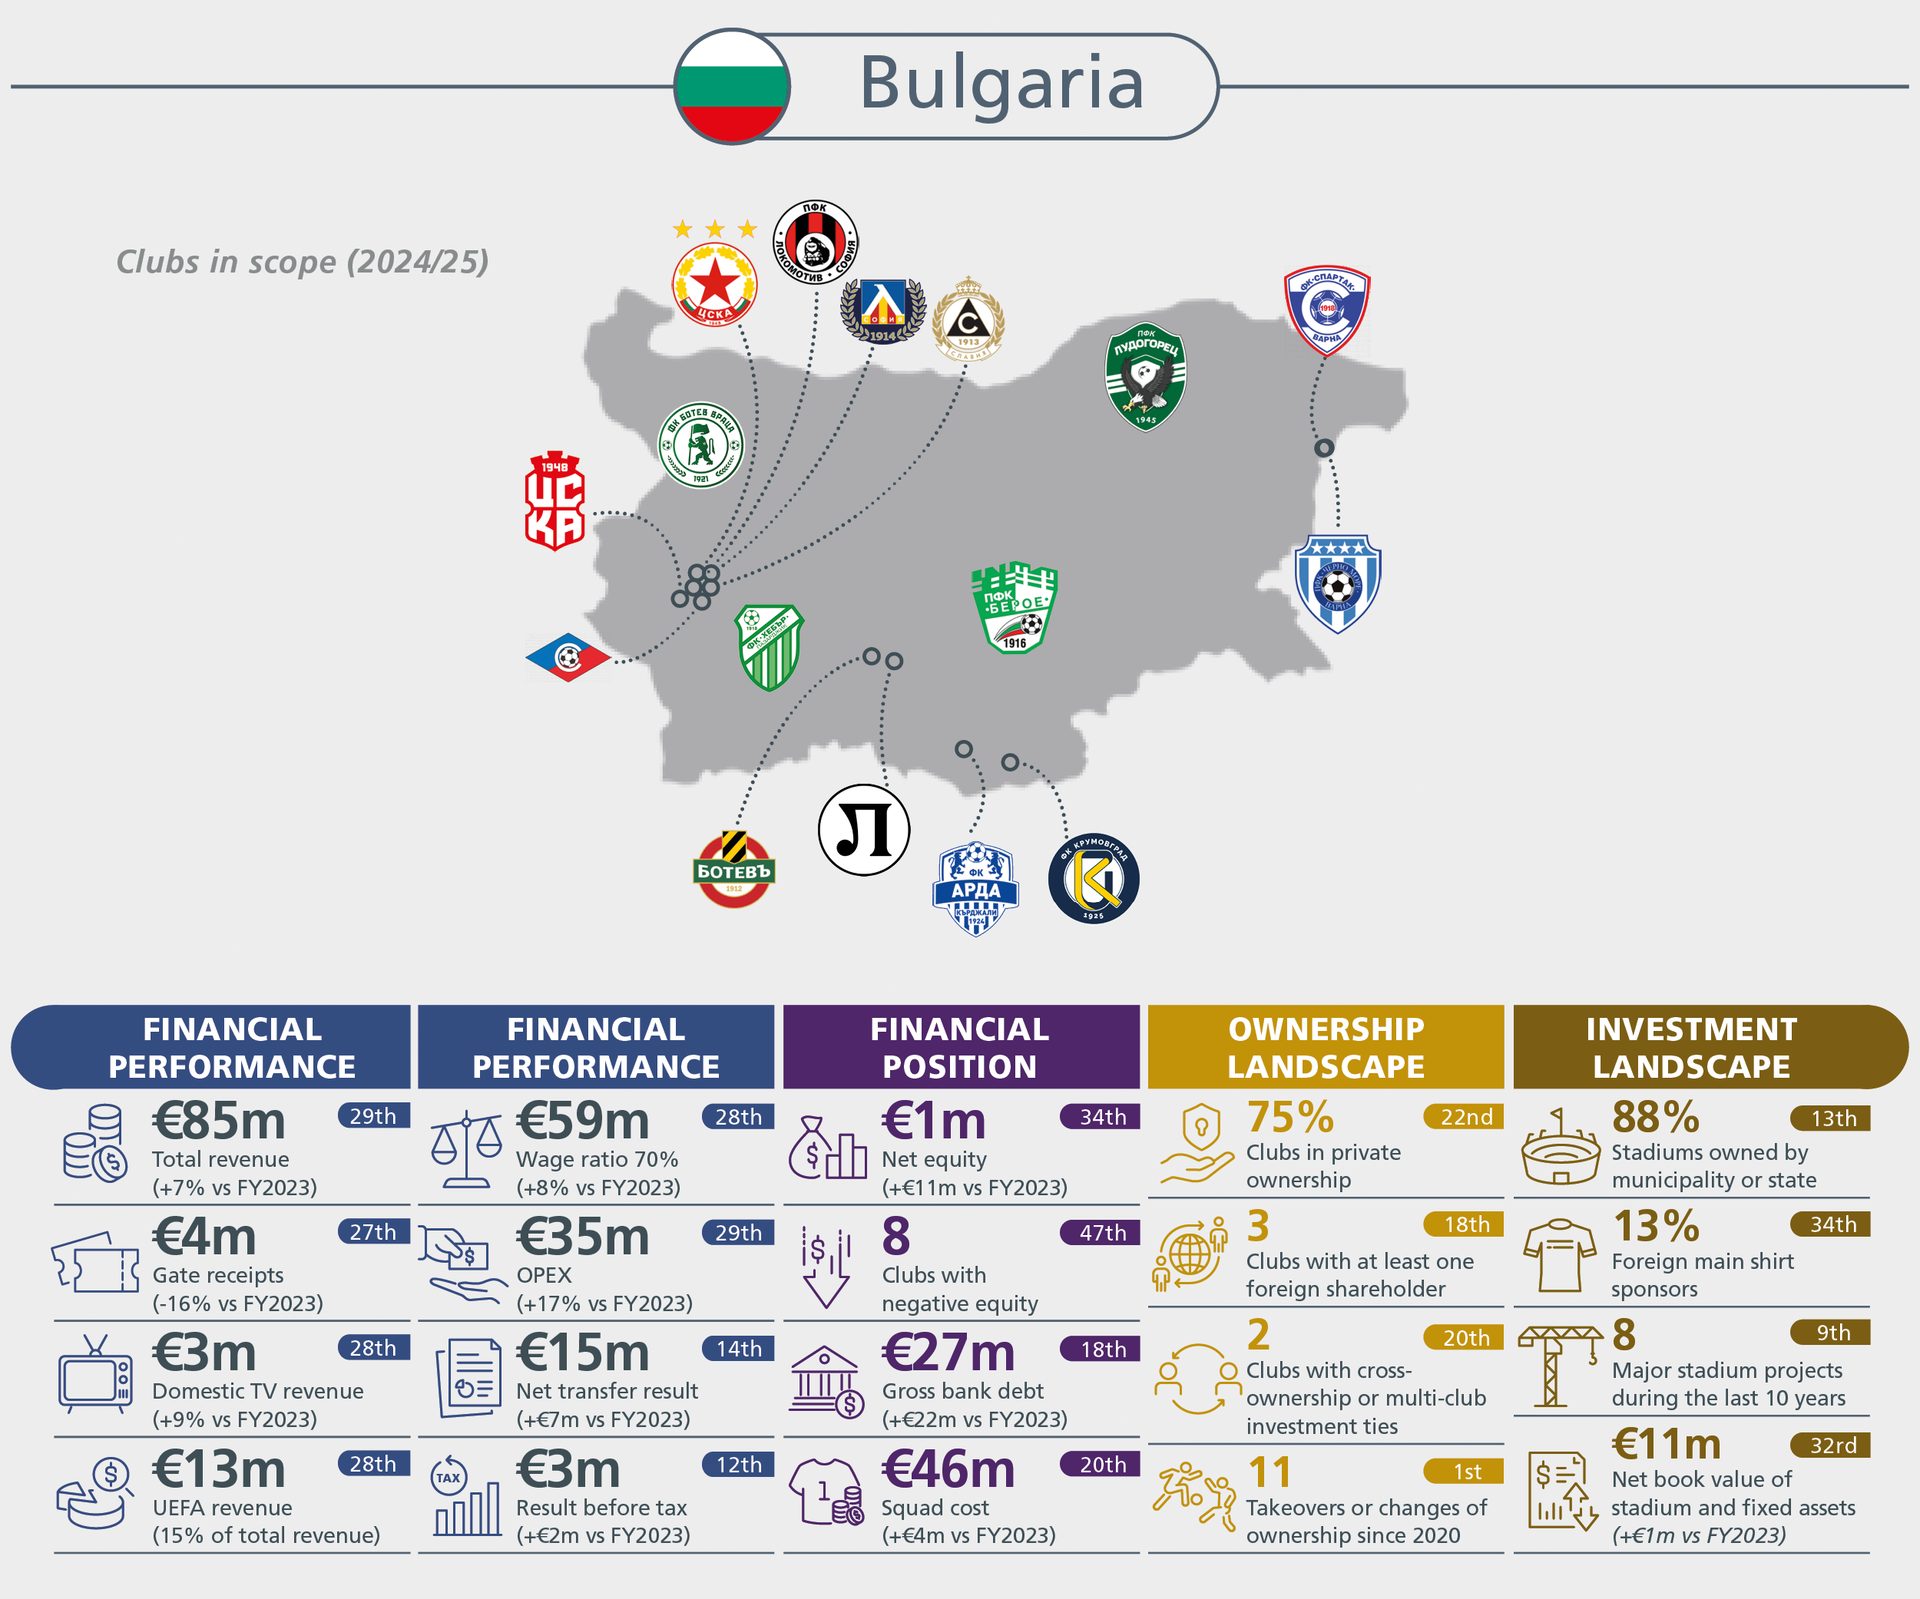
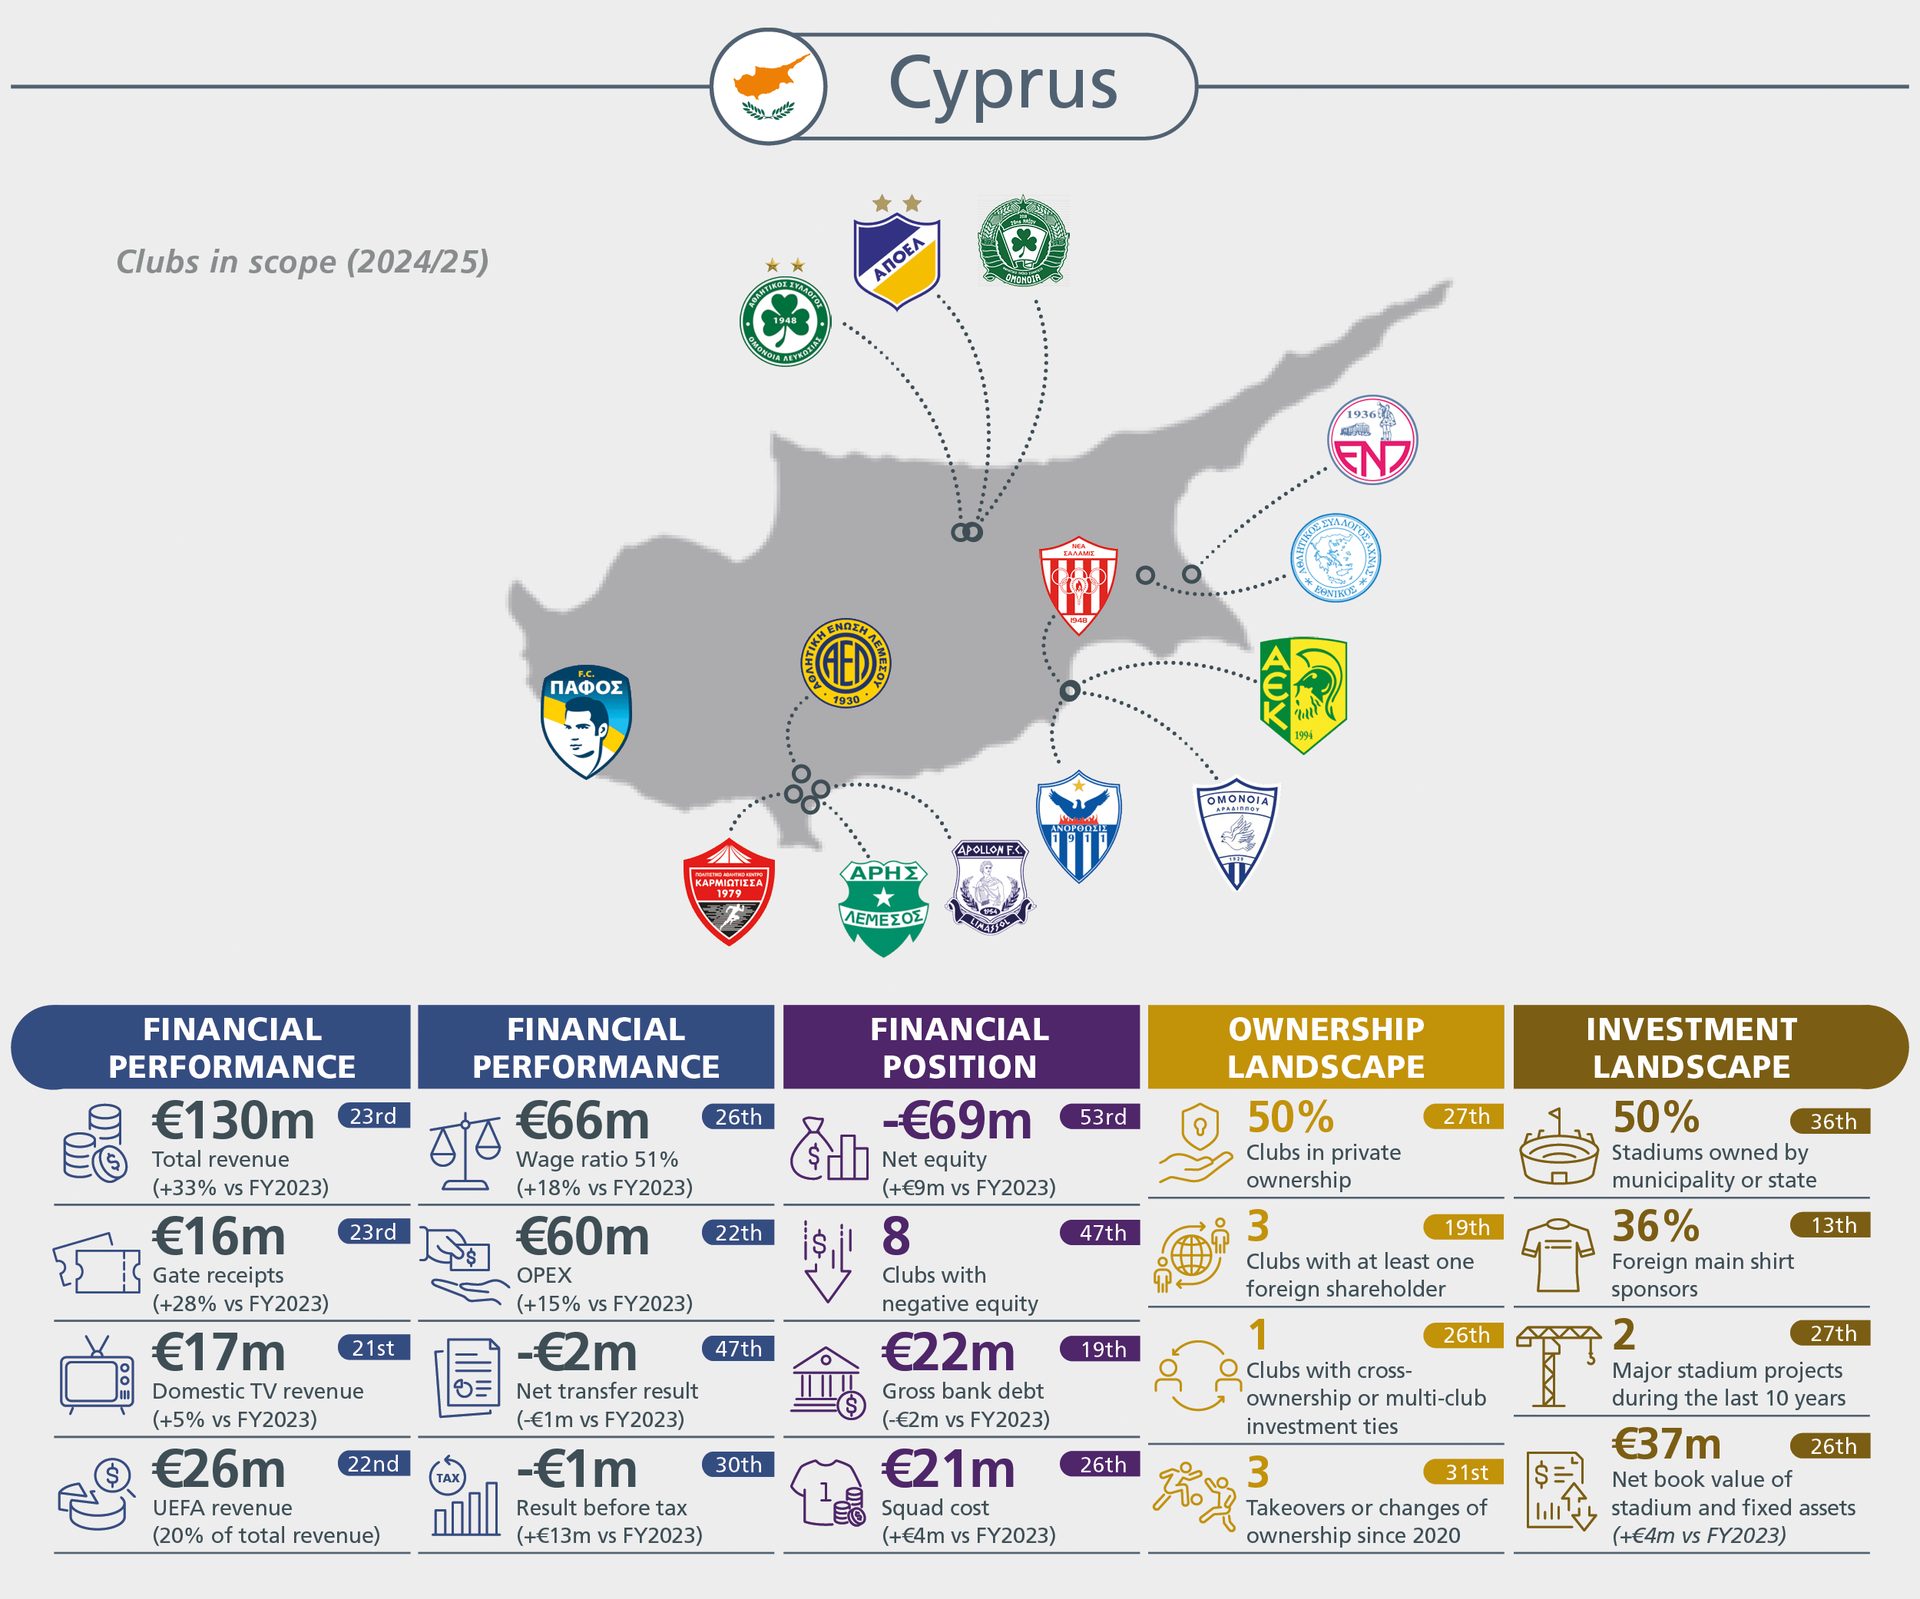
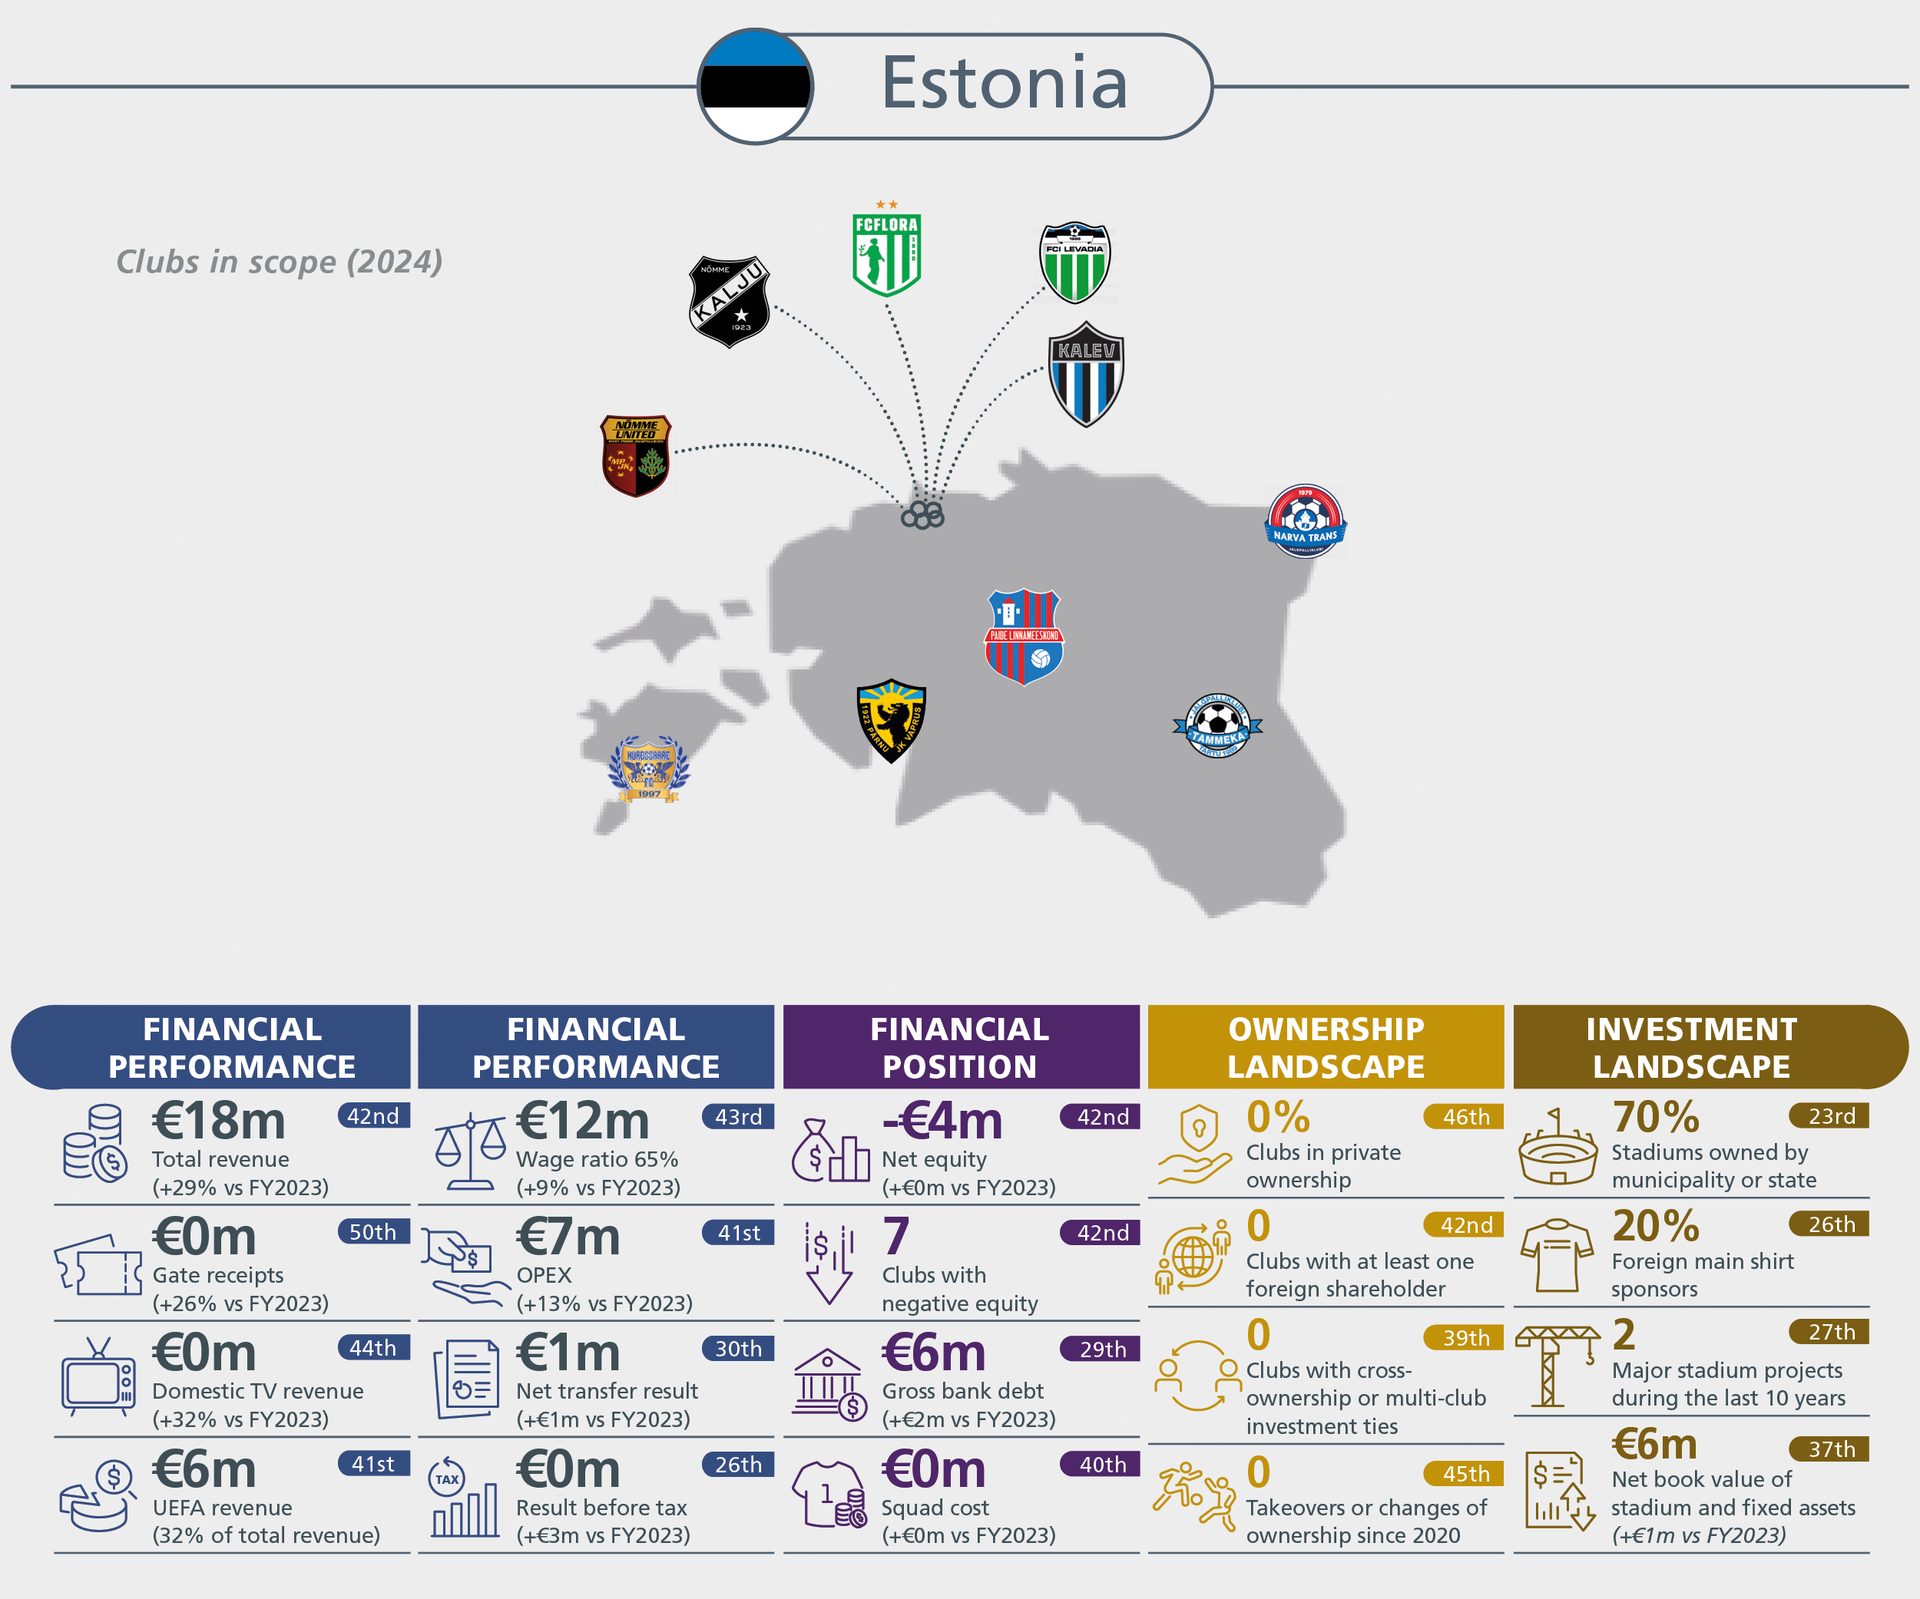
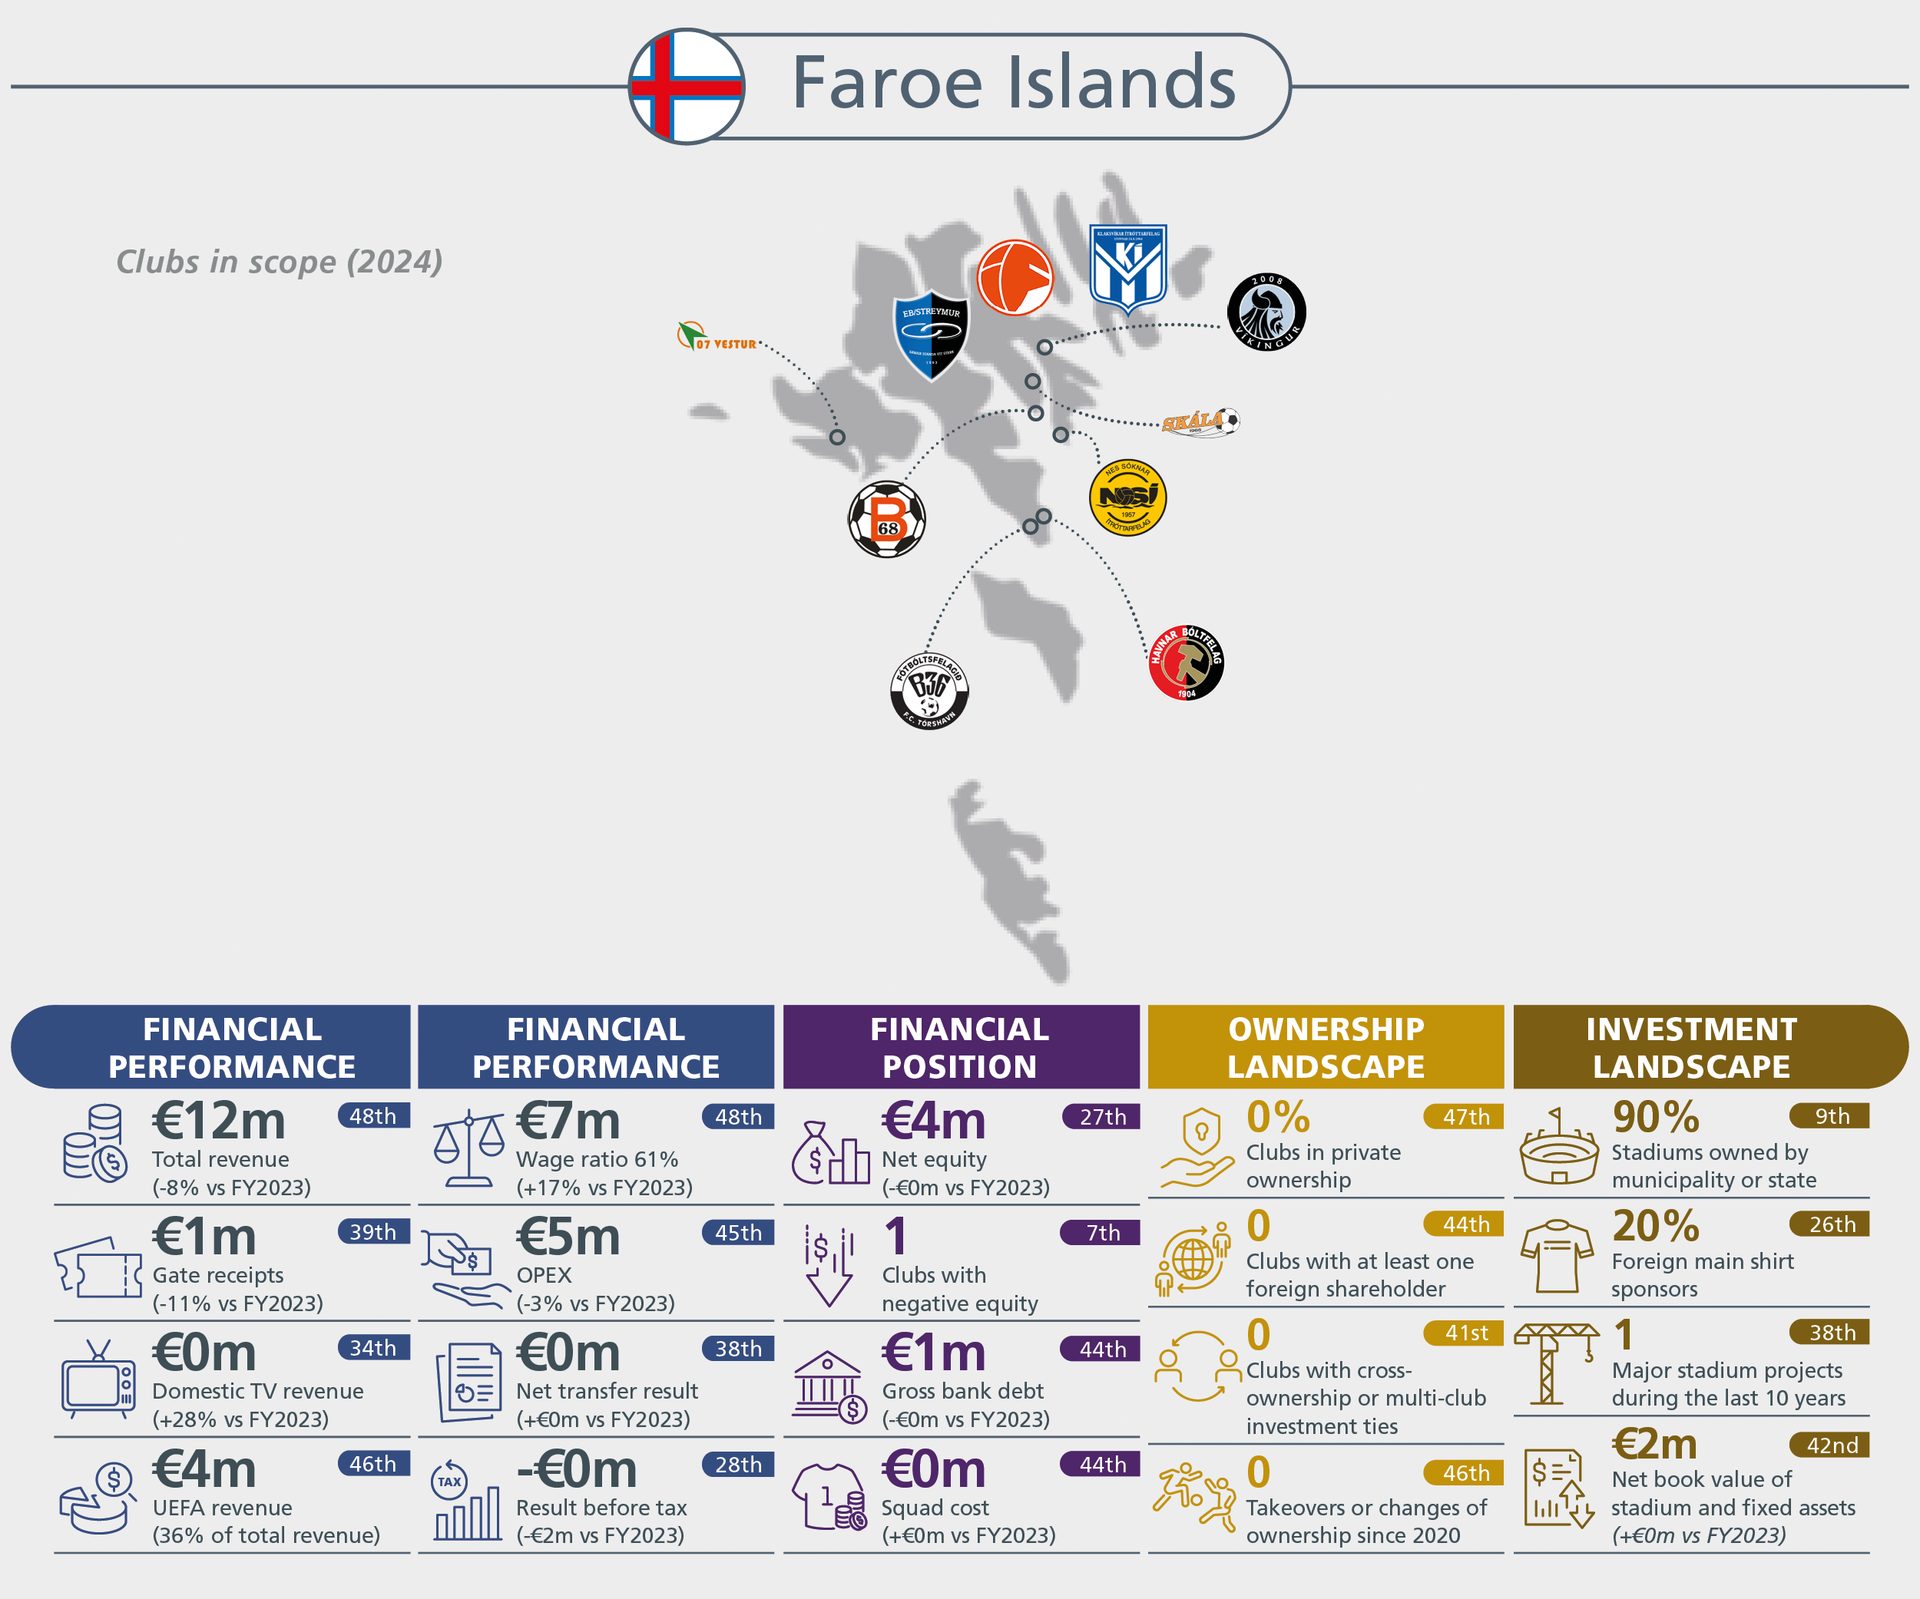
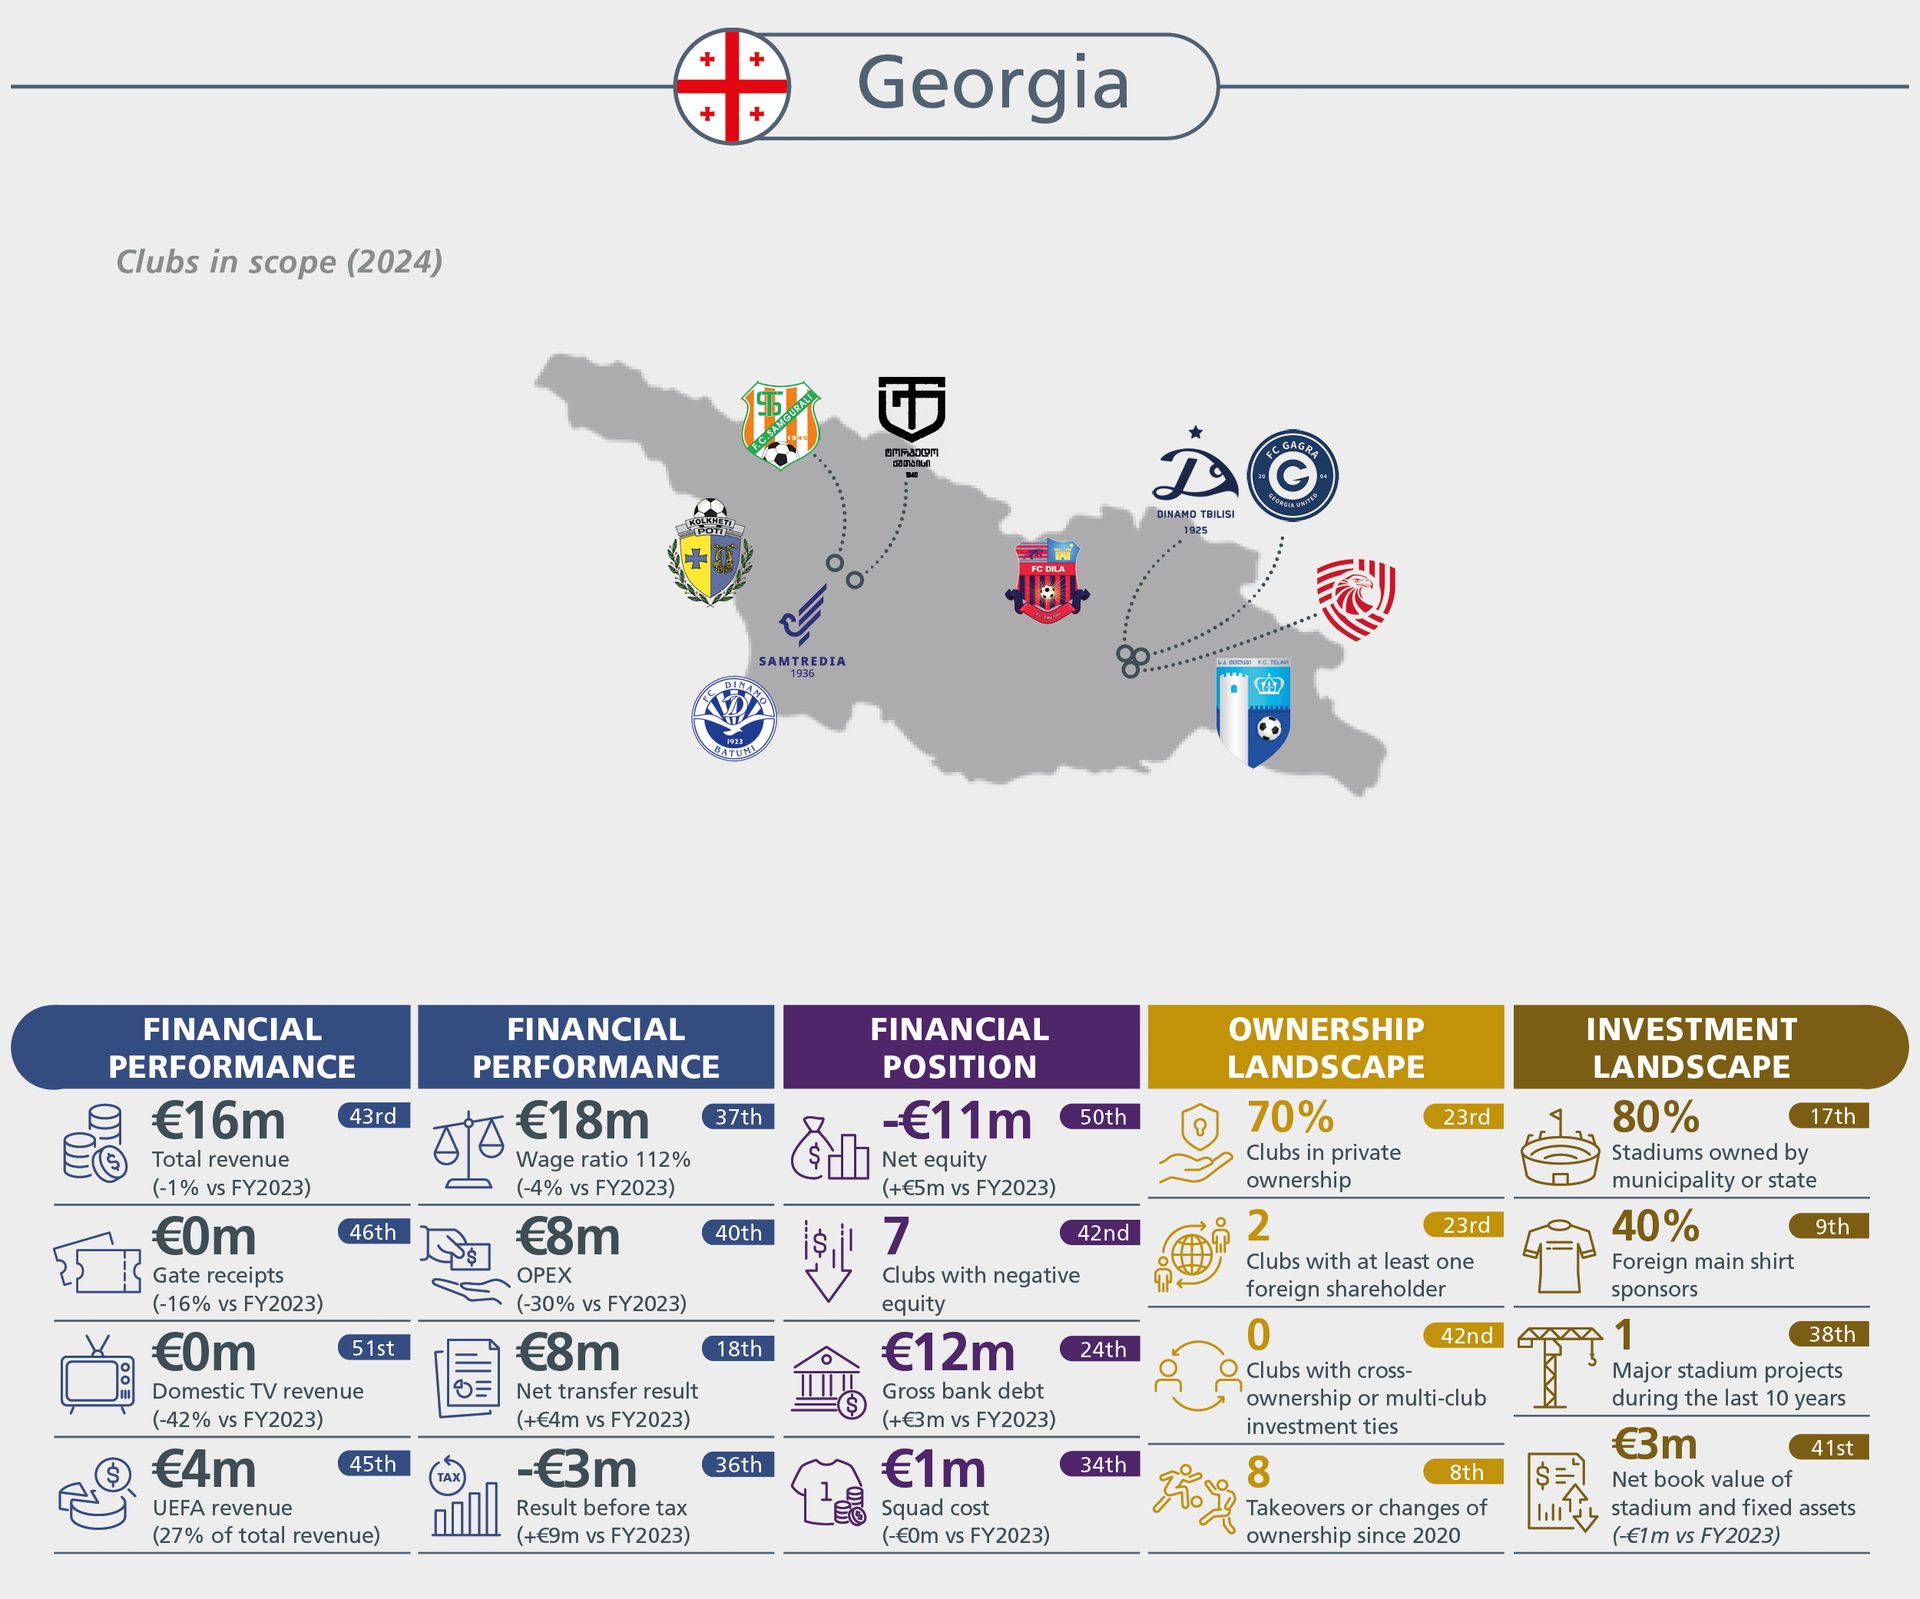
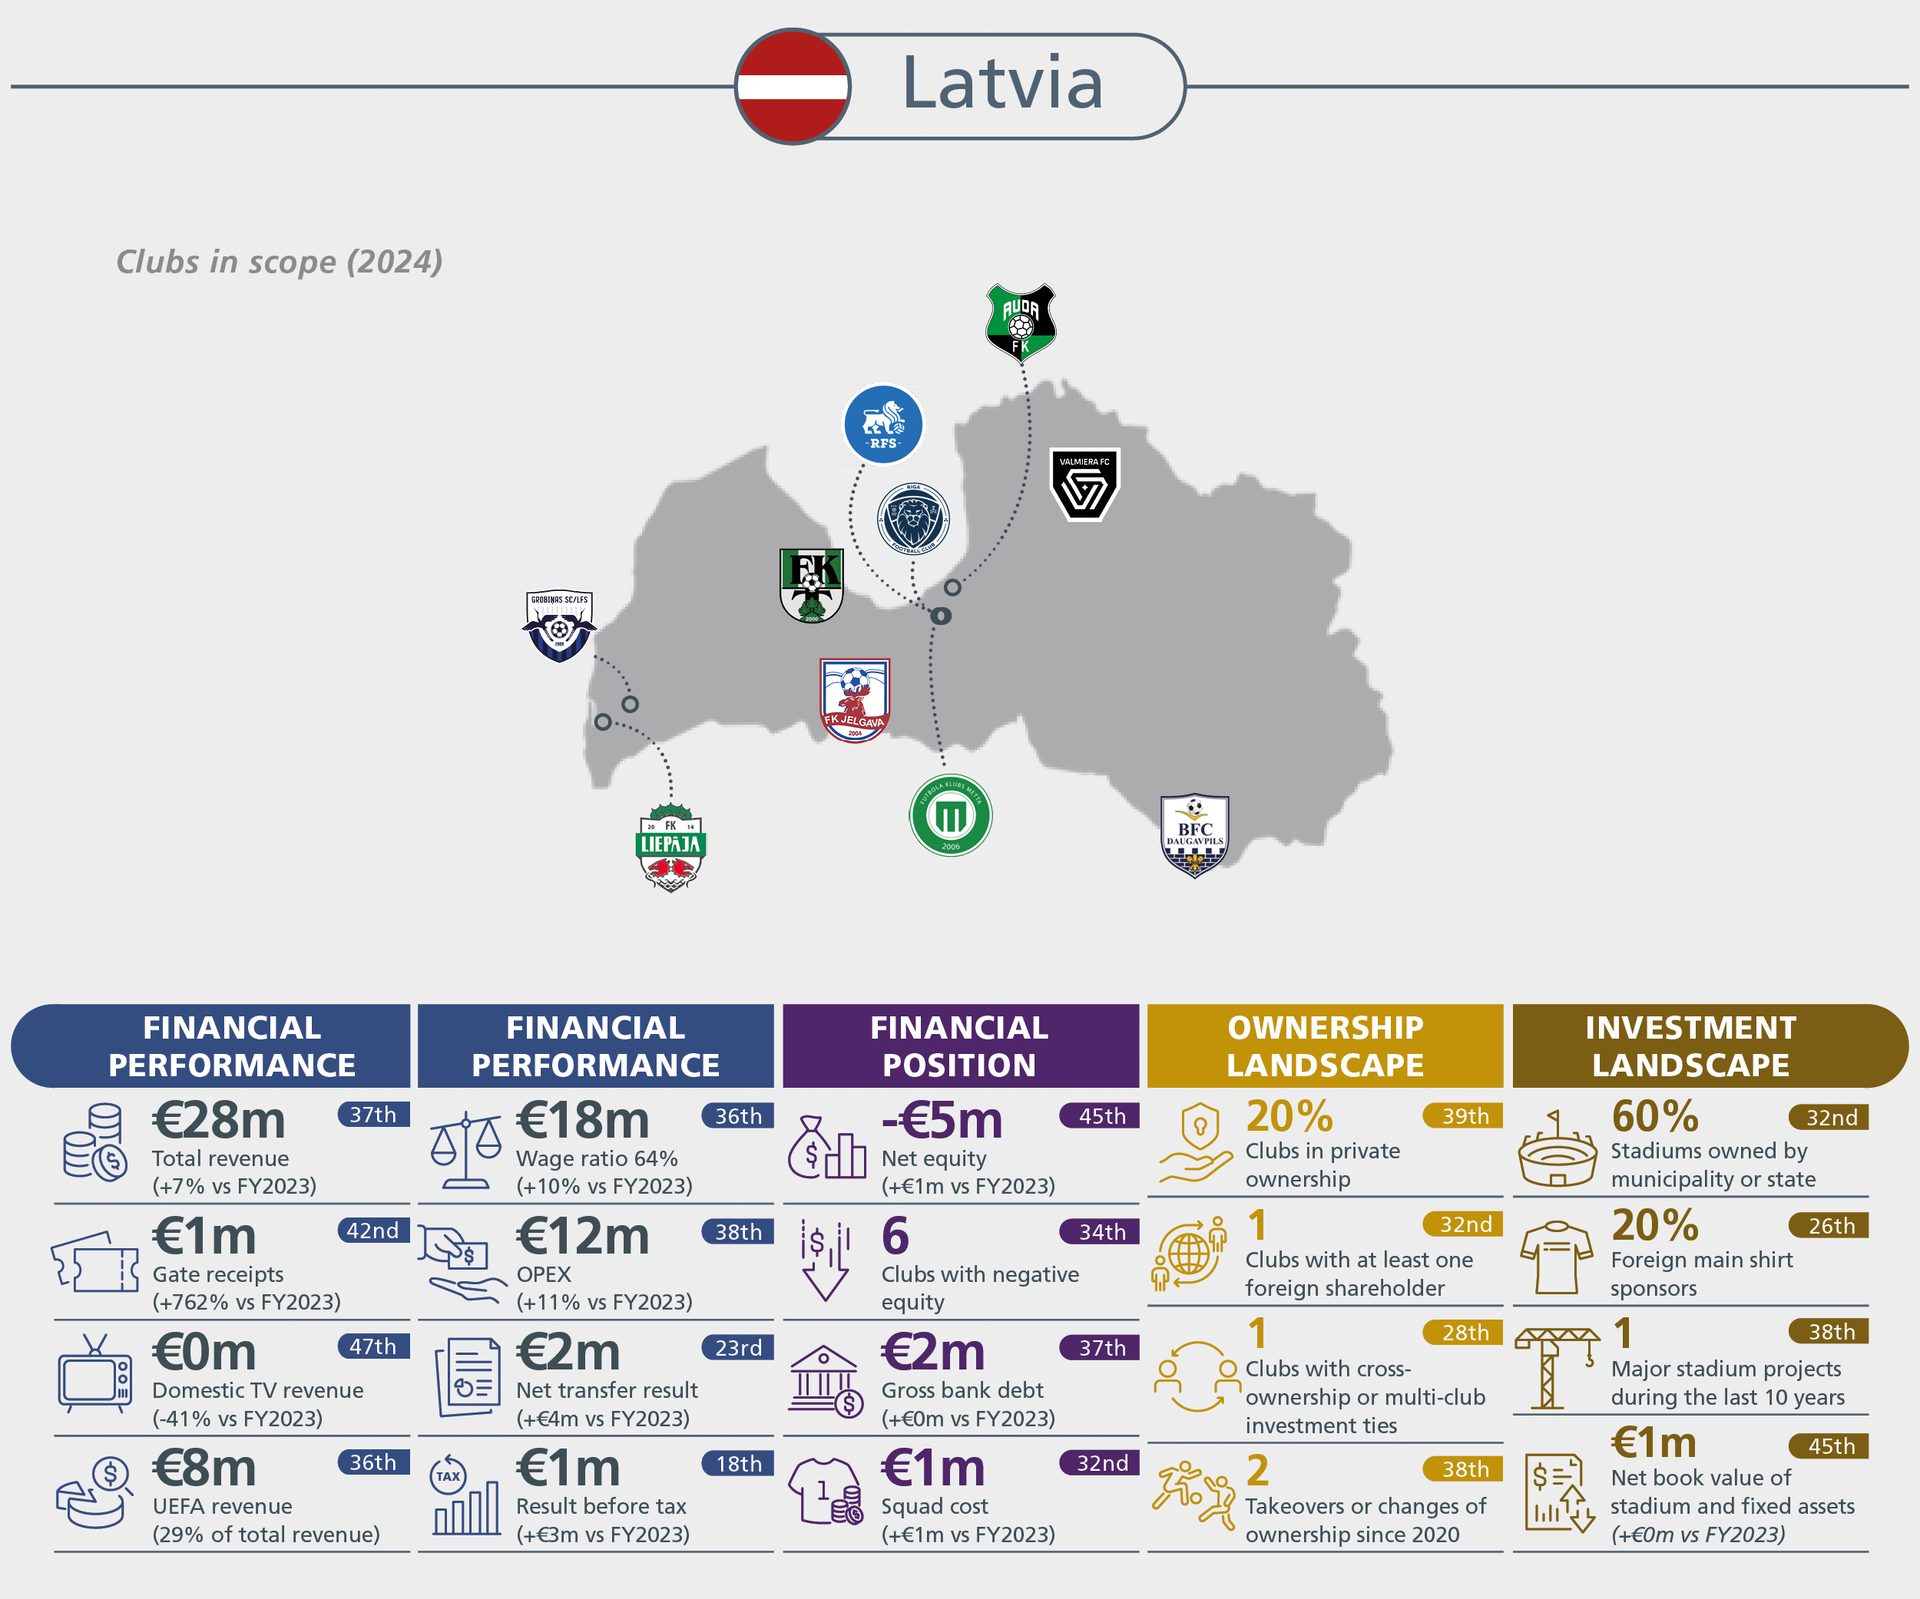
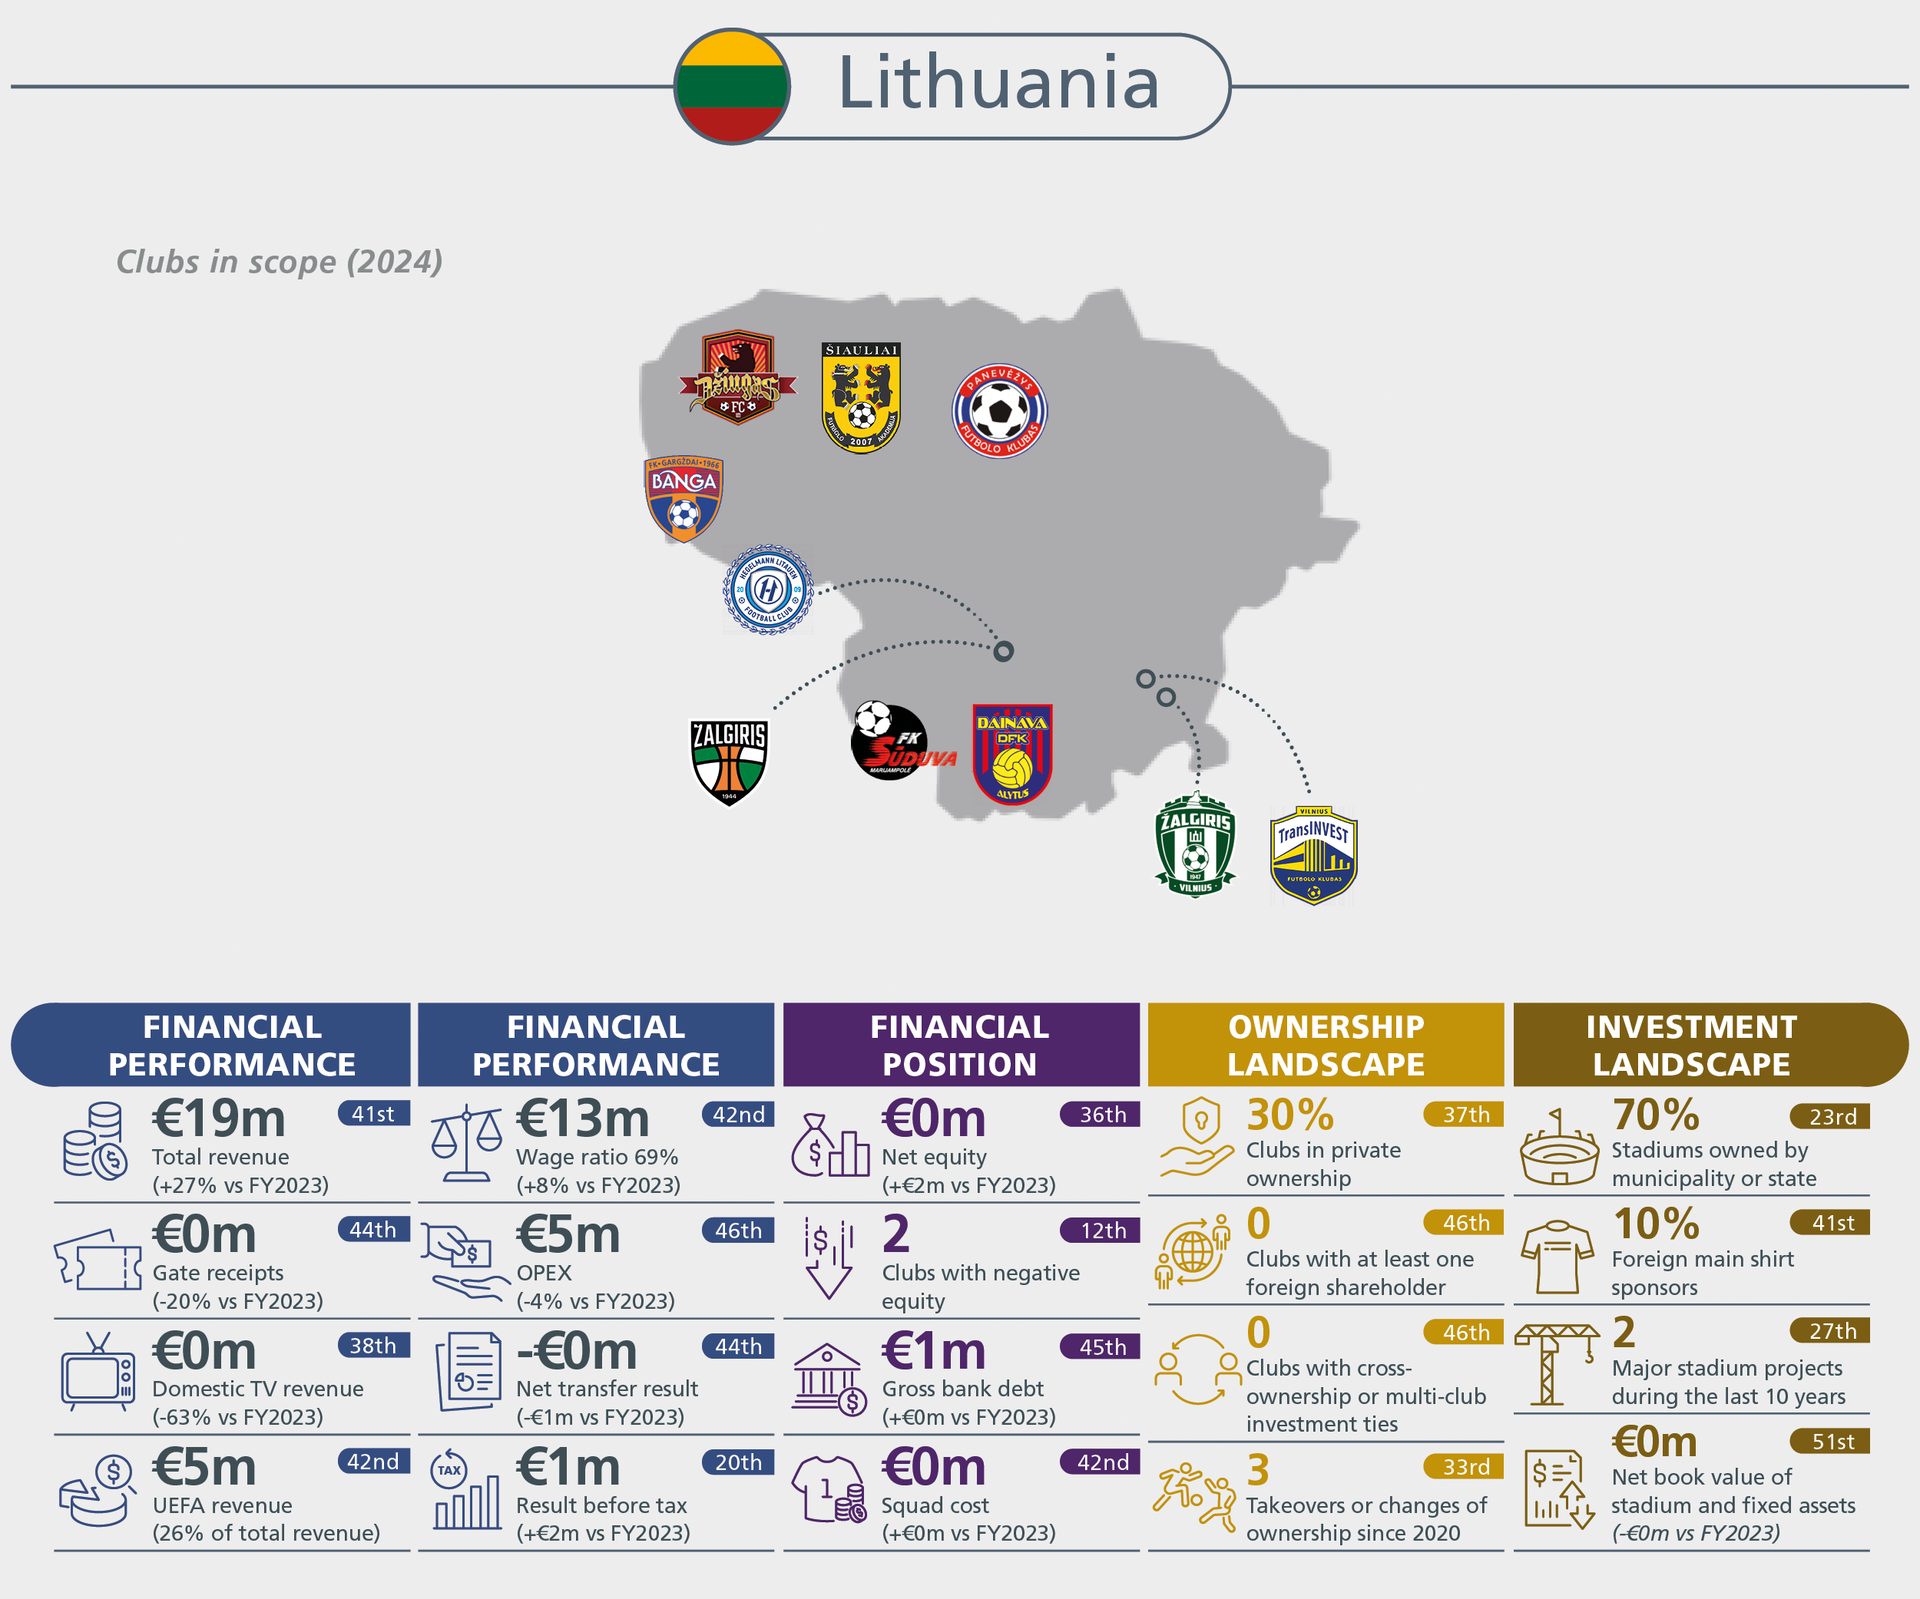
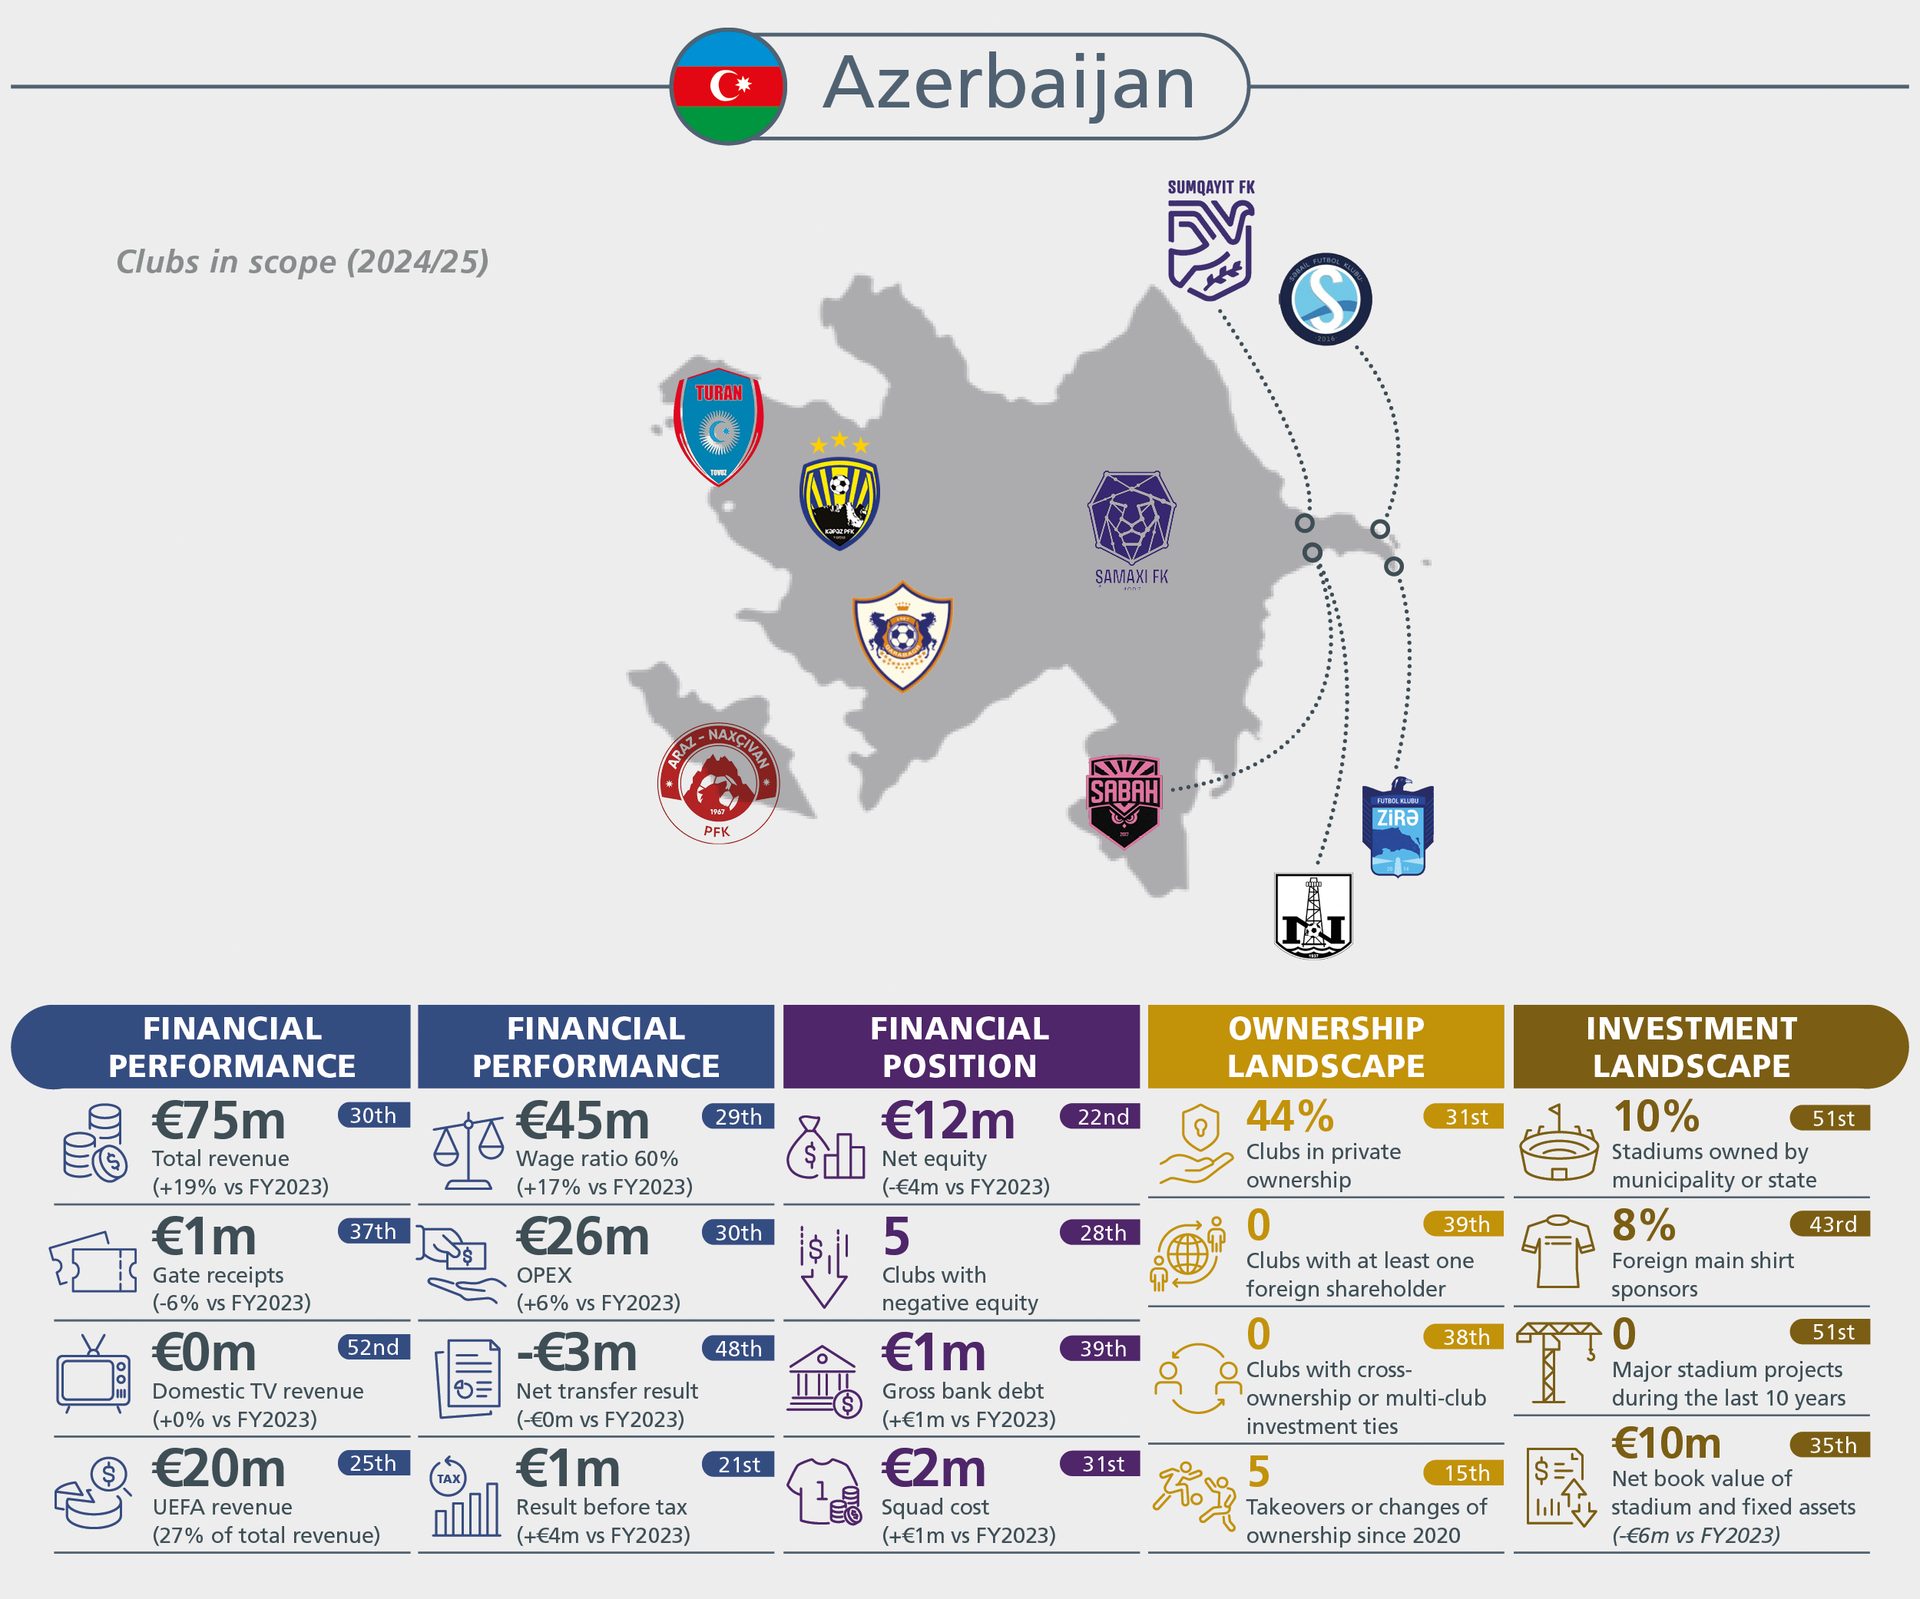
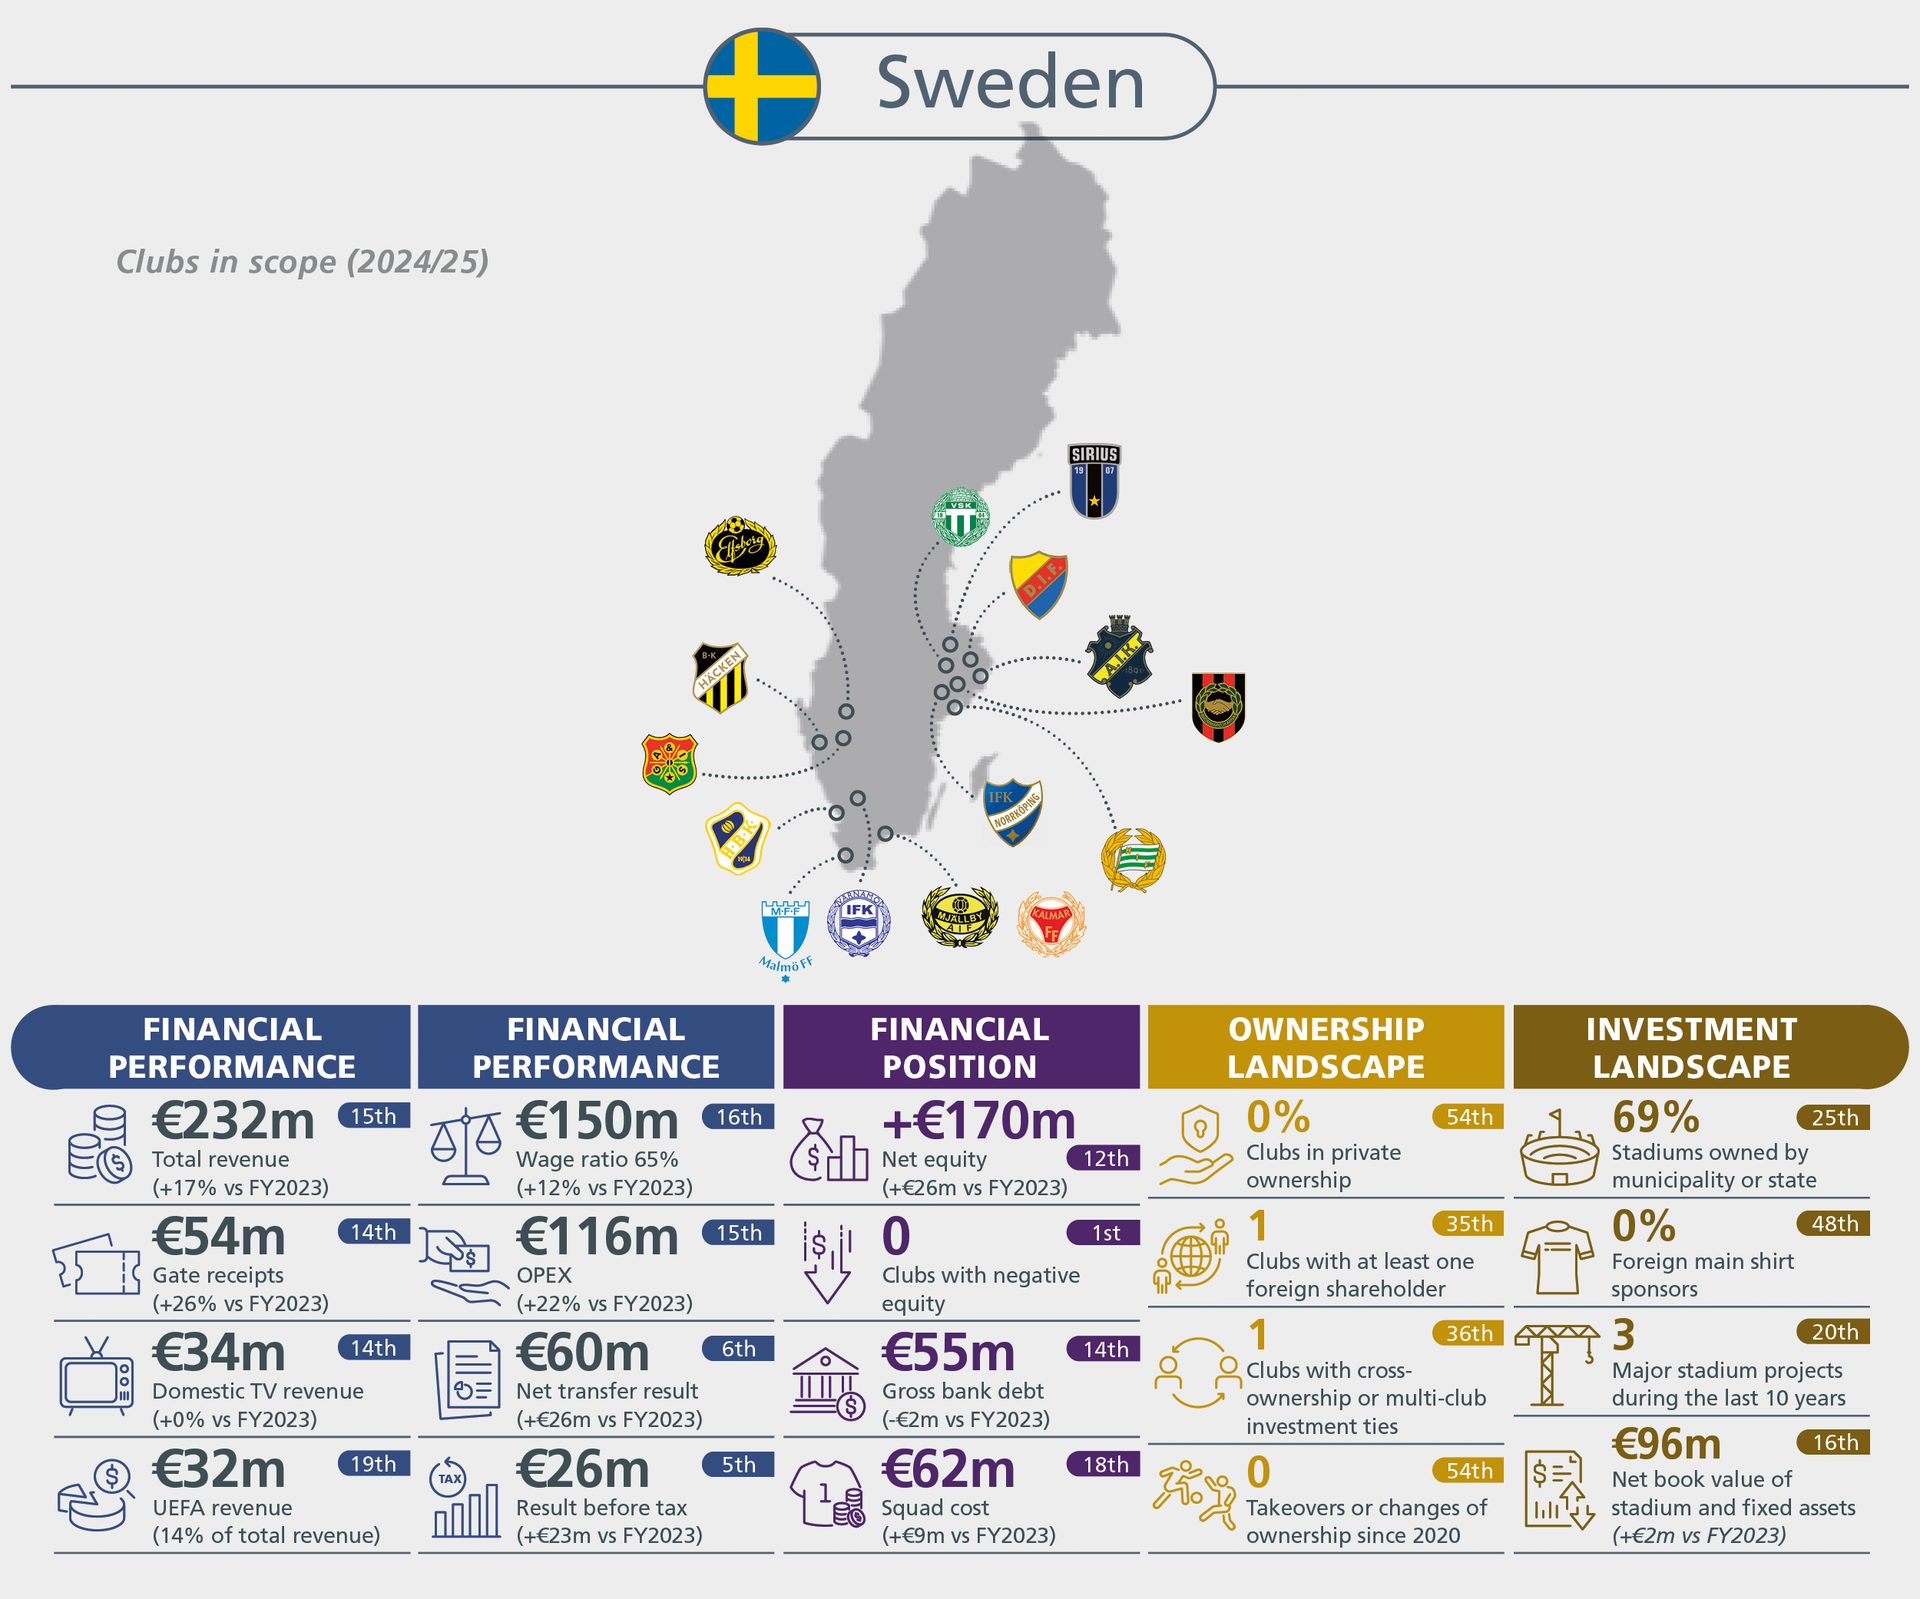
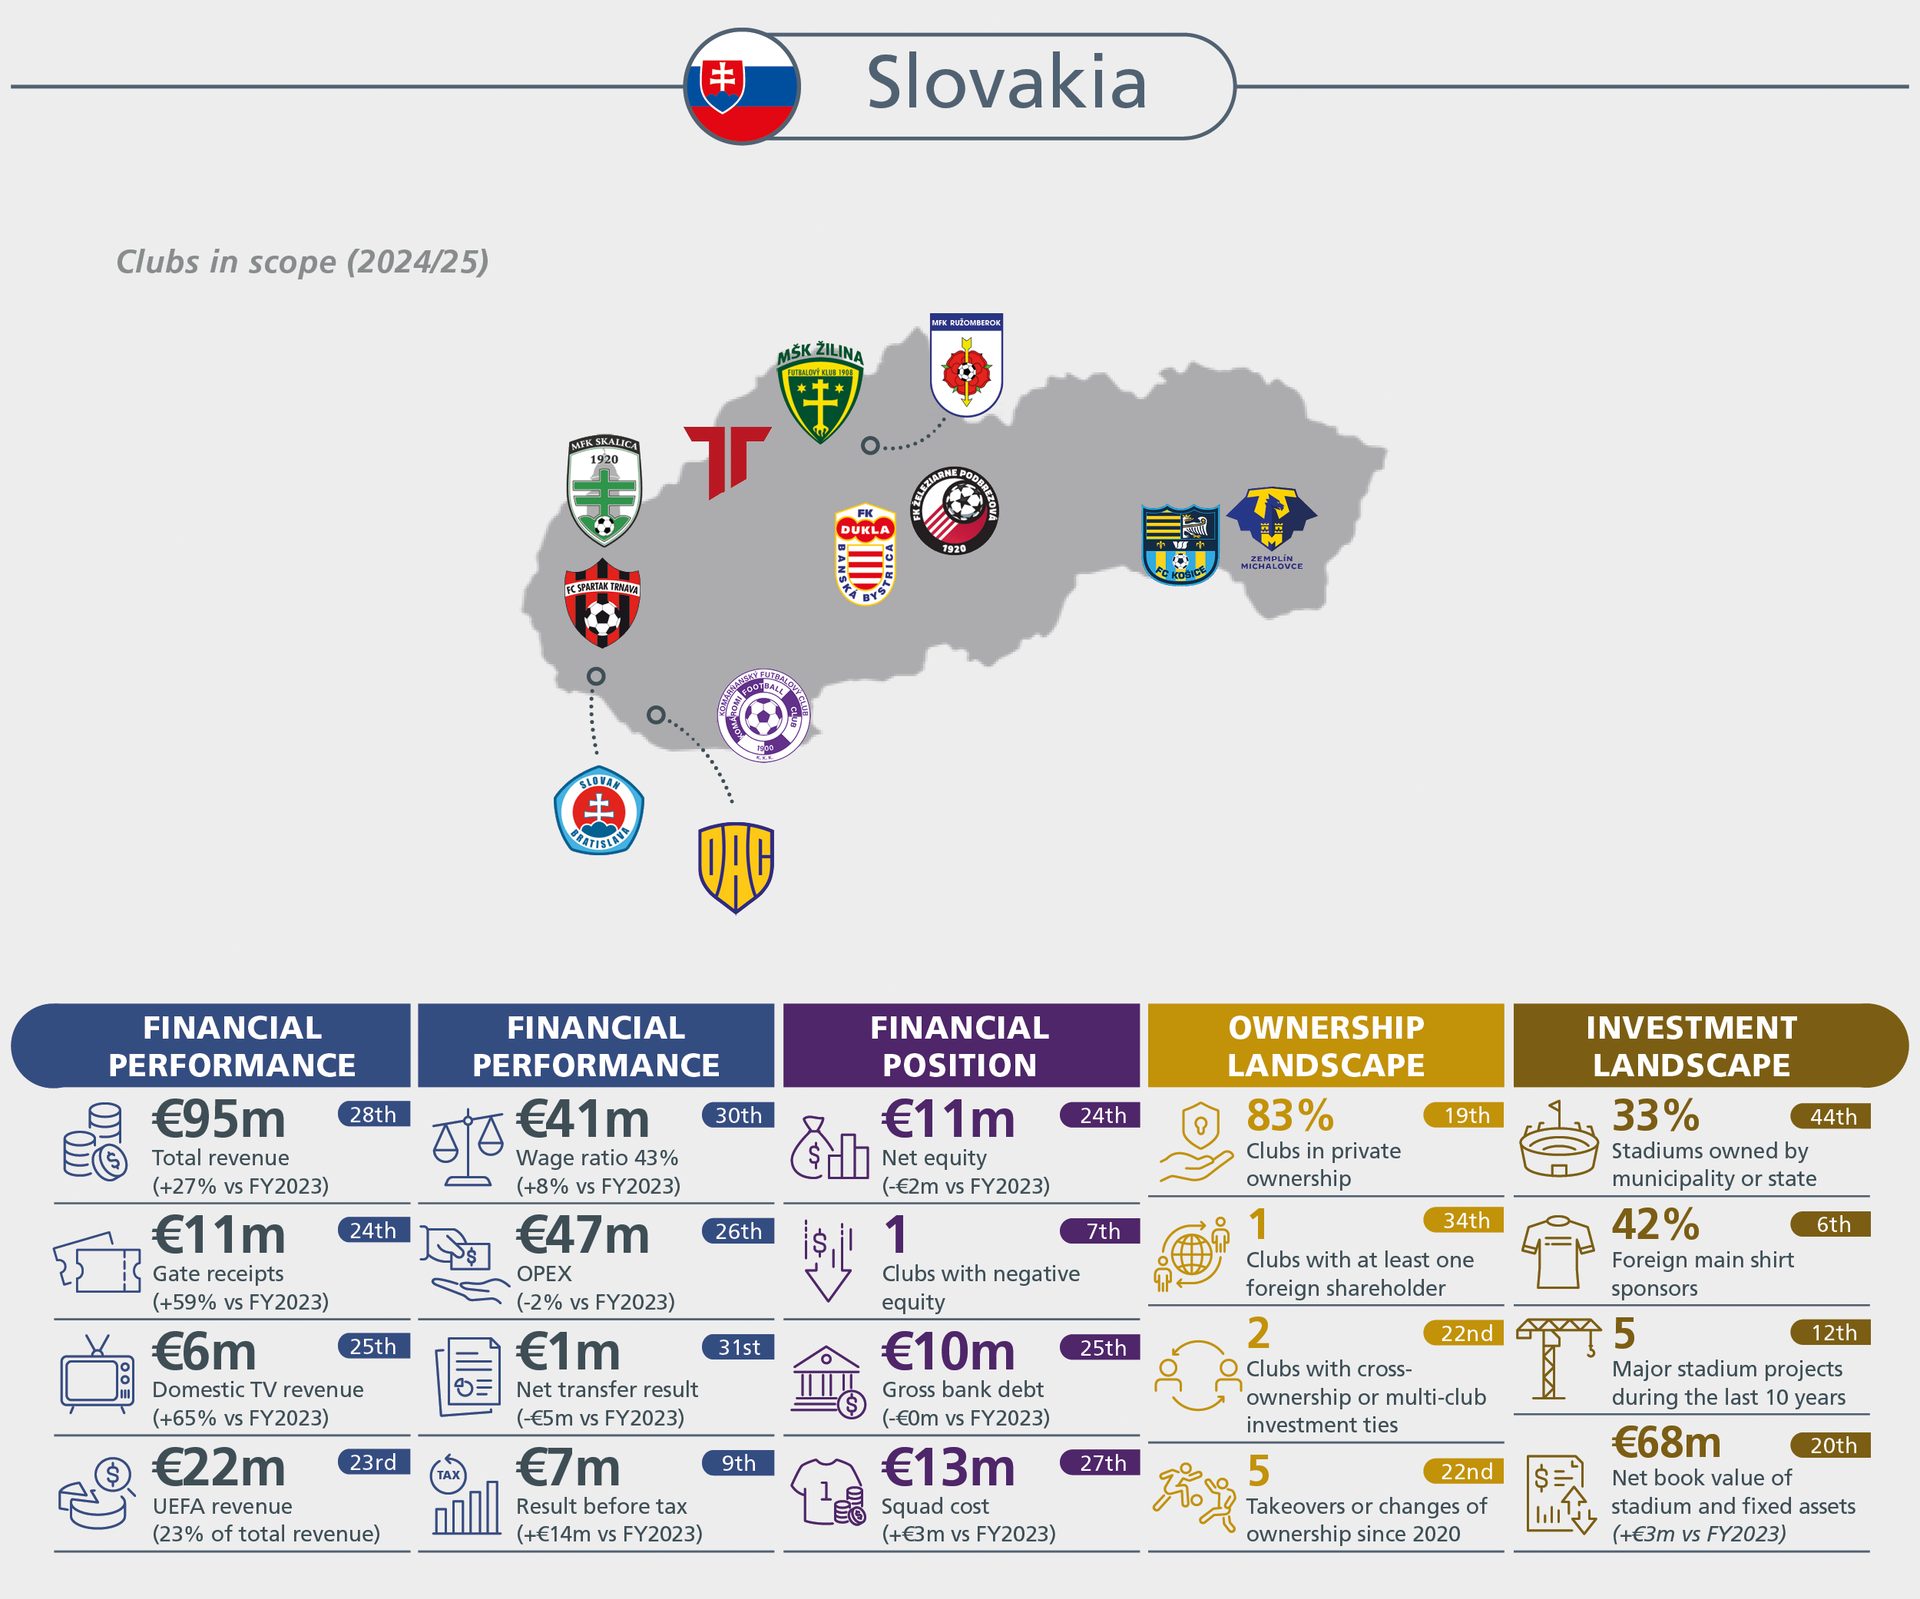
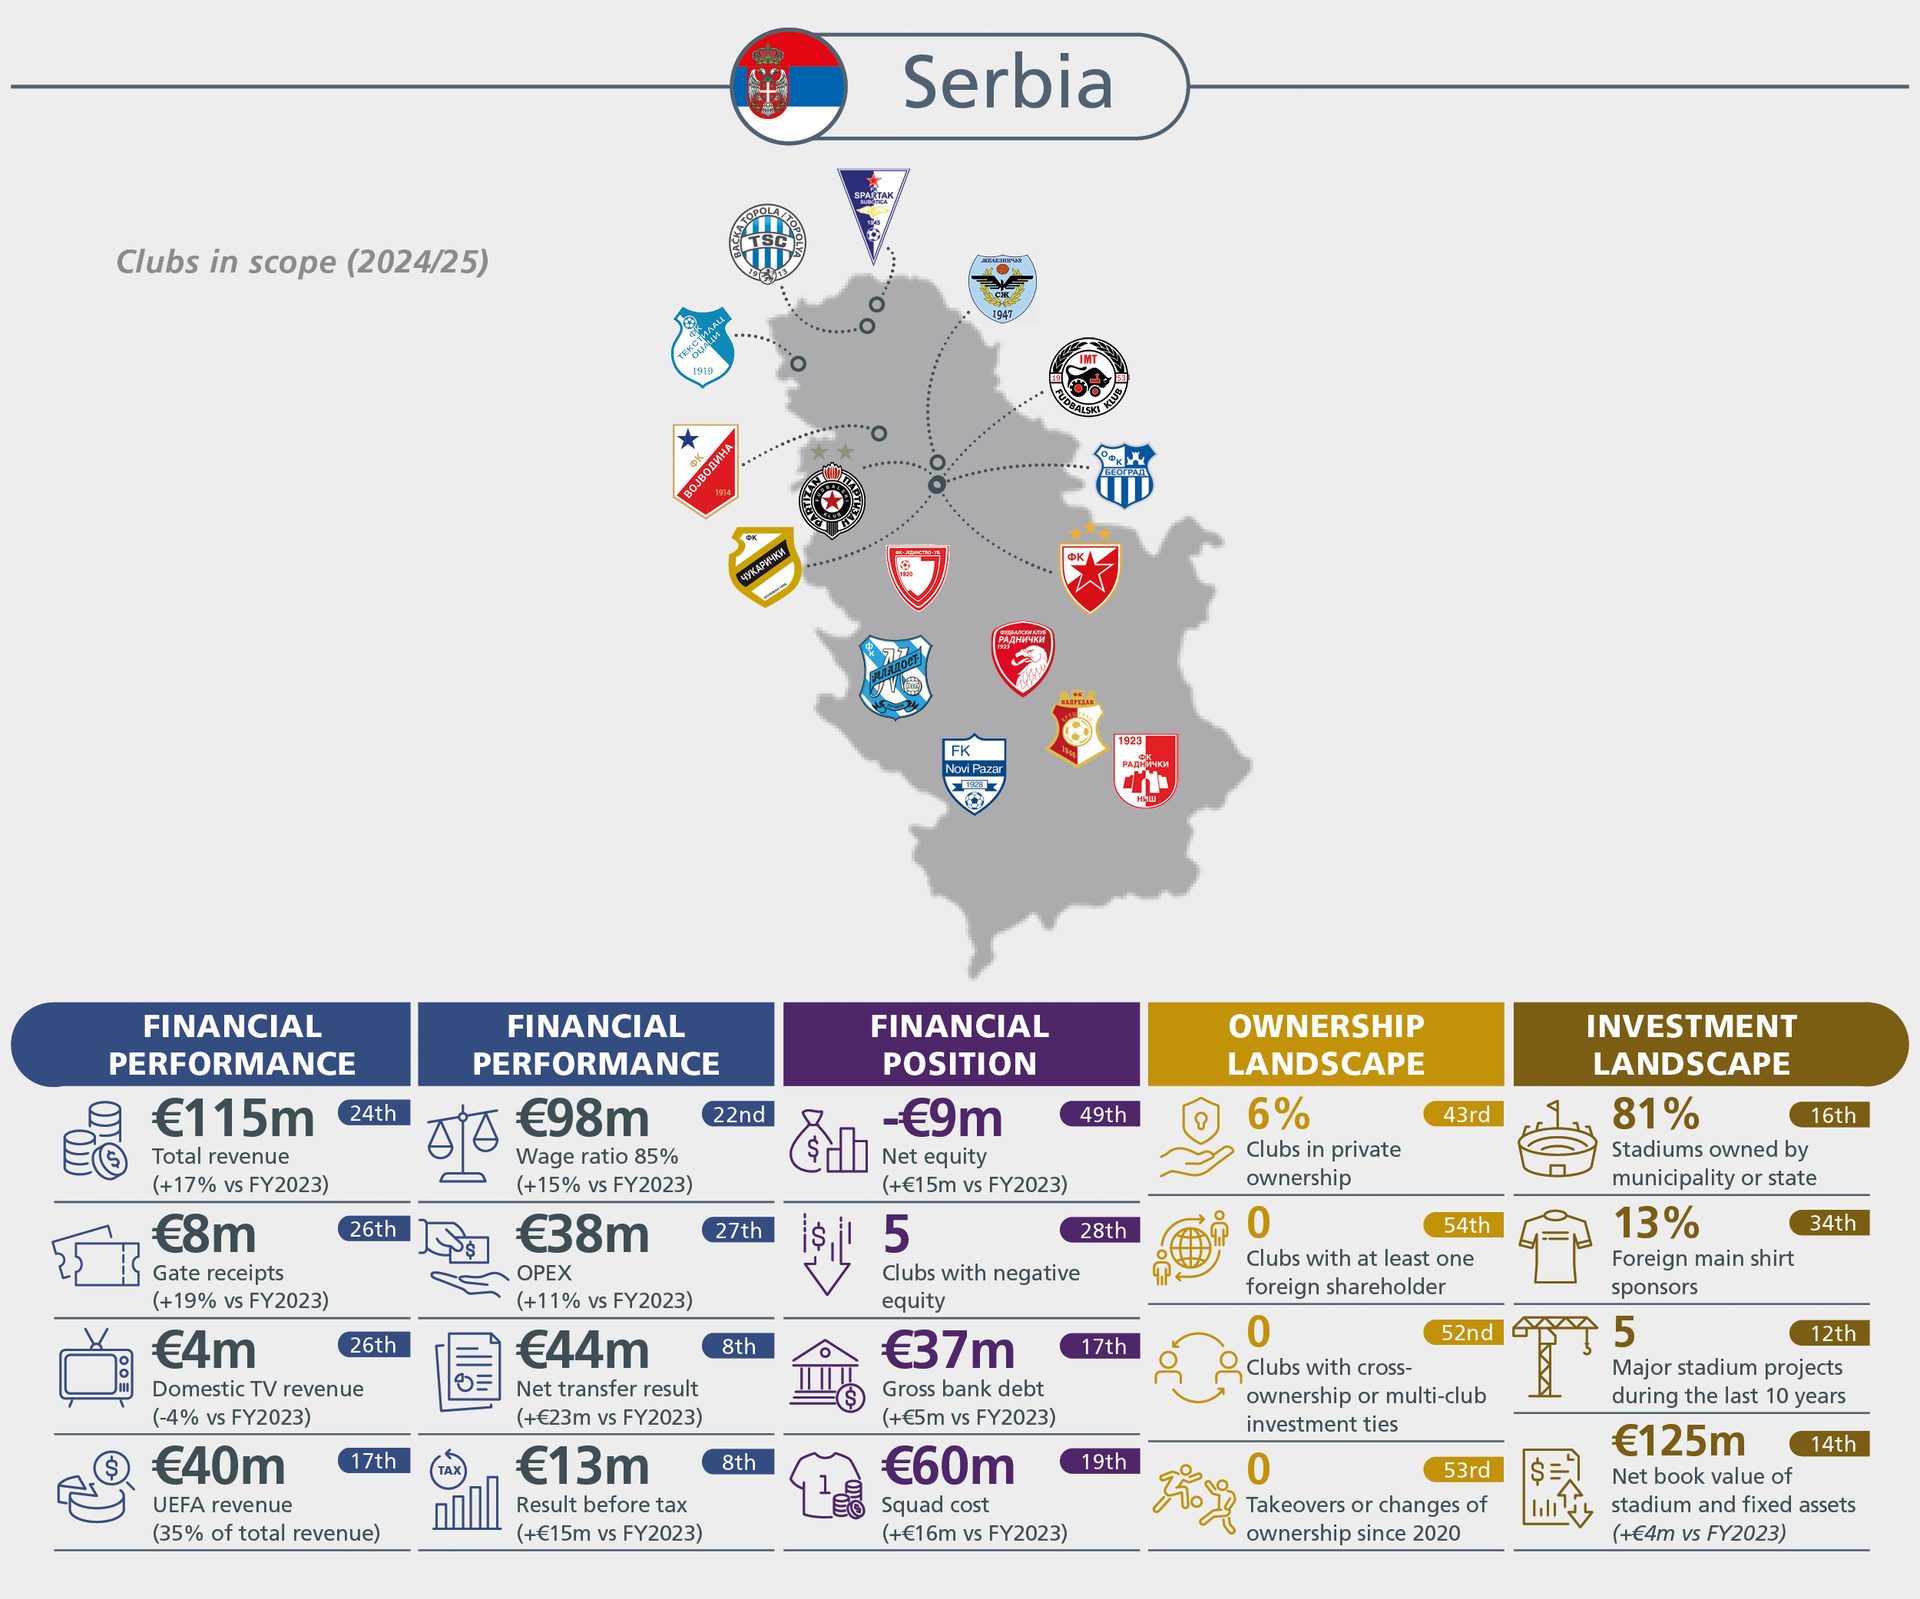
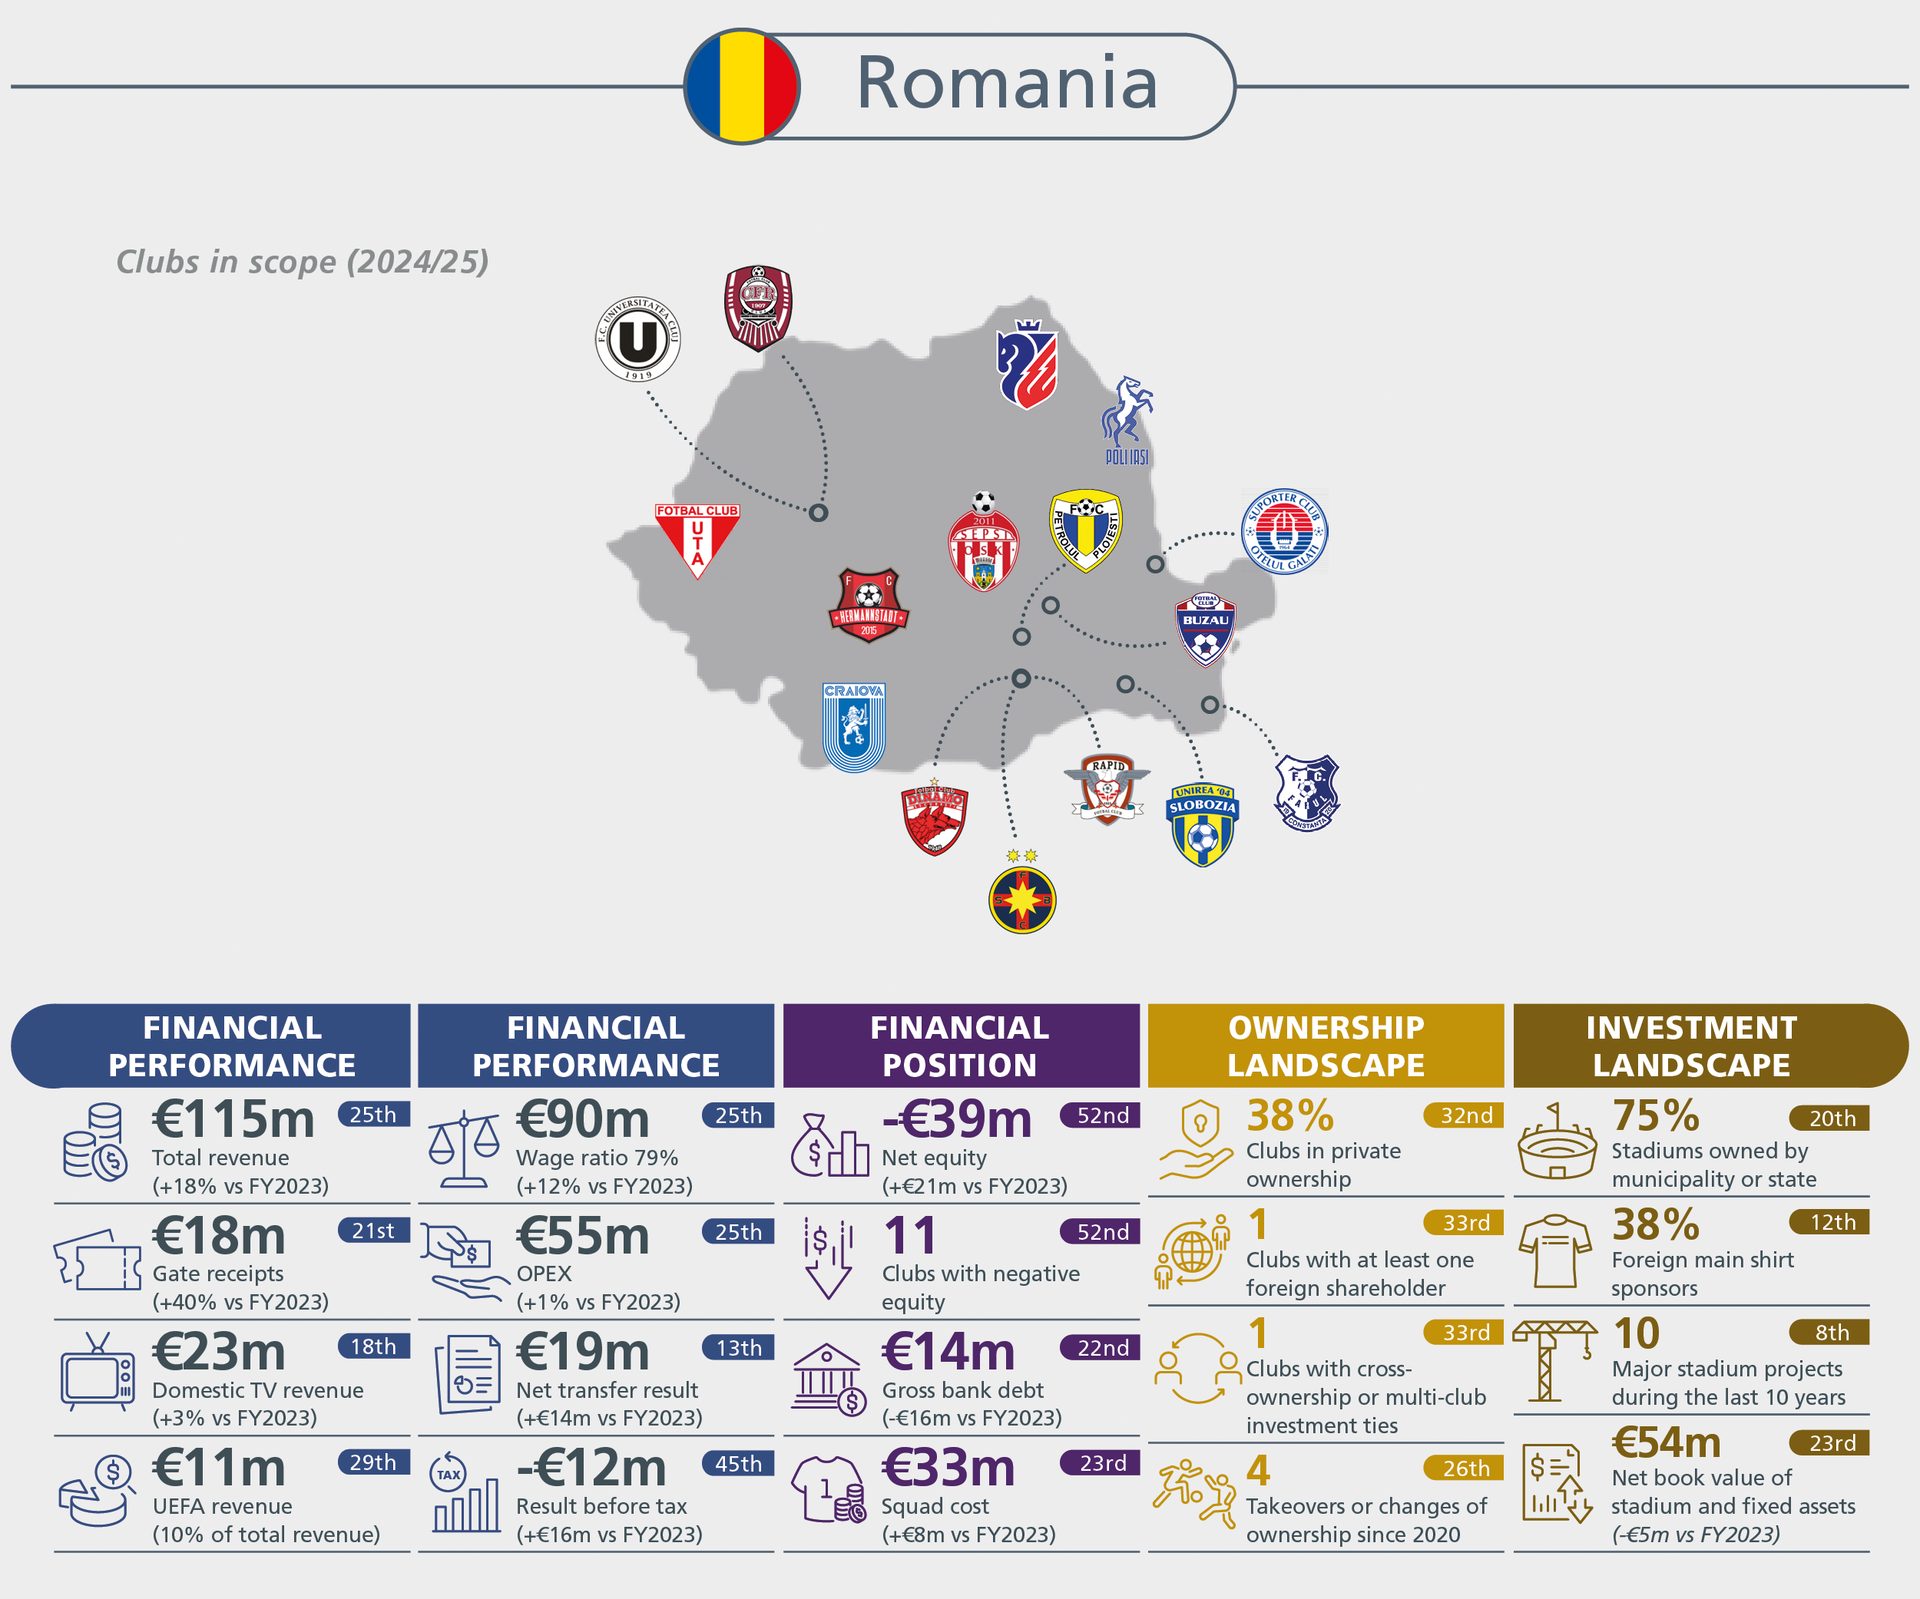
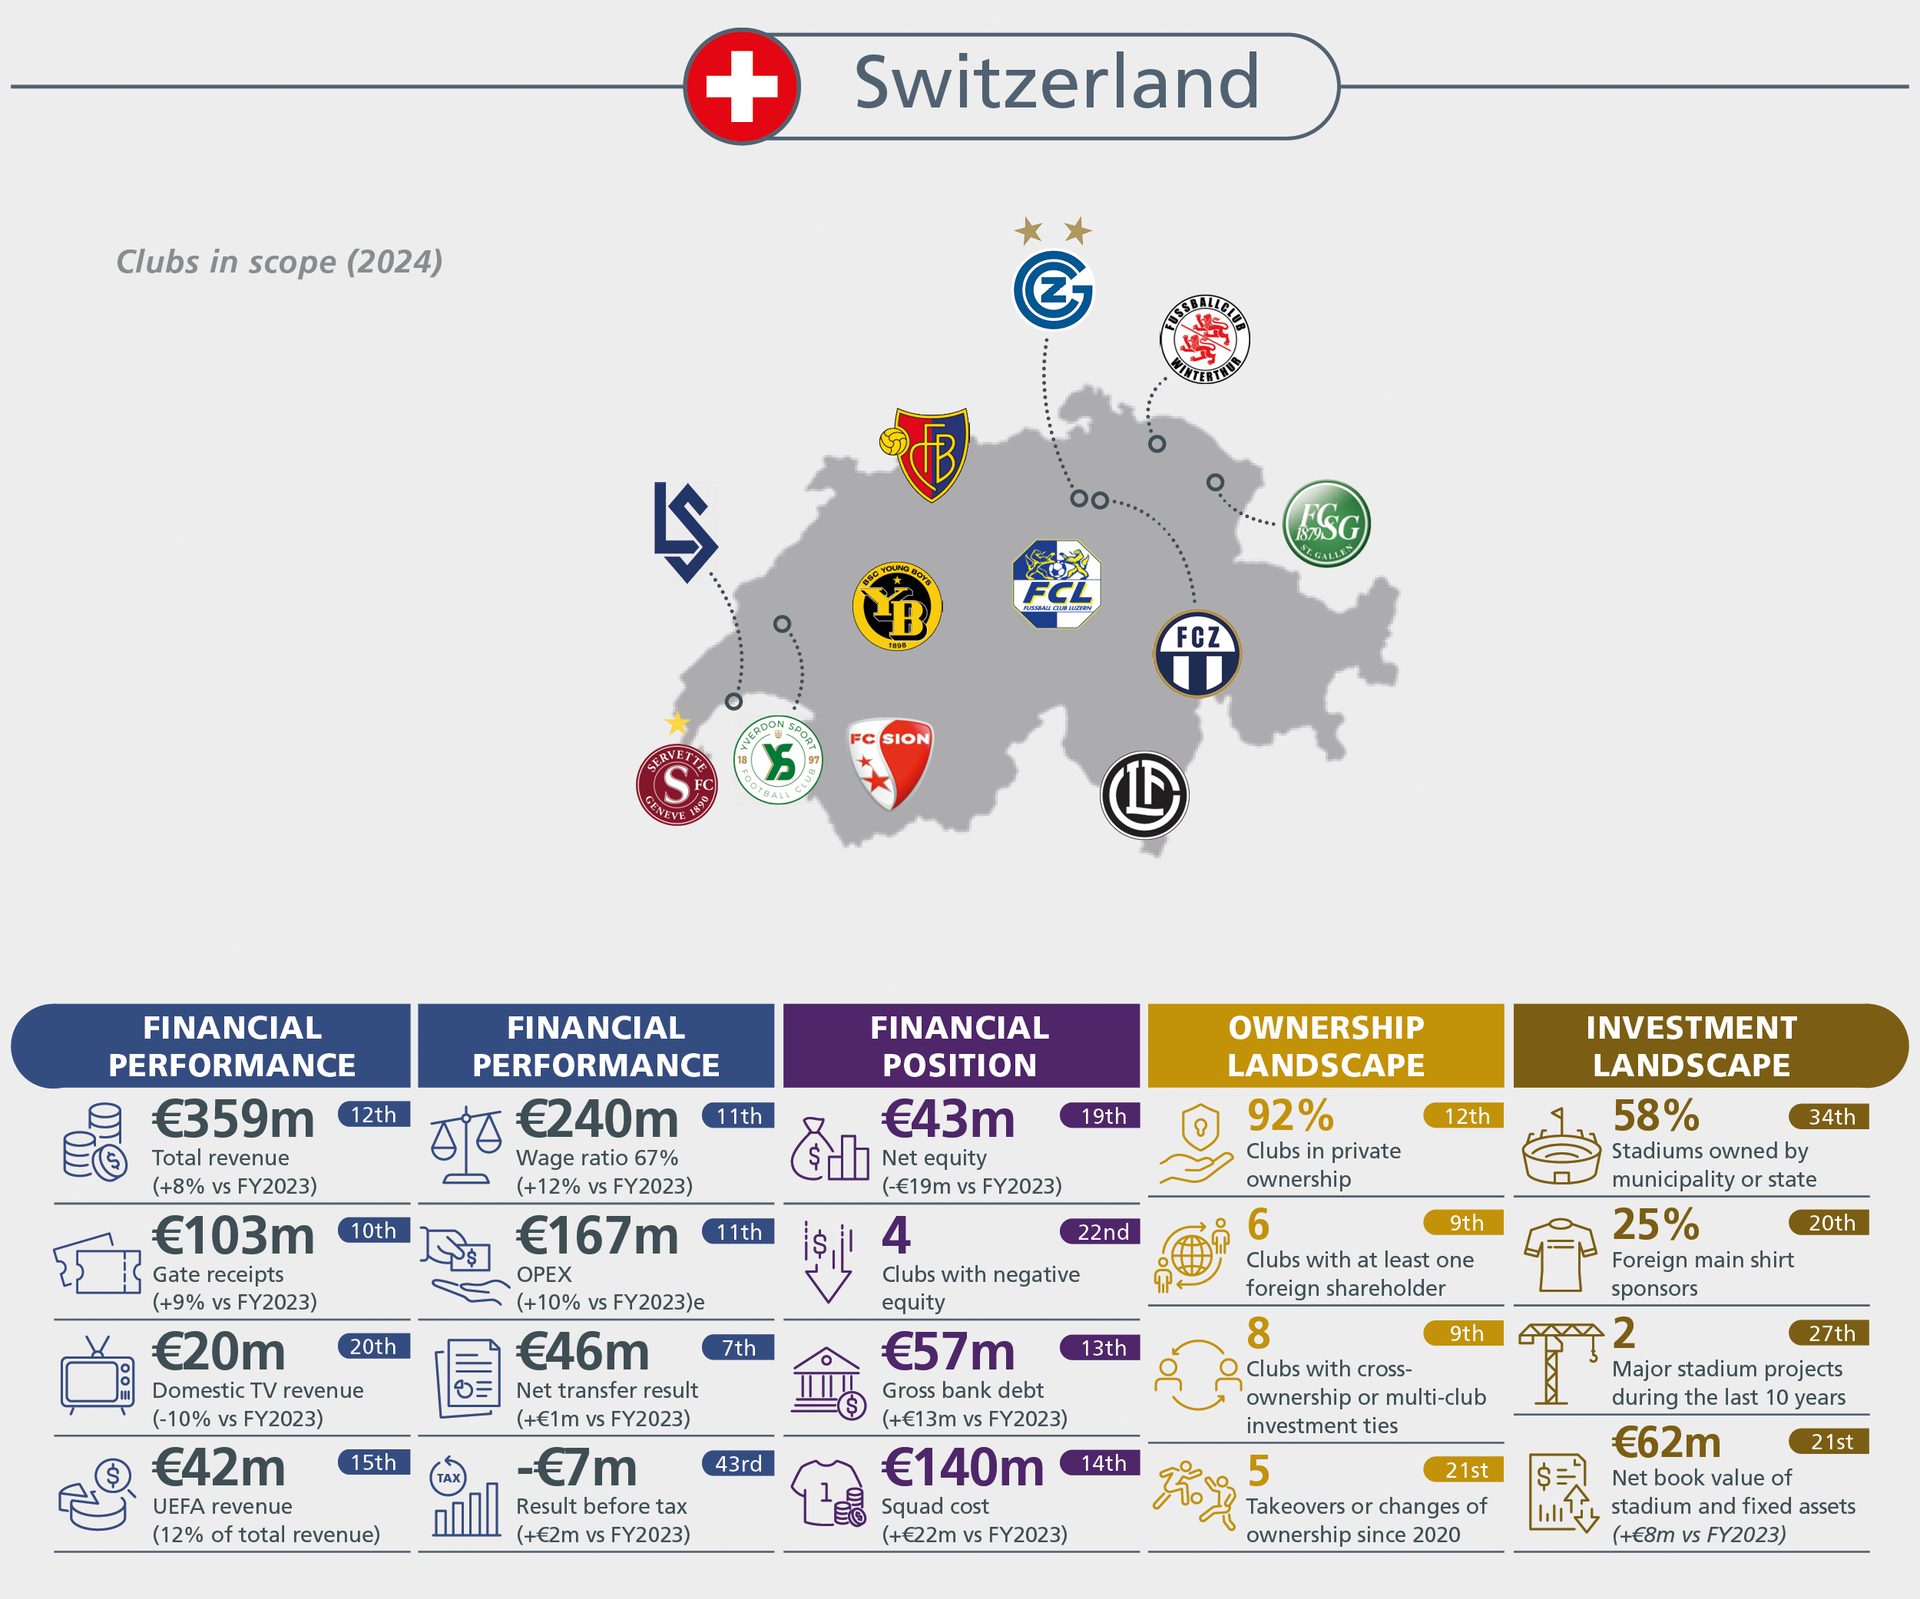
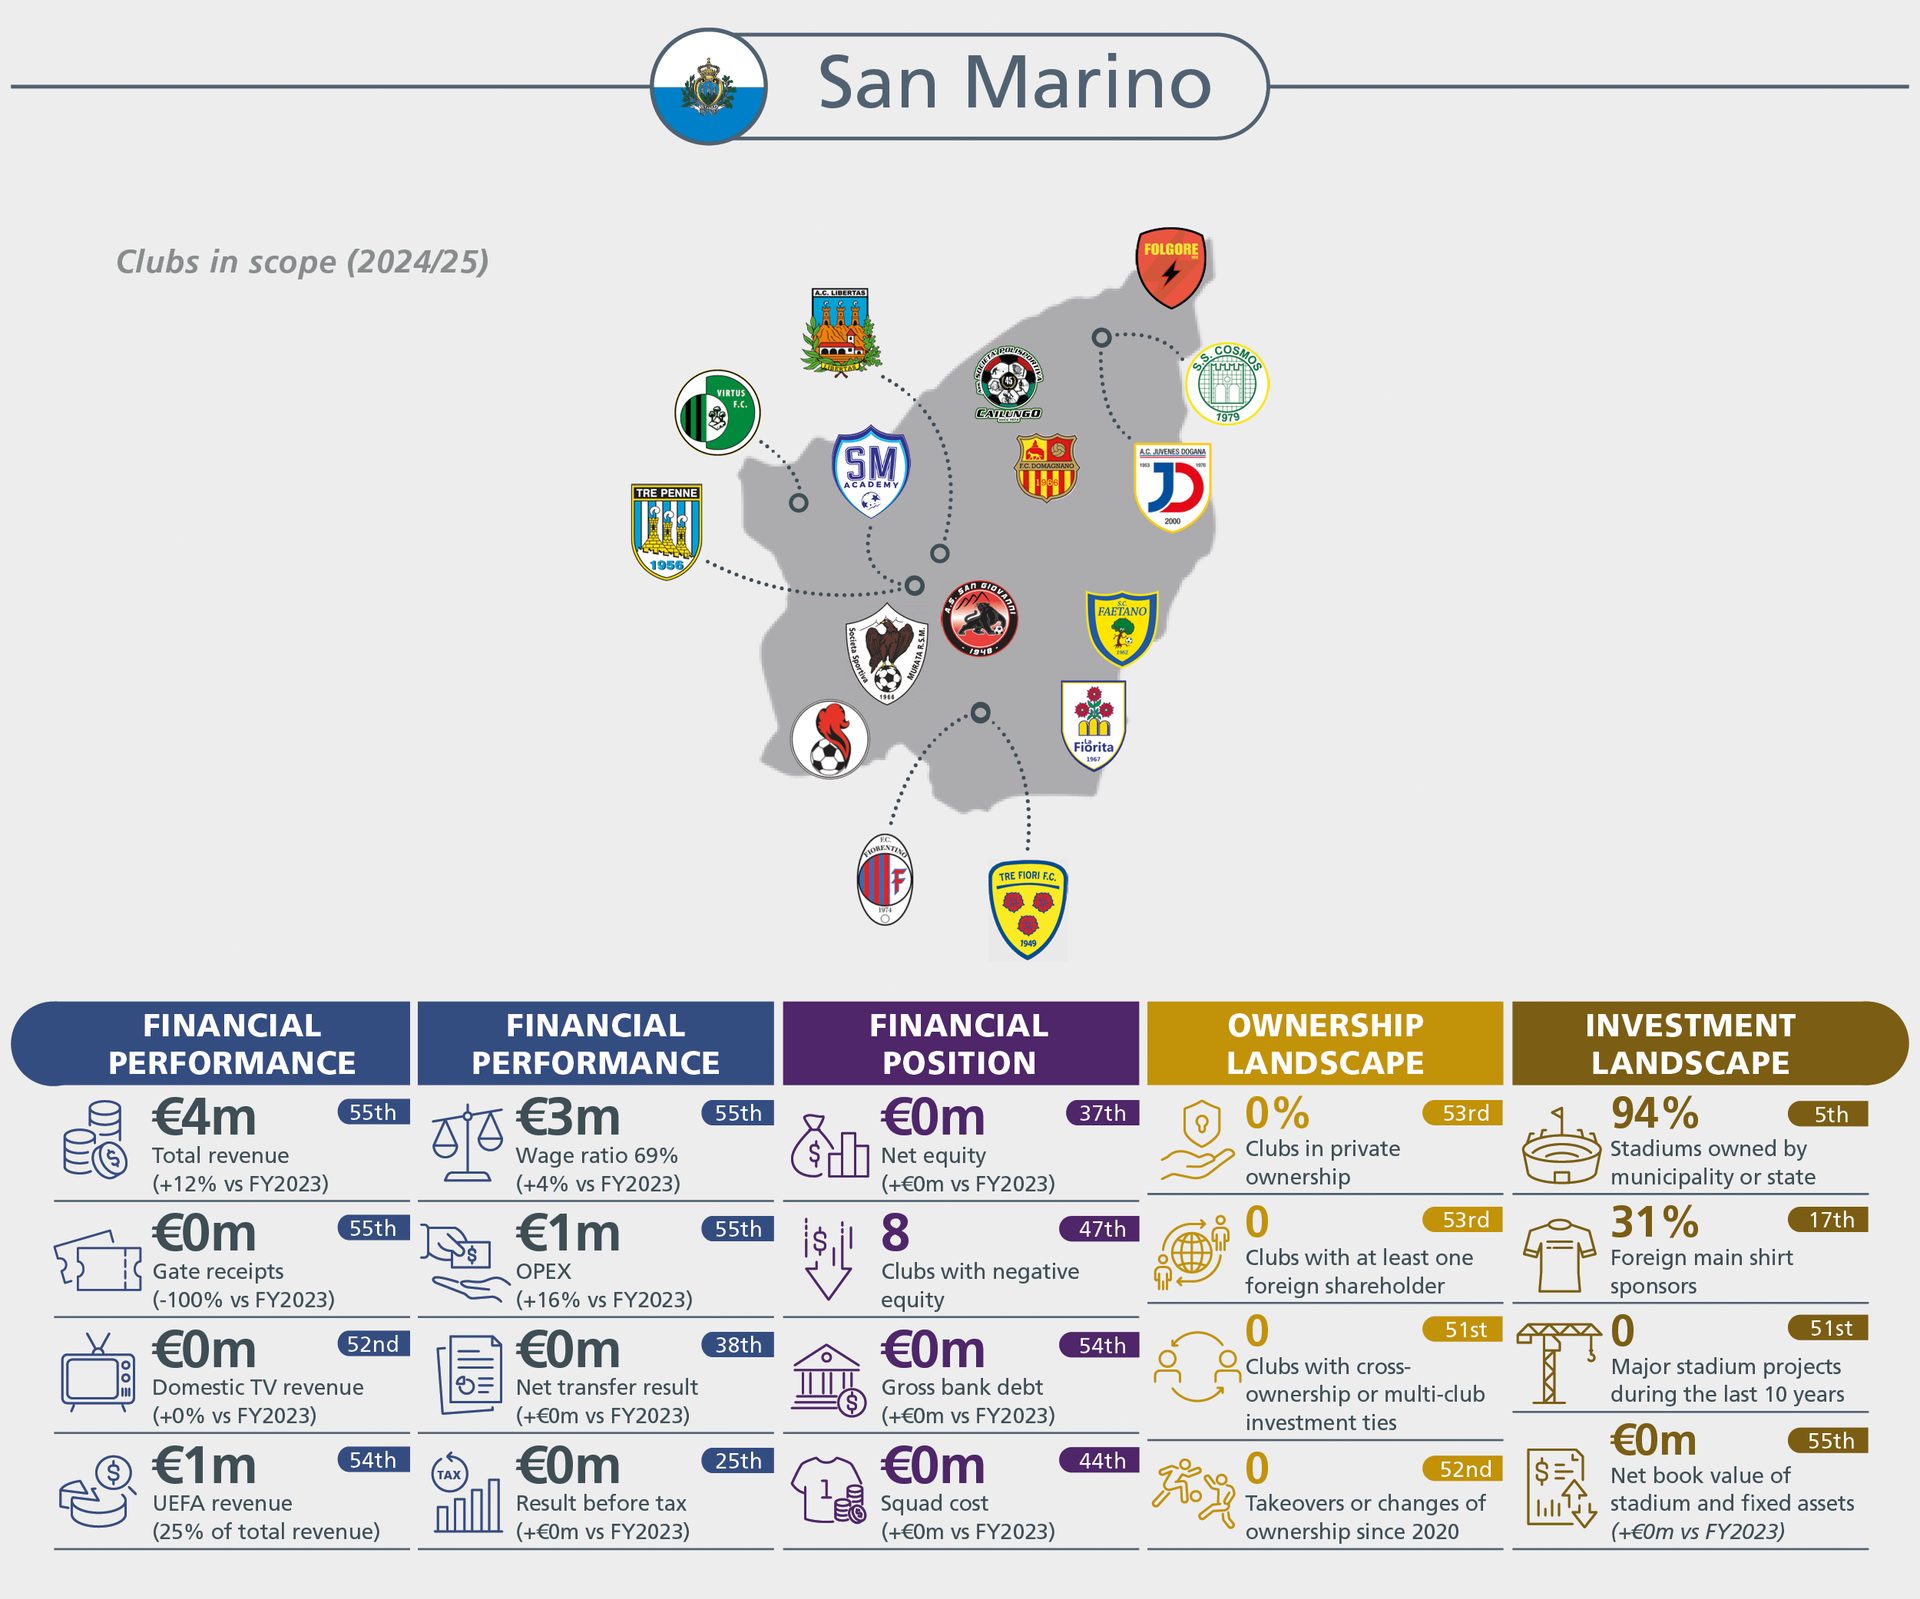
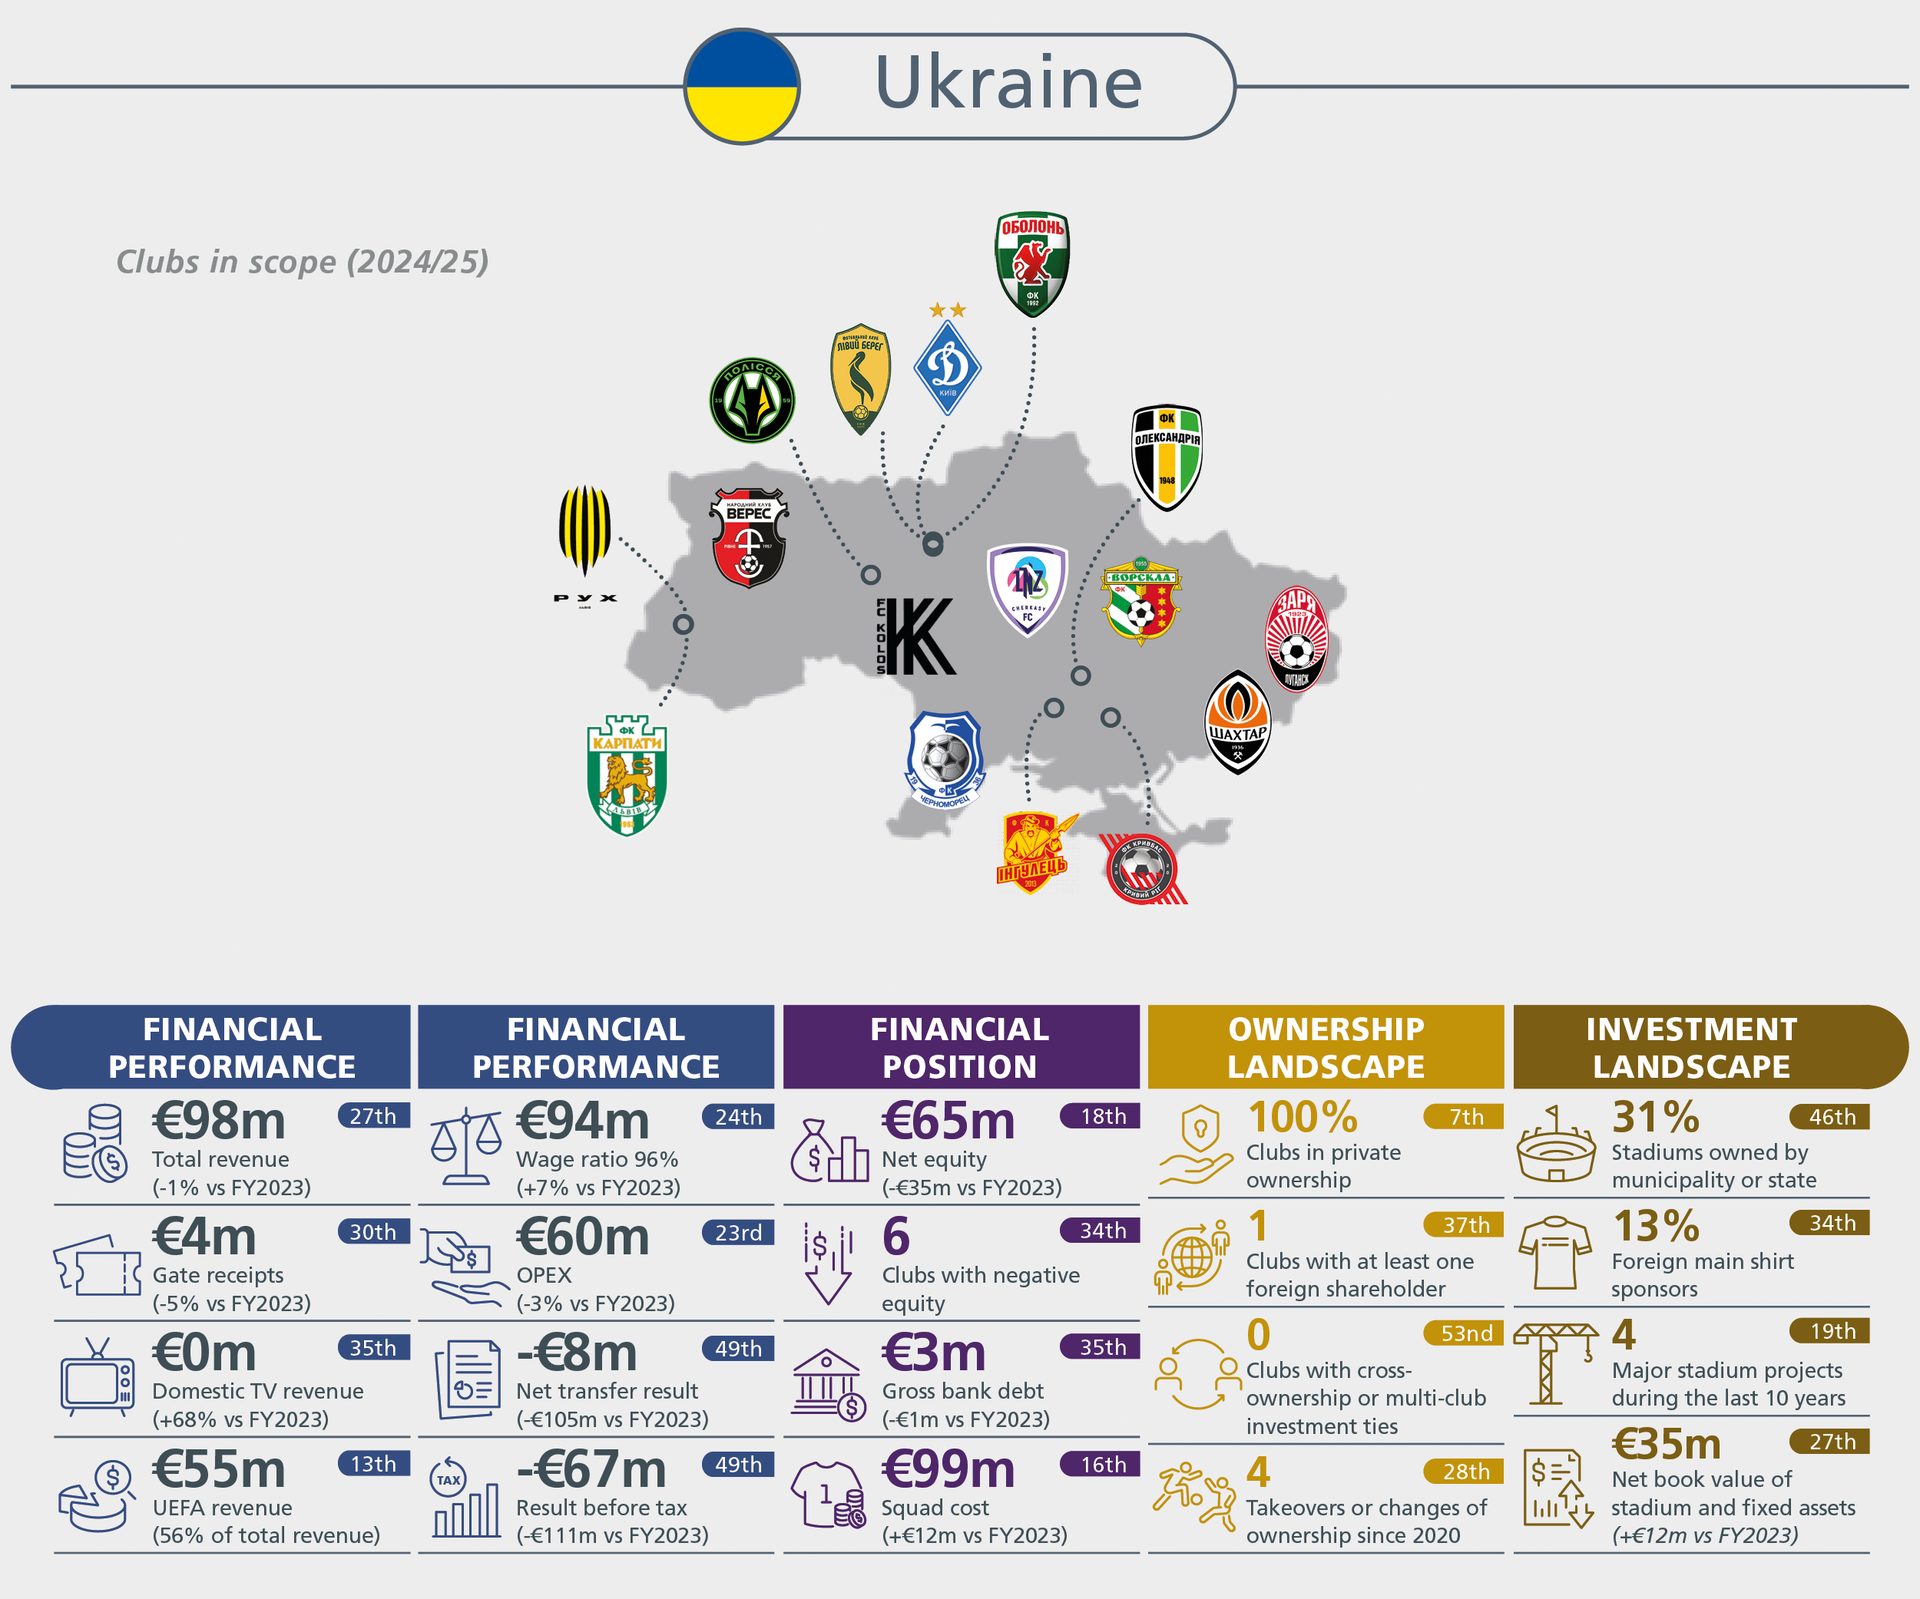
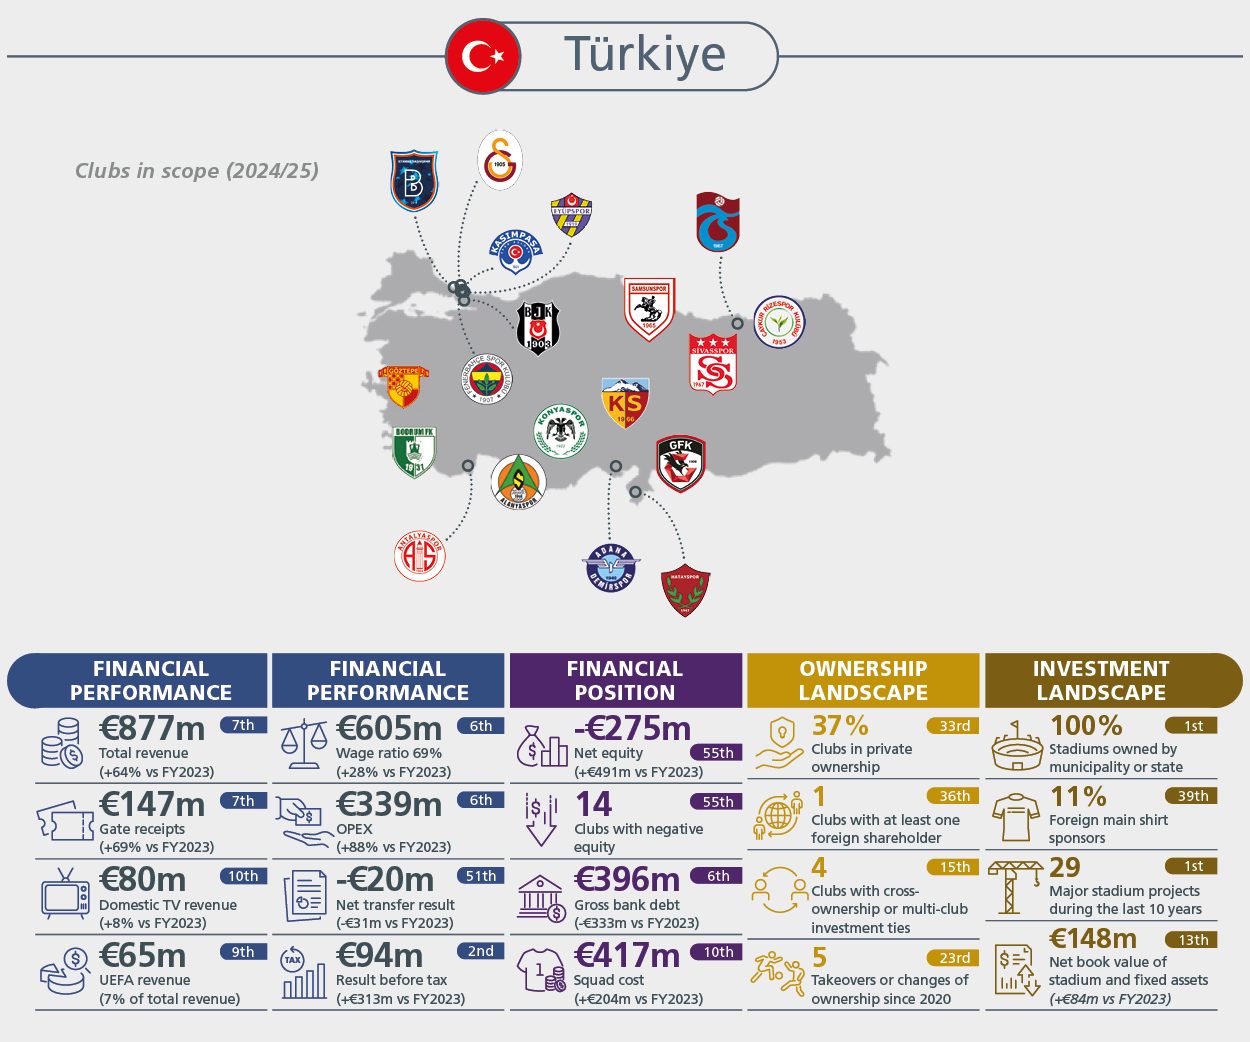
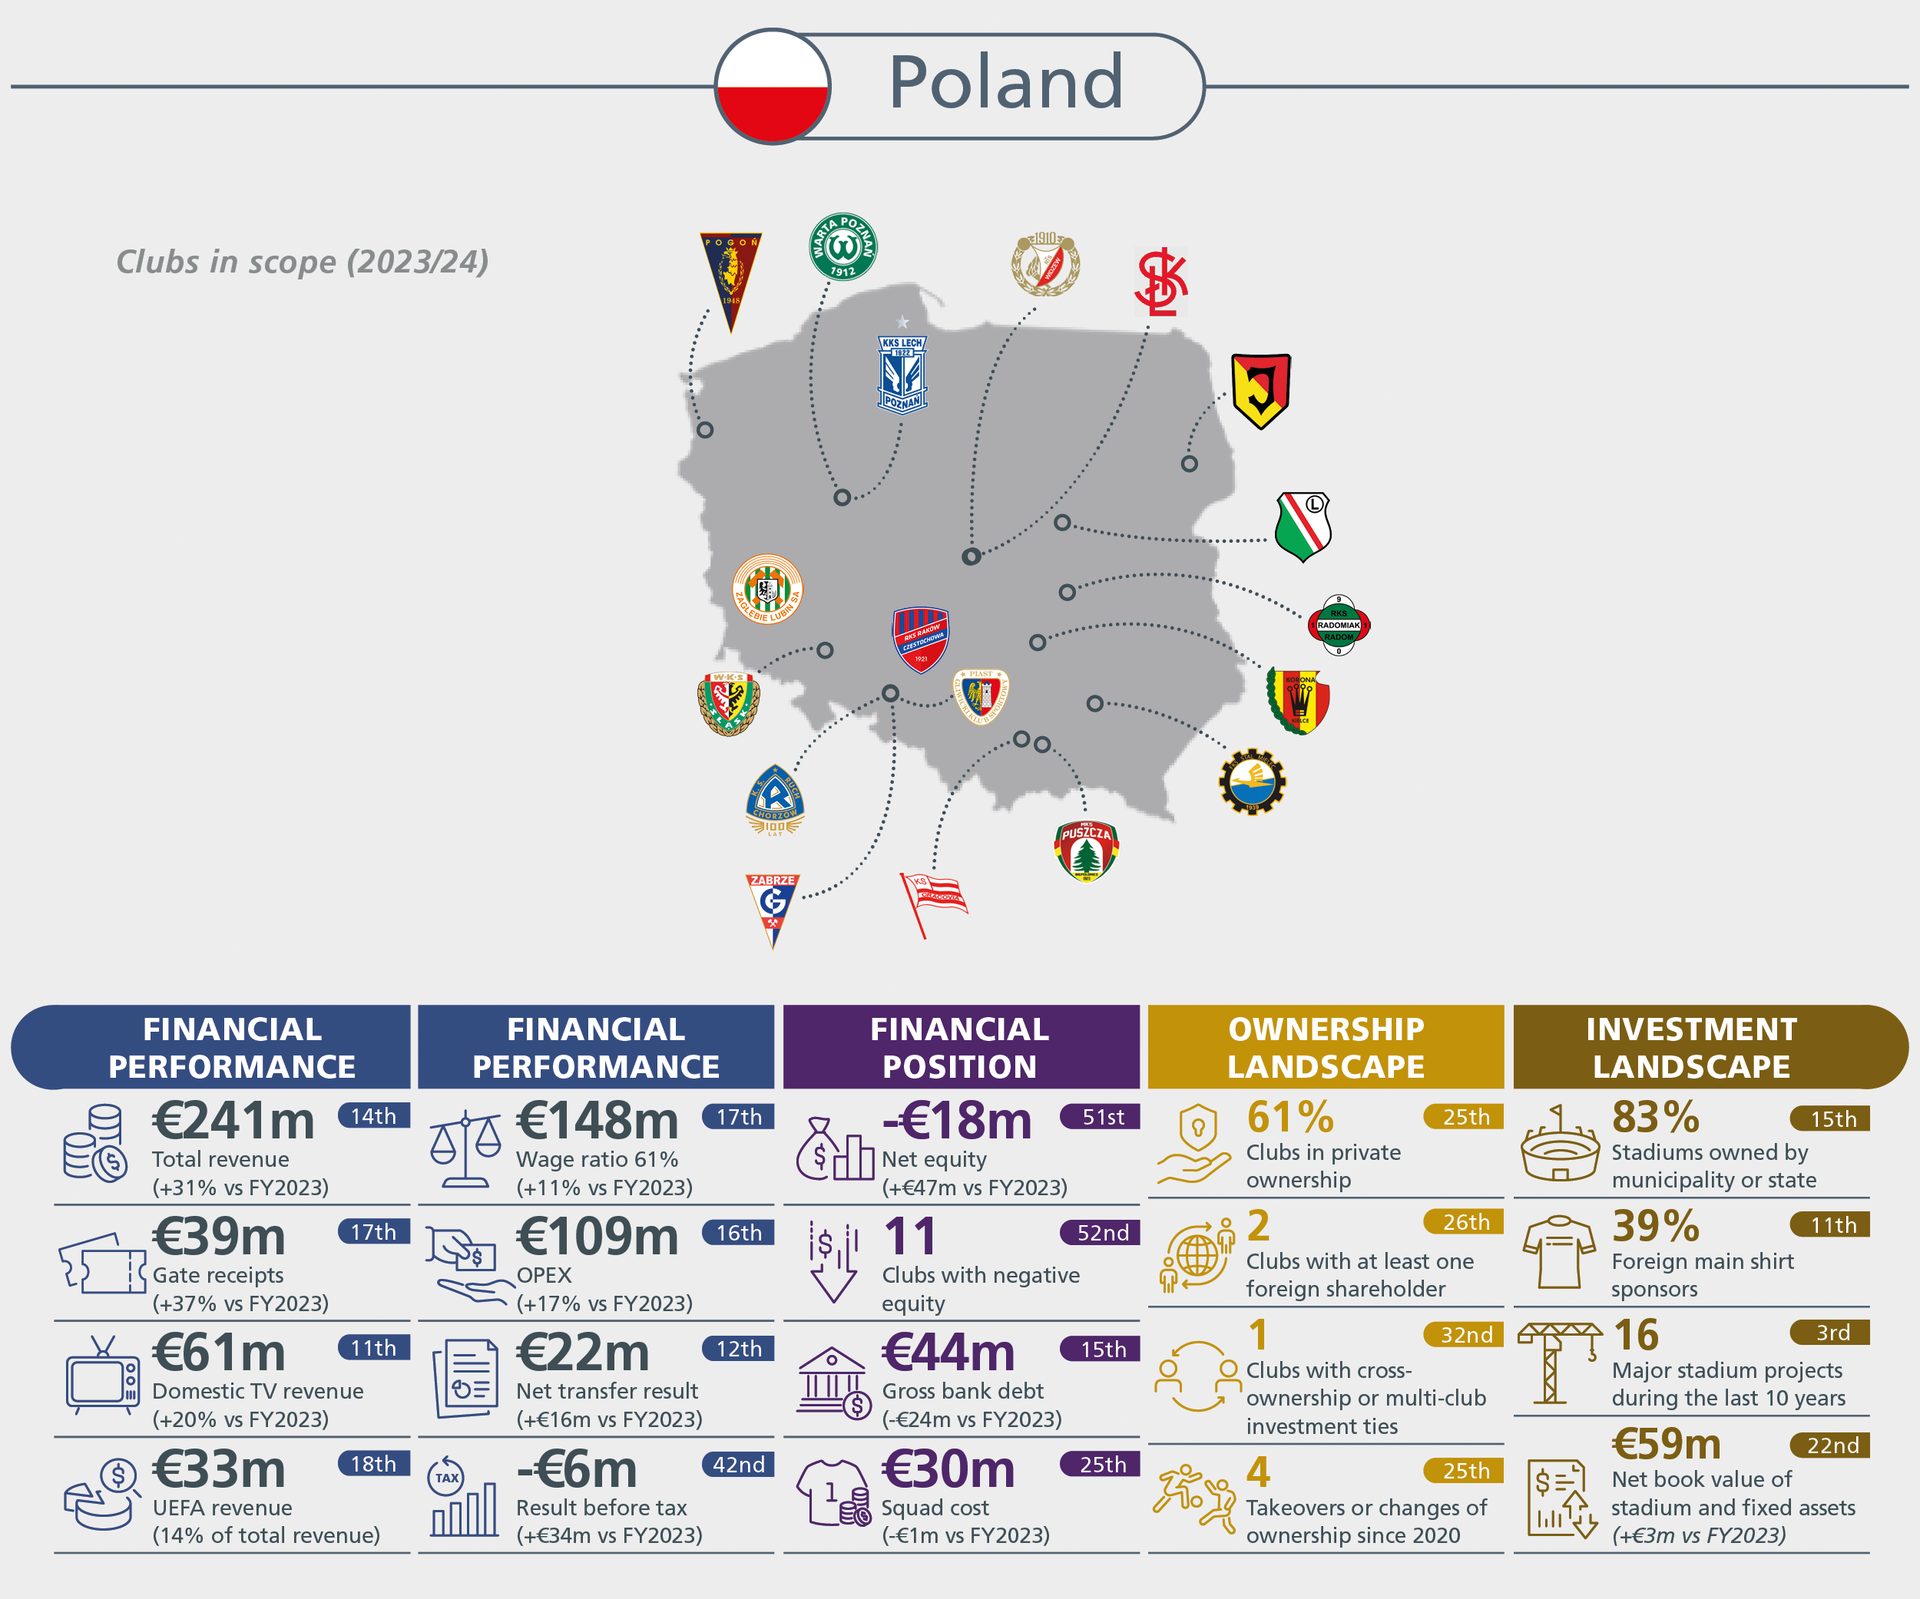
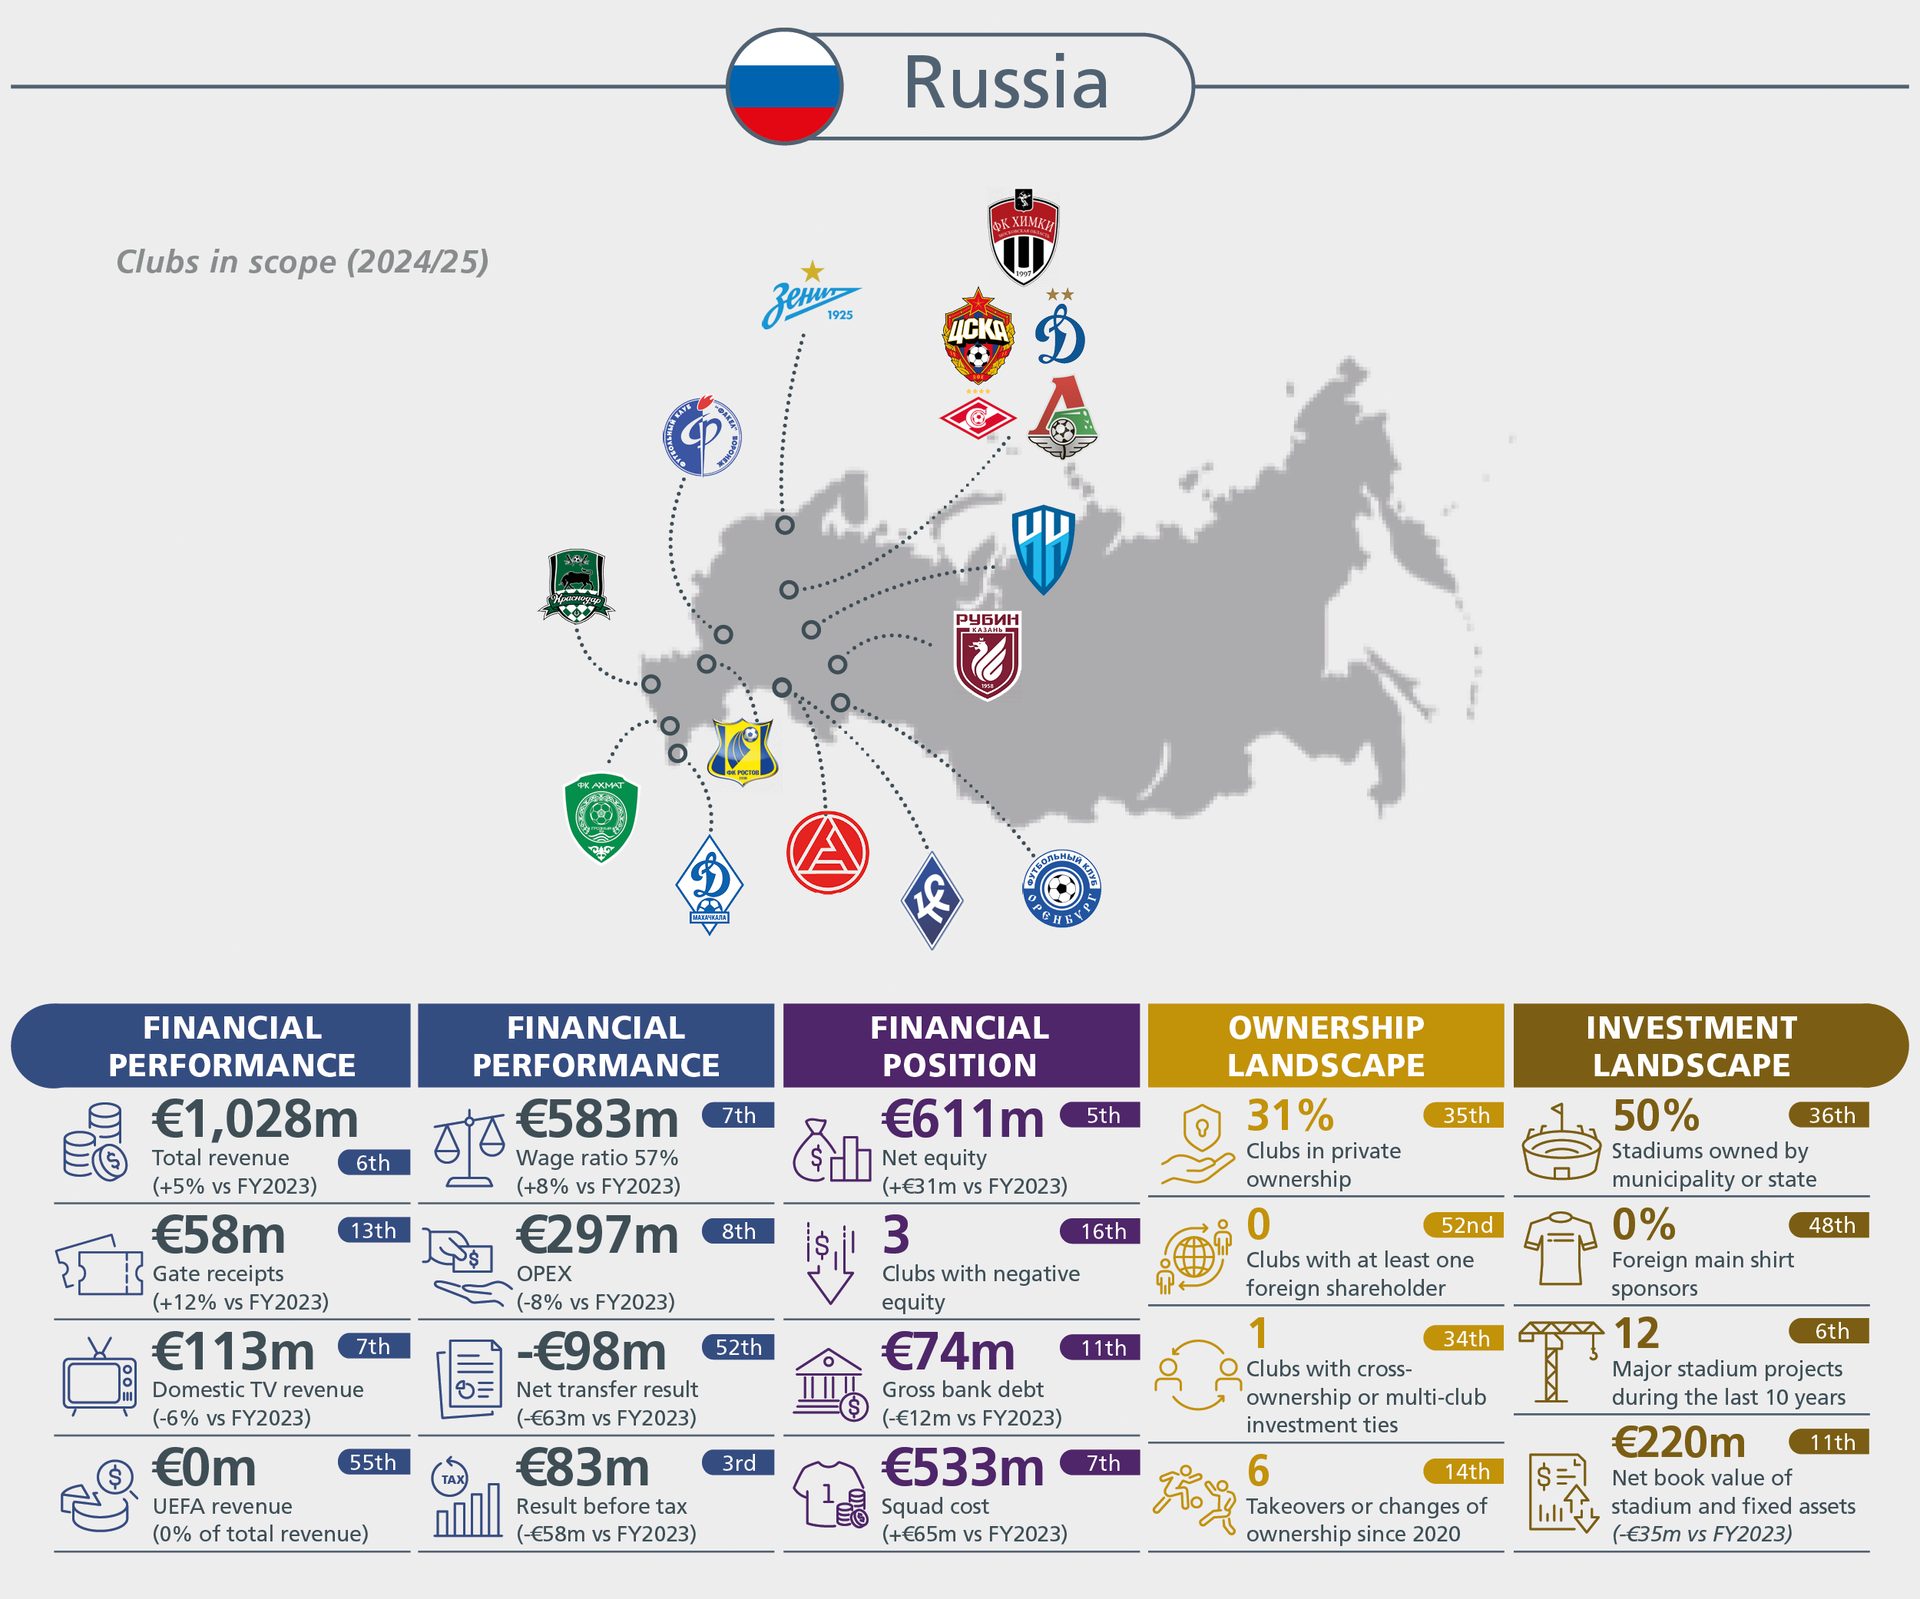
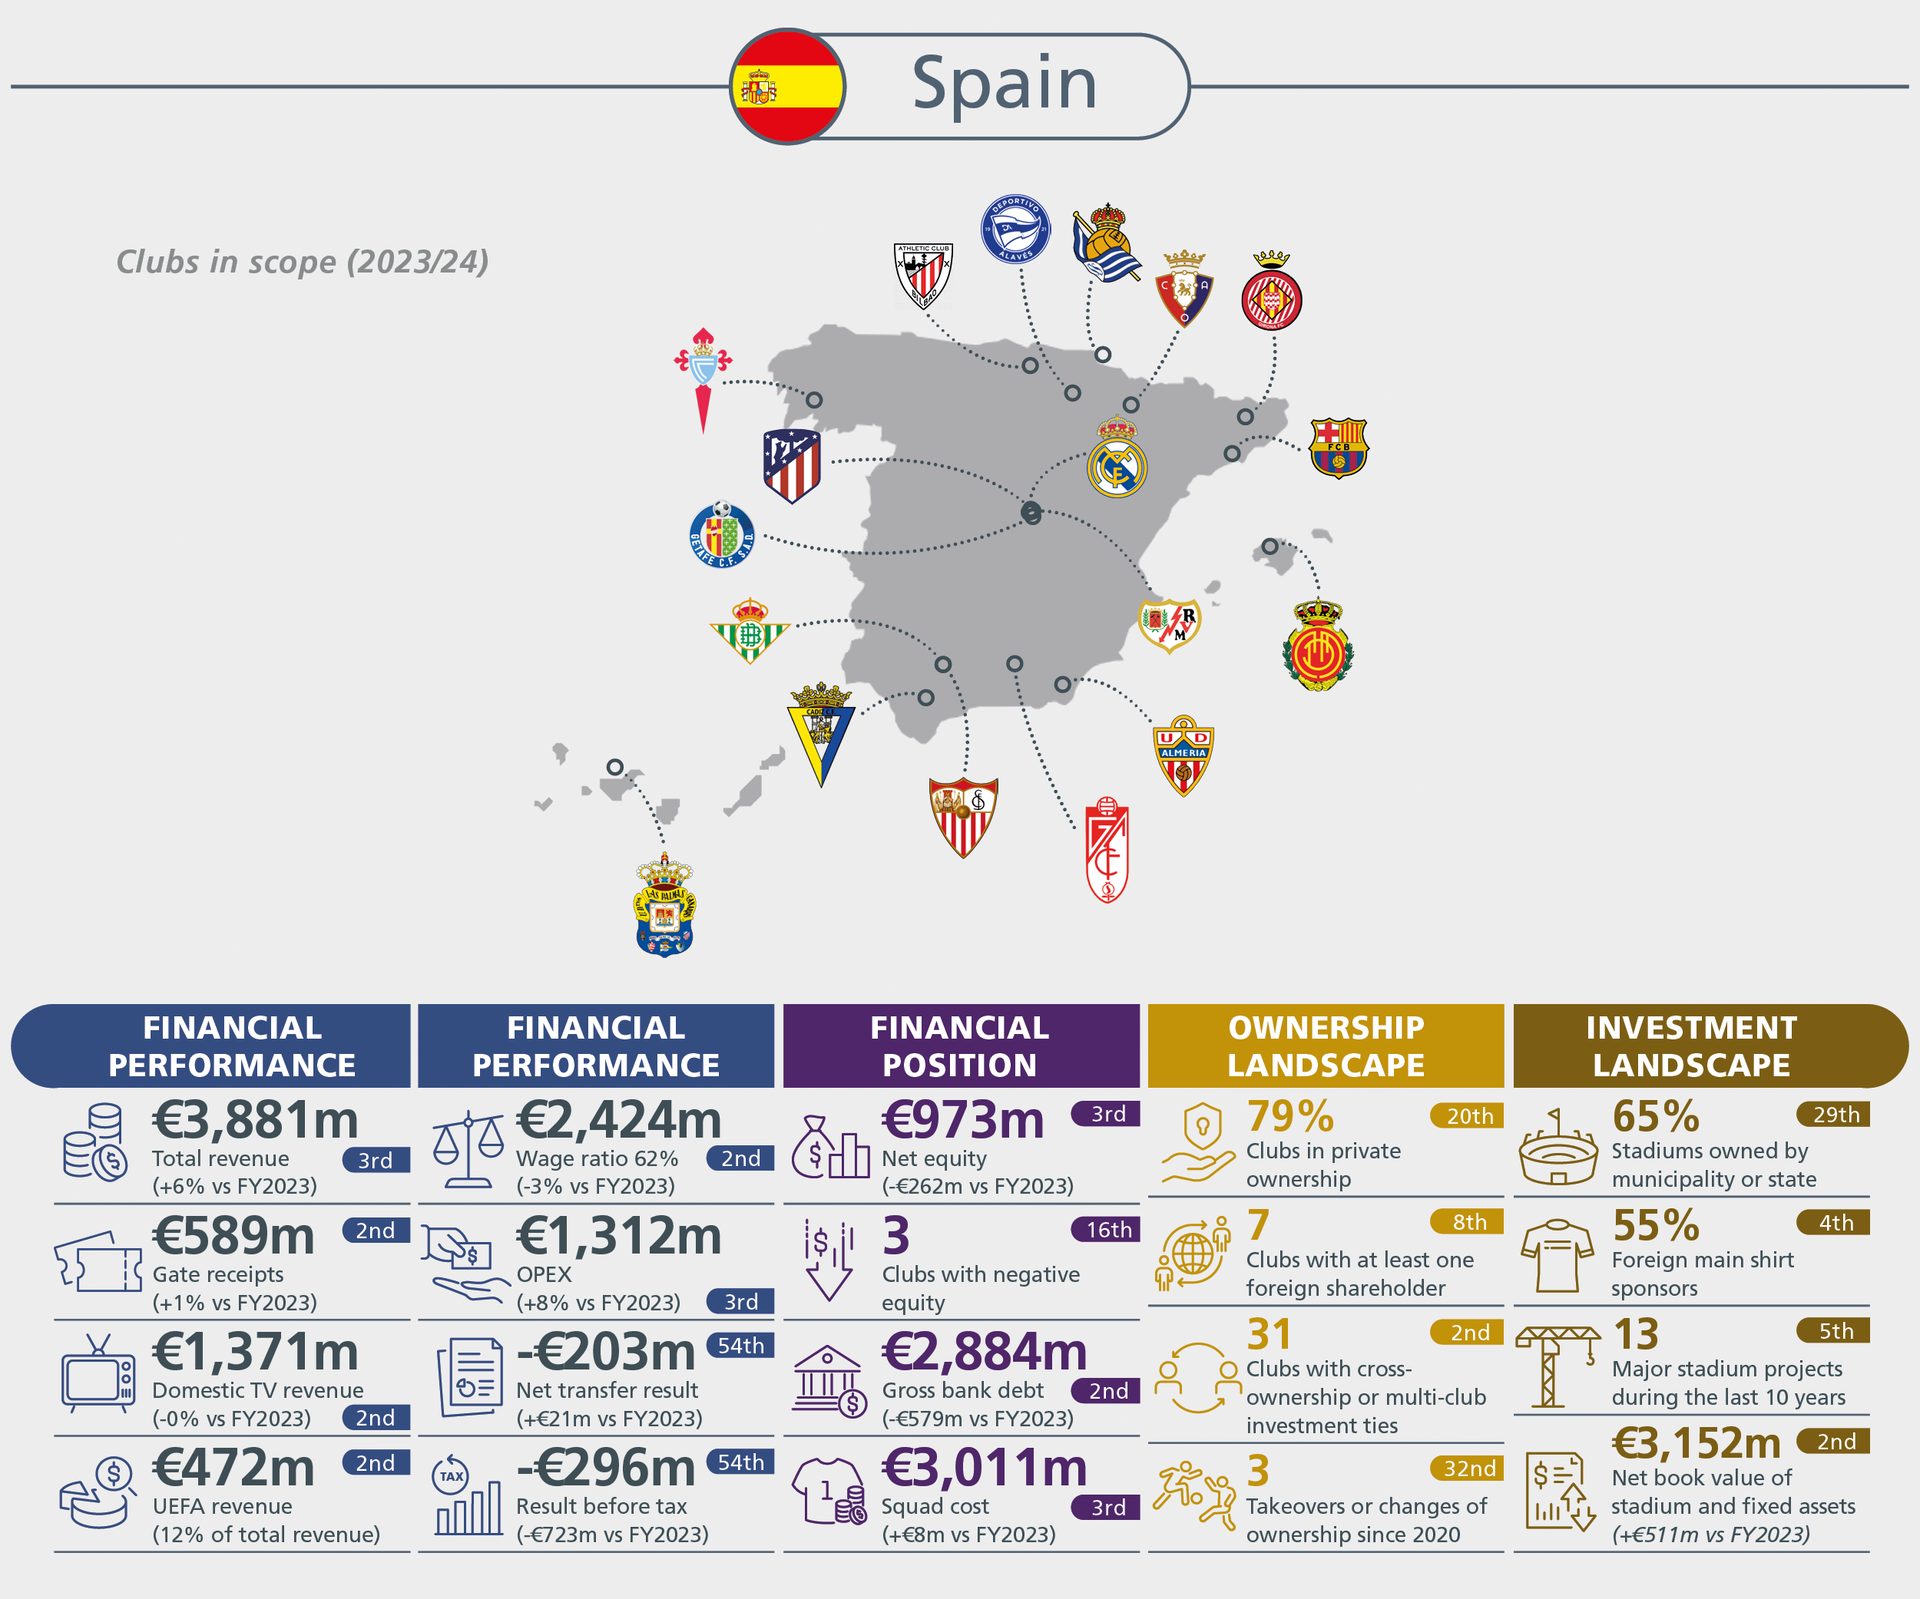
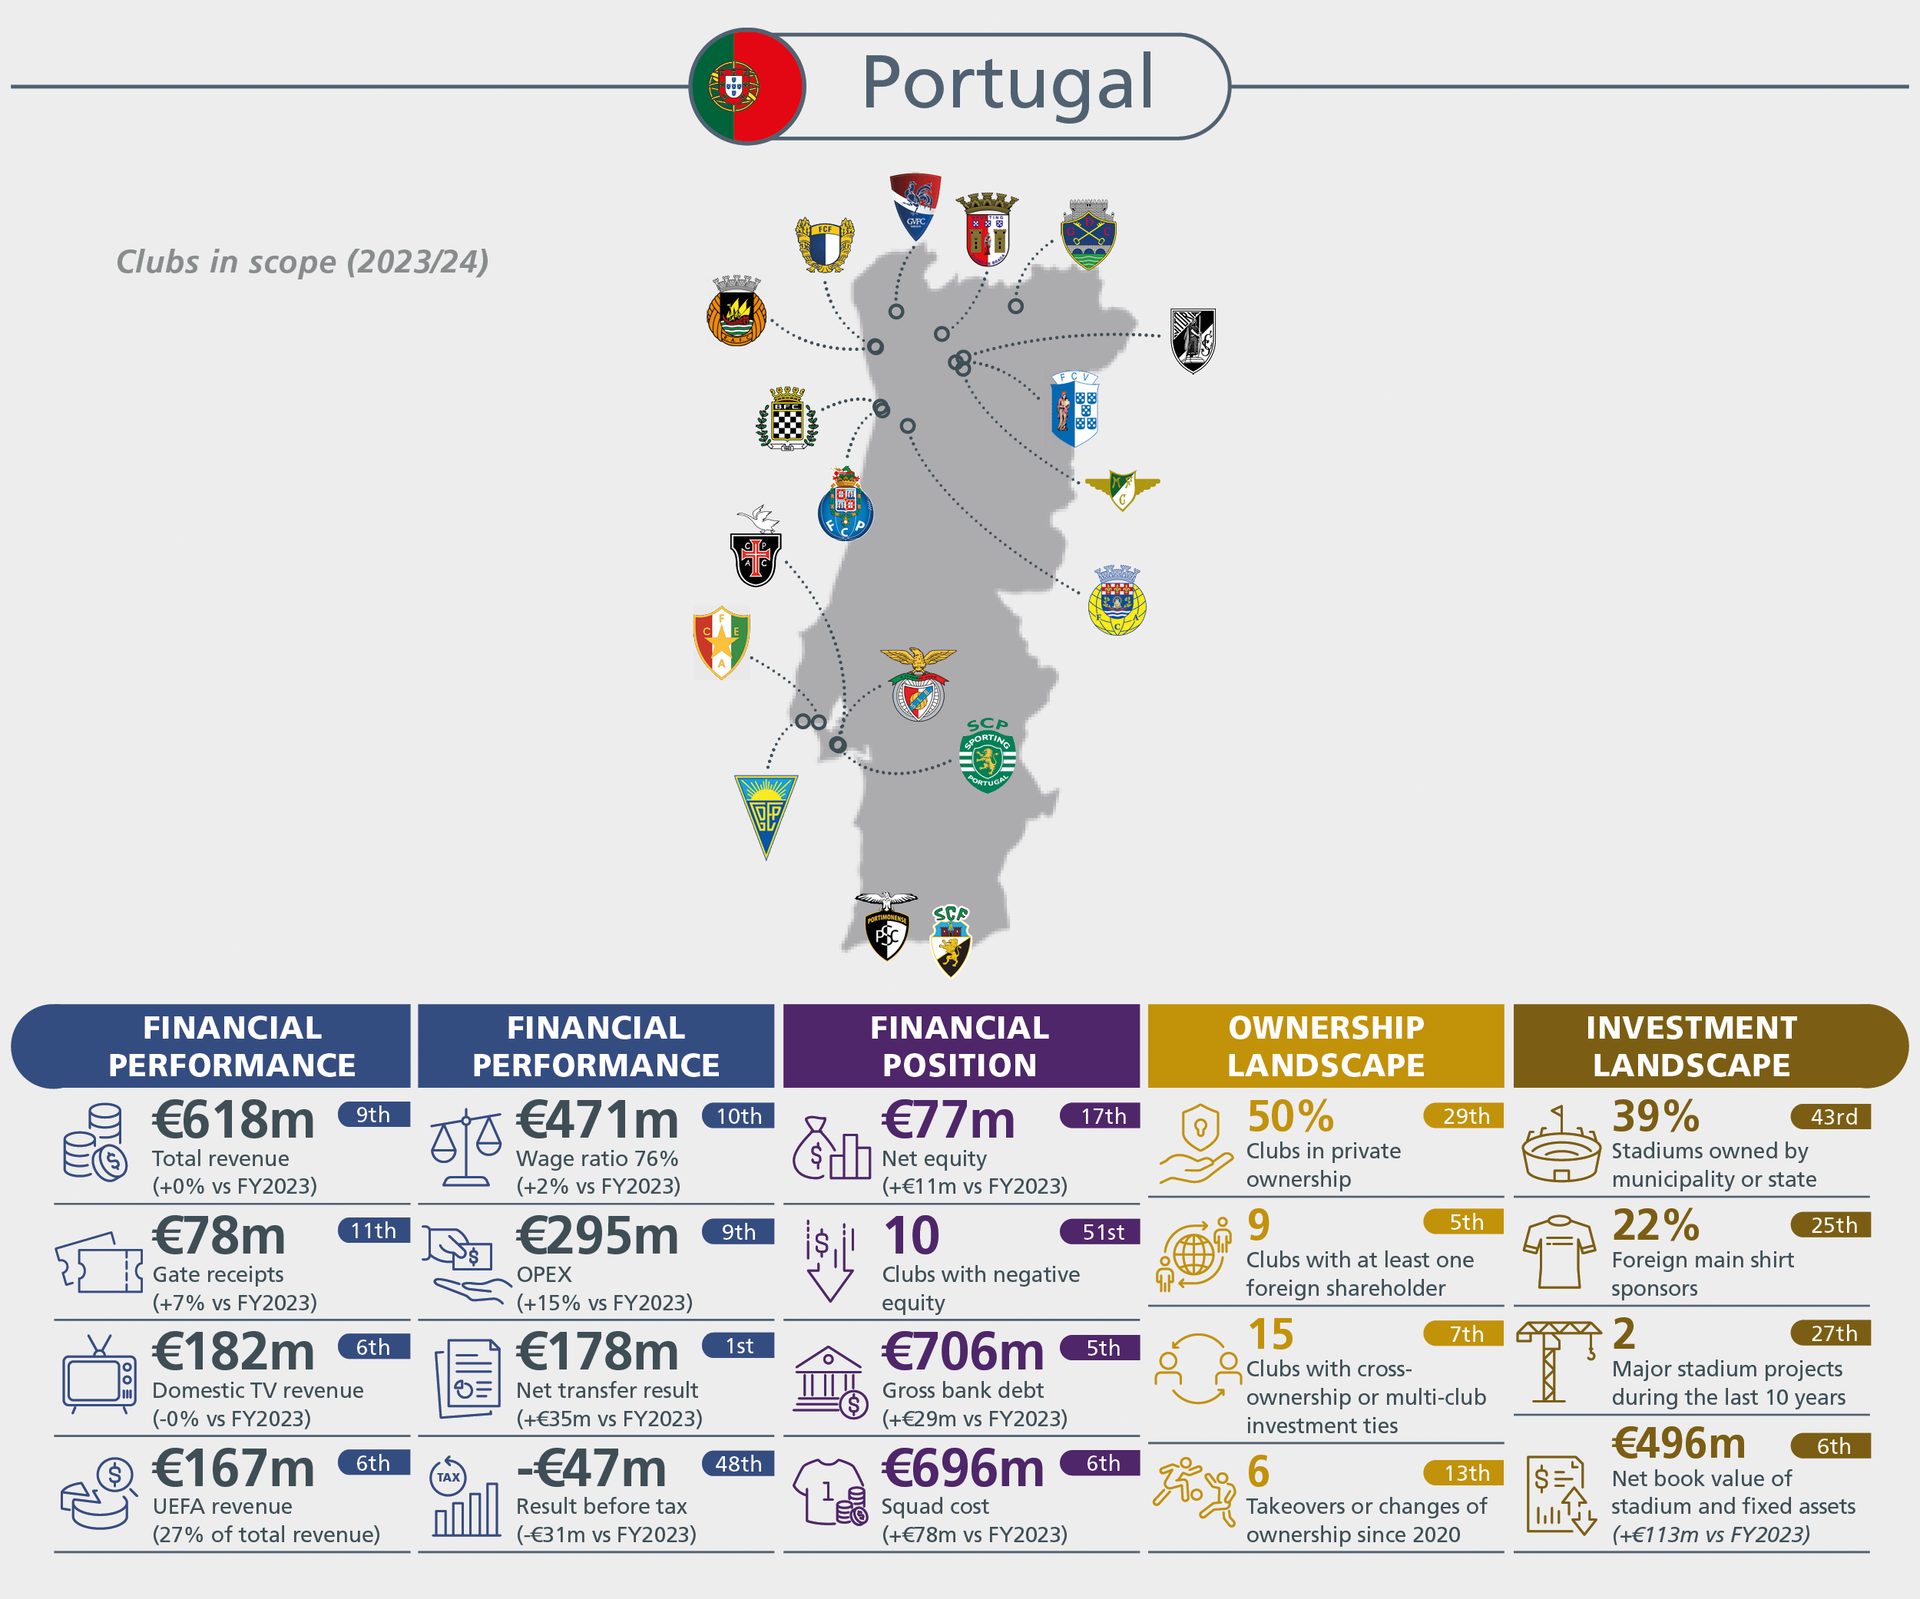
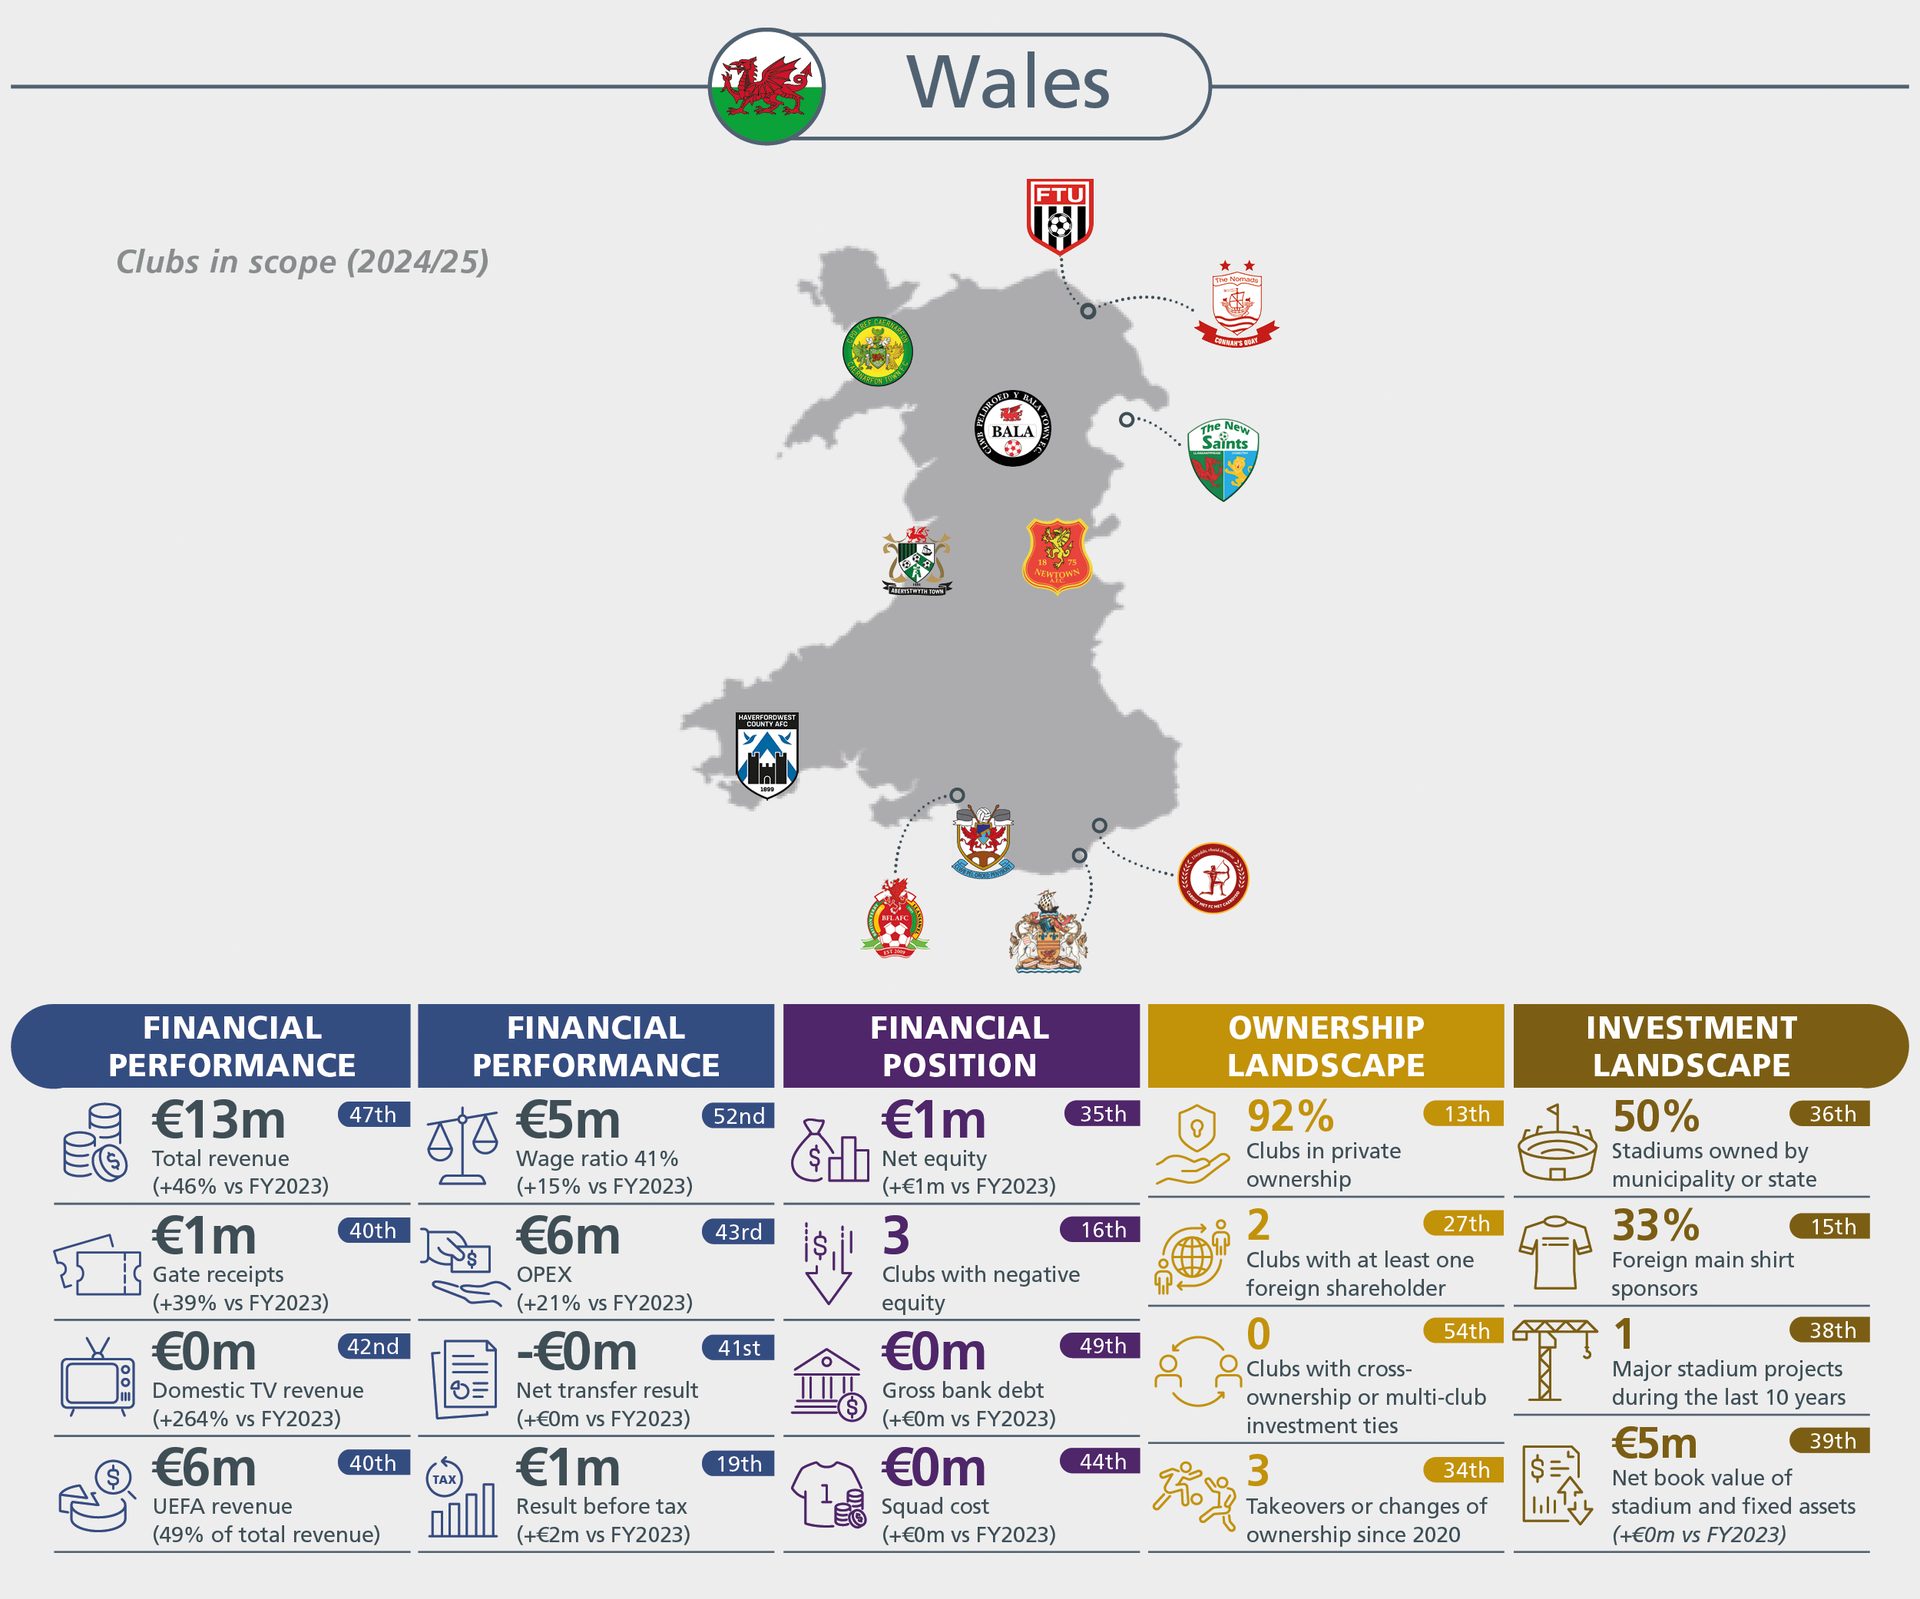
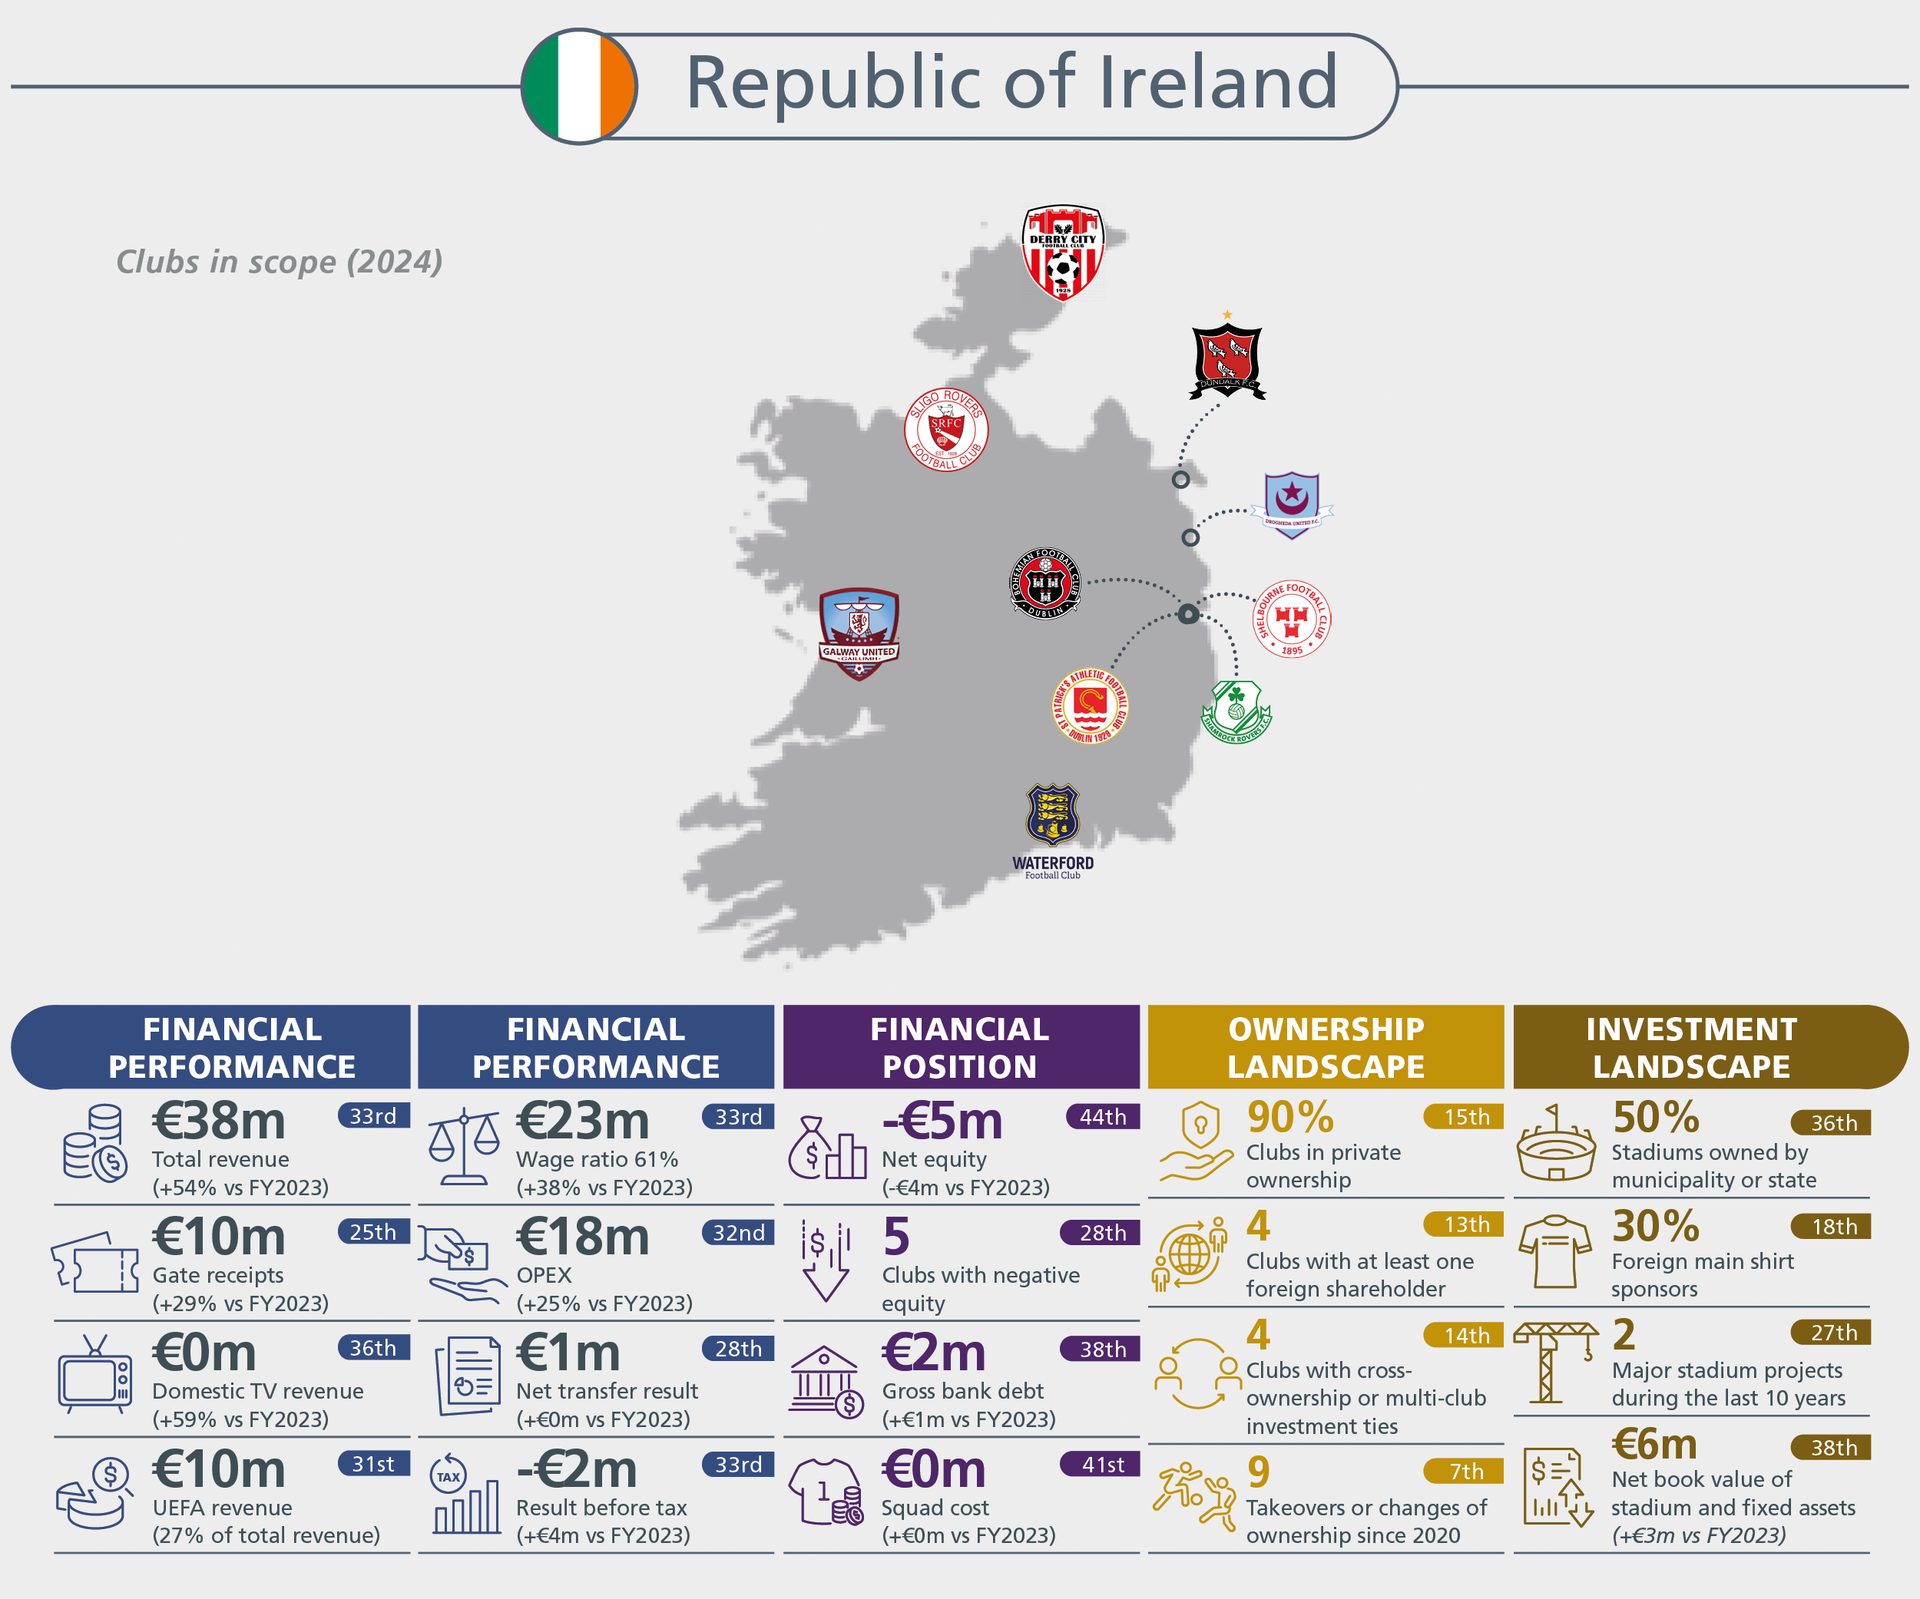
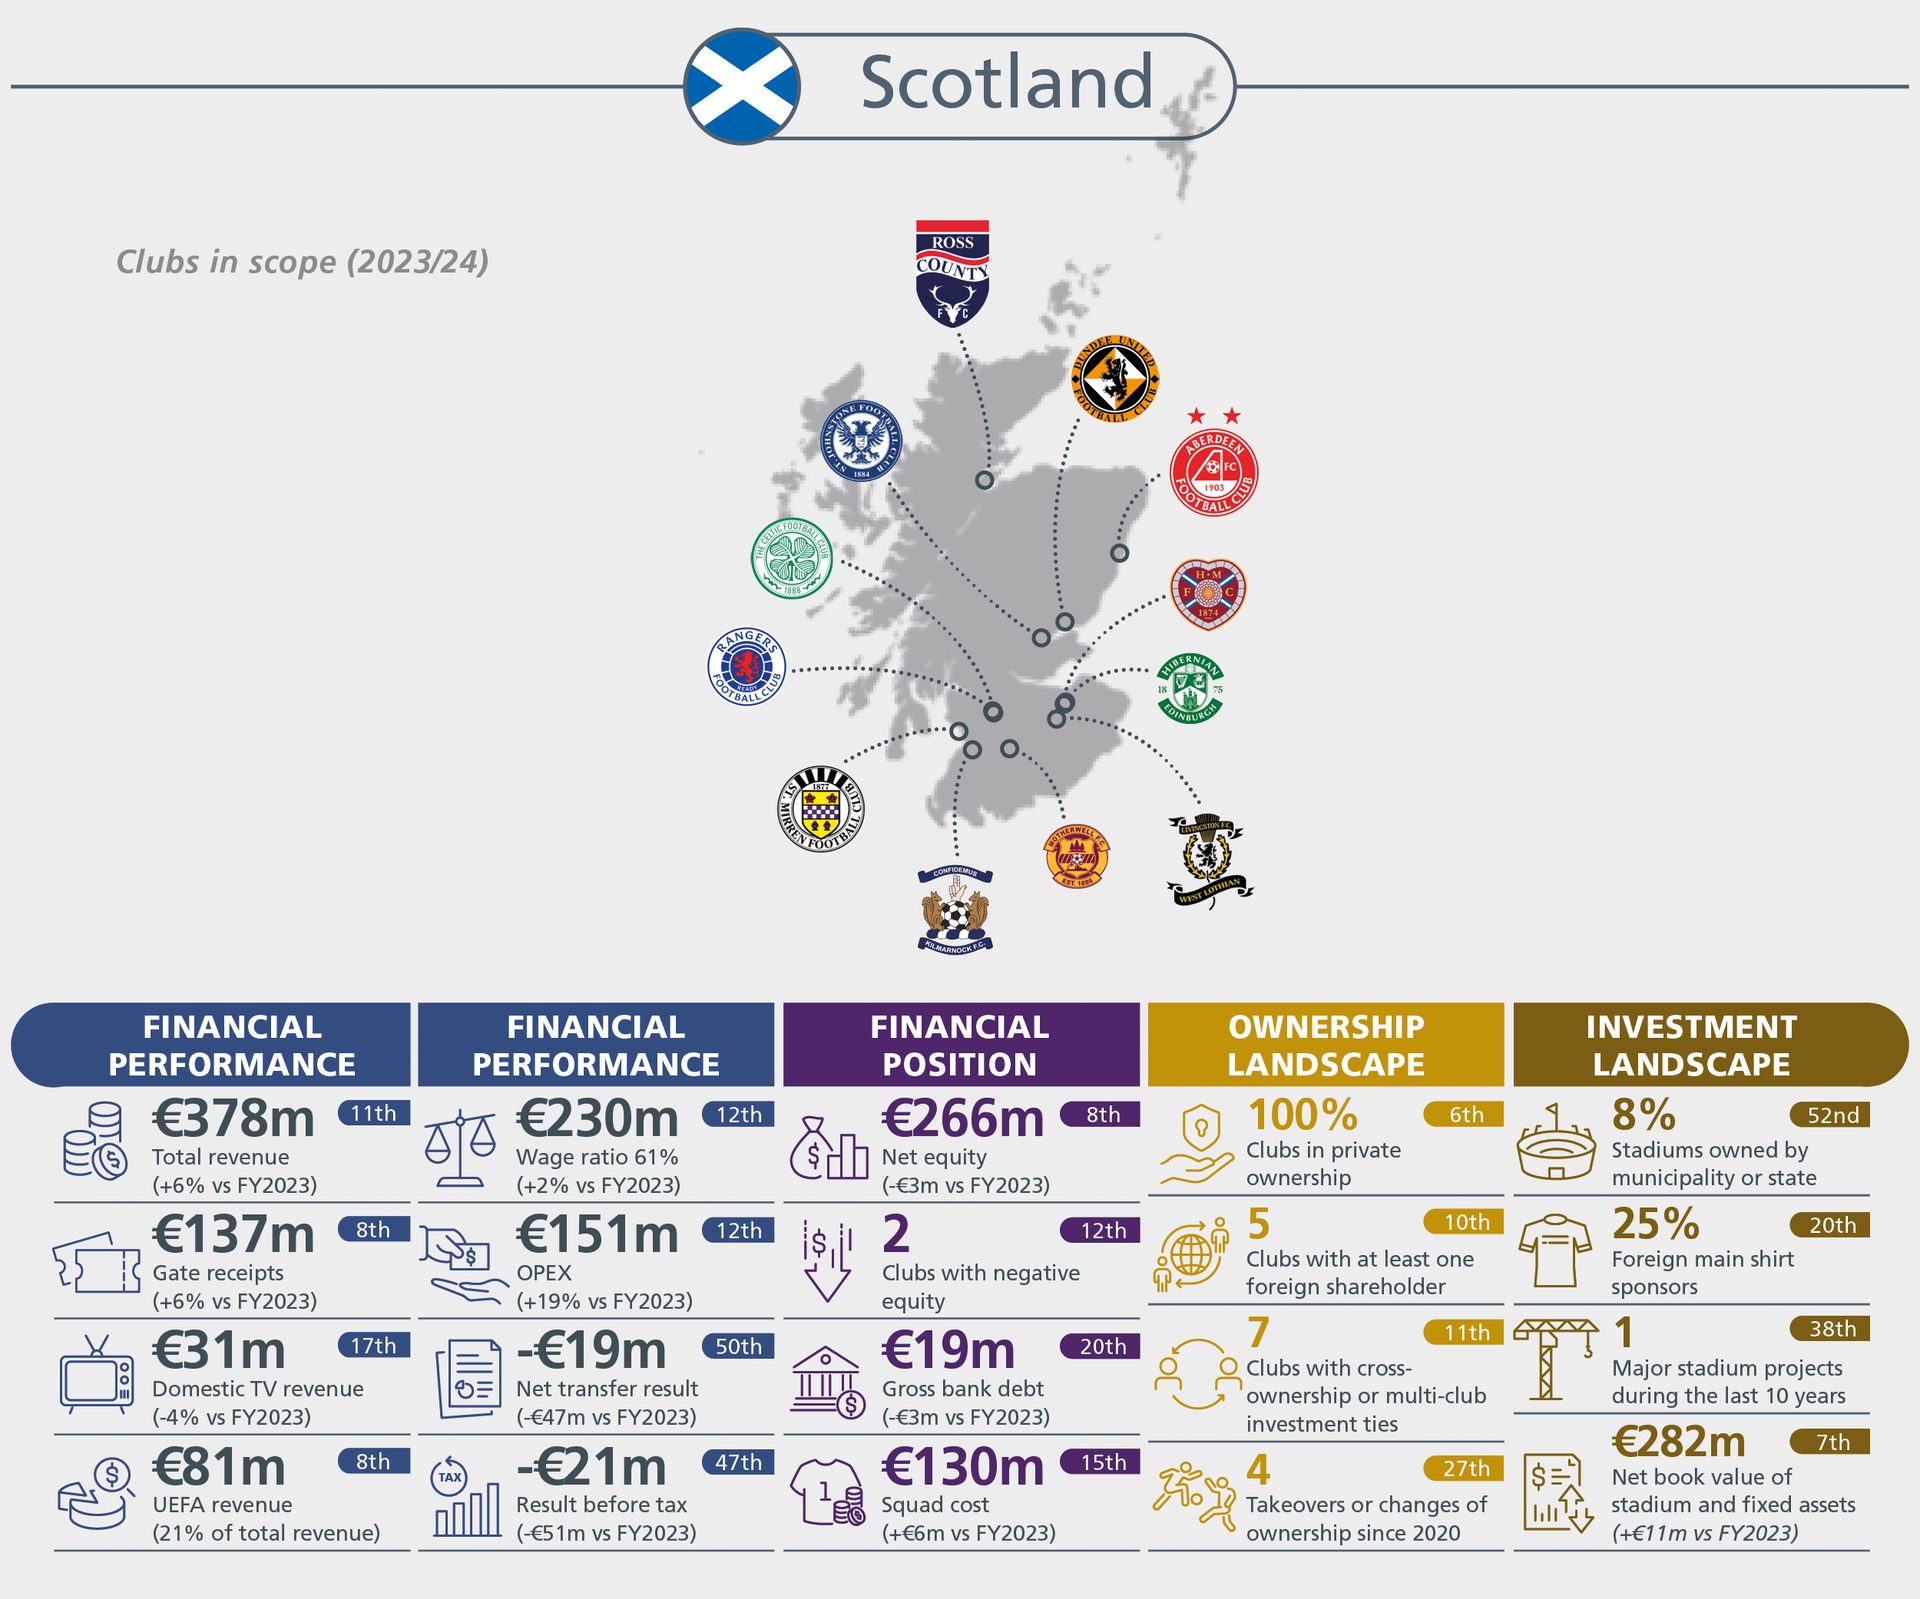
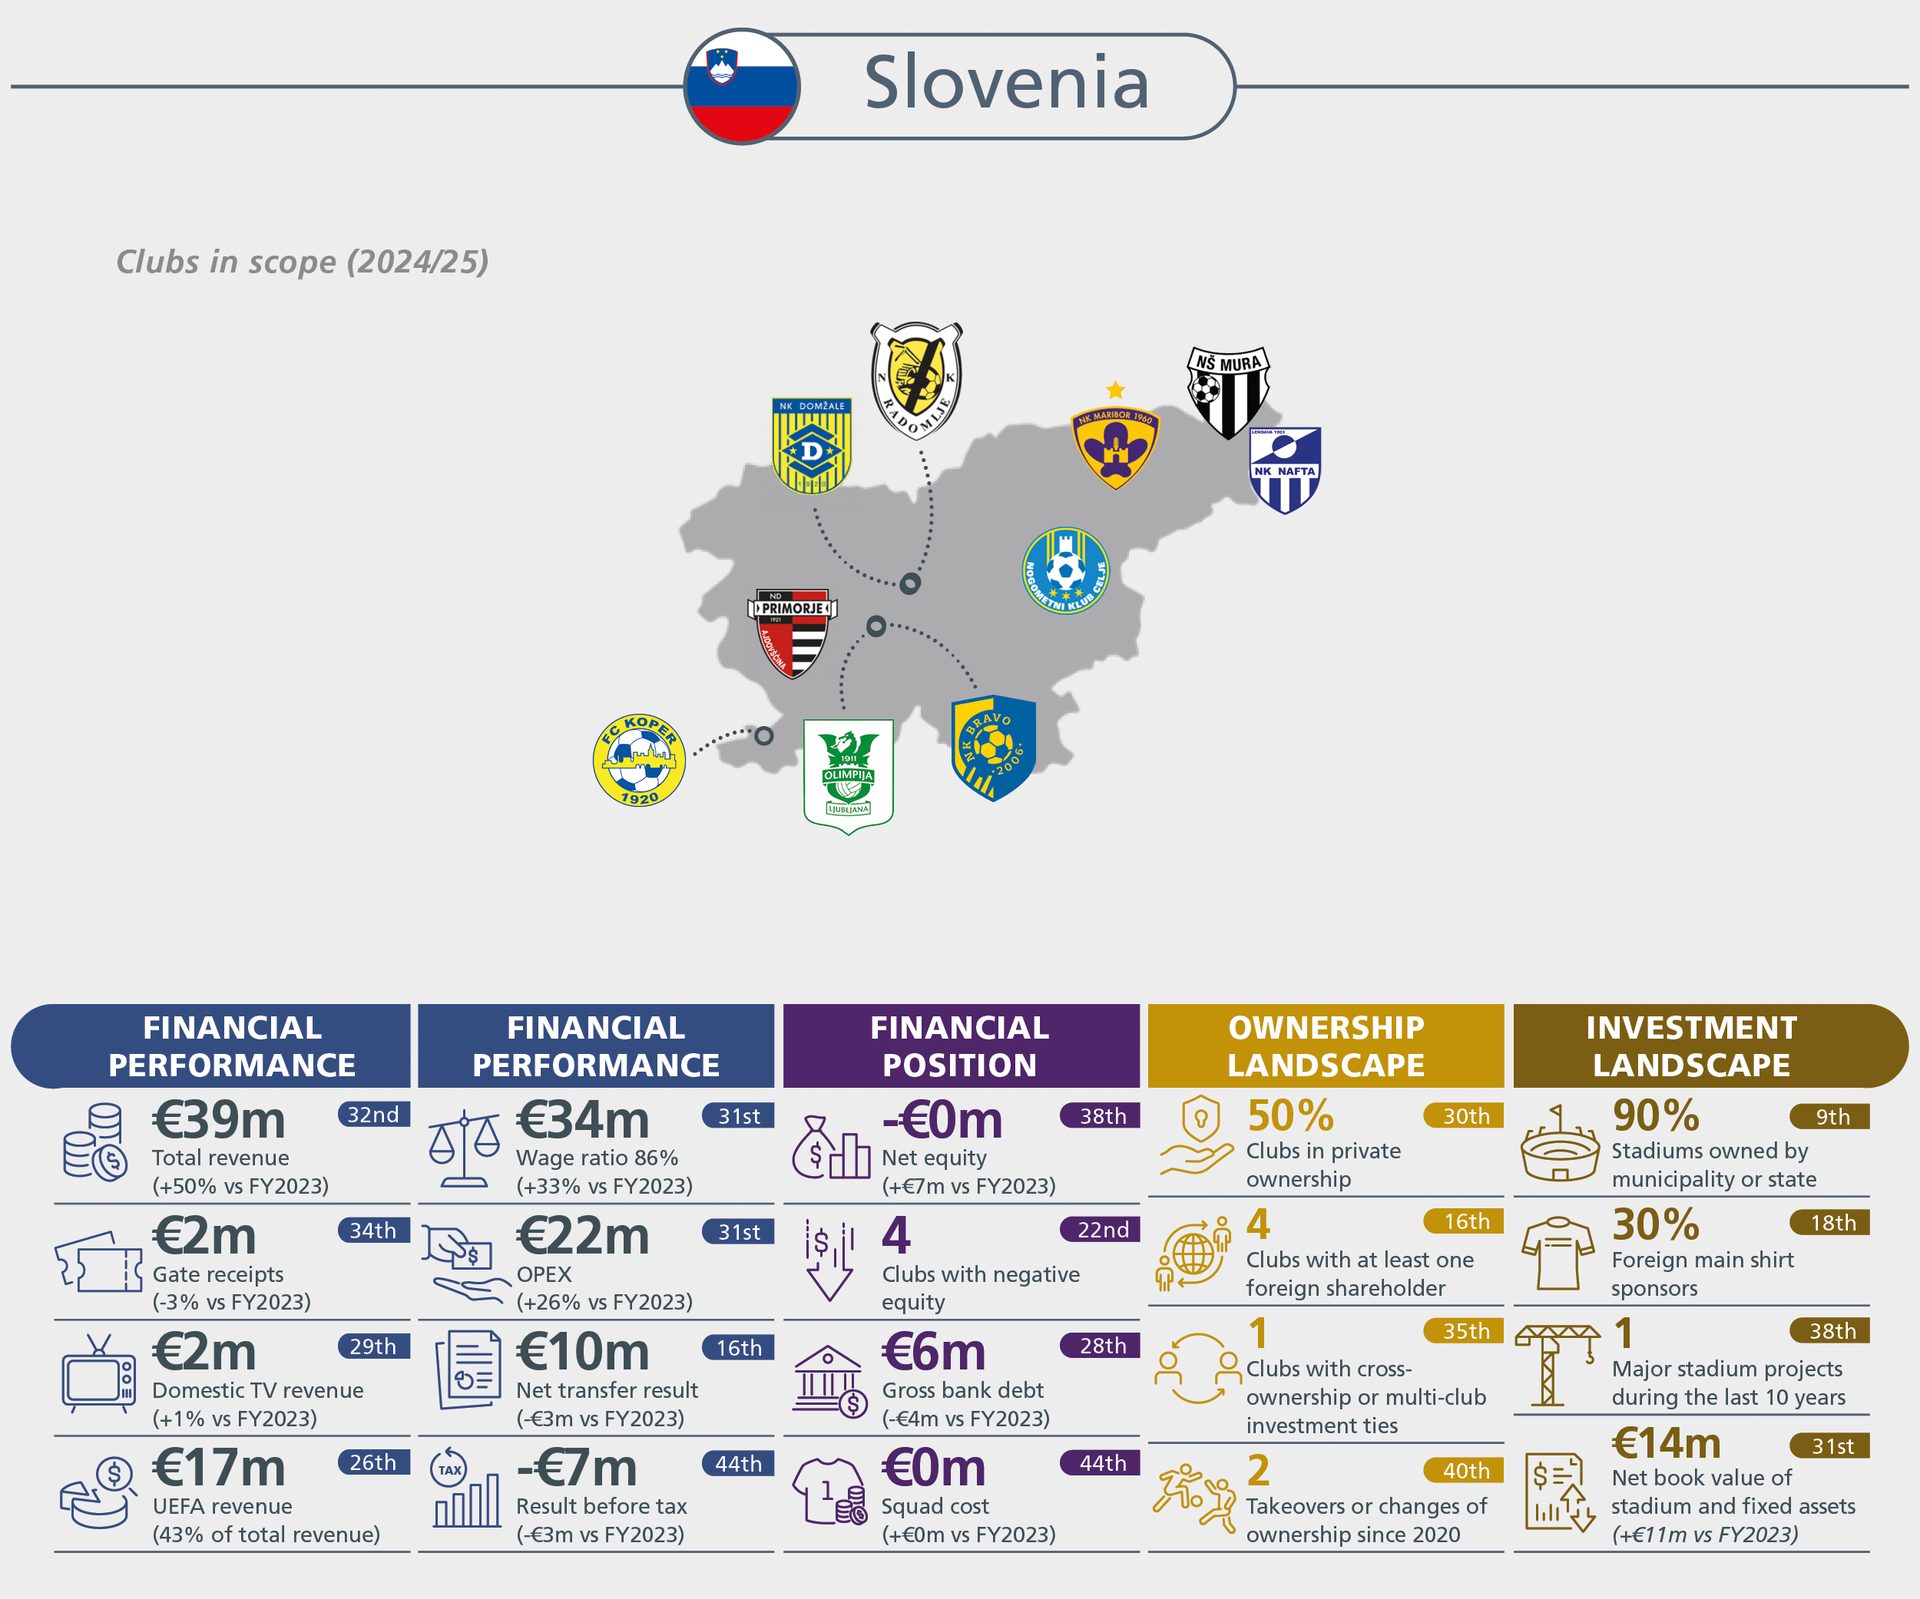
COUNTRY KPIs
The report covers much more than just the biggest clubs and leagues.
More than 700 clubs are analysed each year, providing an aggregated 360-degree snapshot.
Use the map below to explore each country’s benchmark statistics.