


23
2008 – 2011
This report is the second of two produced during this season where UEFA’s Intelligence Centre explores and analyses the European football landscape and documents the successes and challenges of European club football.
It provides colour and substance on such subjects as the types of investment coming into football, the record revenue levels reported by clubs, the increased debt that has built up at clubs during the pandemic and the drivers of revenue polarisation in European football.
It documents the full scope of football finances, from detailed analyses of the top 20 clubs across ten measures, to 20 KPIs across all 55 European top tier leagues.
The UEFA Intelligence Centre landscape reports have long brought transparency to European football with the aim to support evidence-based policy making and decision taking. For those of you that love football, why not explore further?
Top division club revenues reached €24bn in 2022, increasing over €10bn in the last decade and will push further beyond €26bn in 2023.
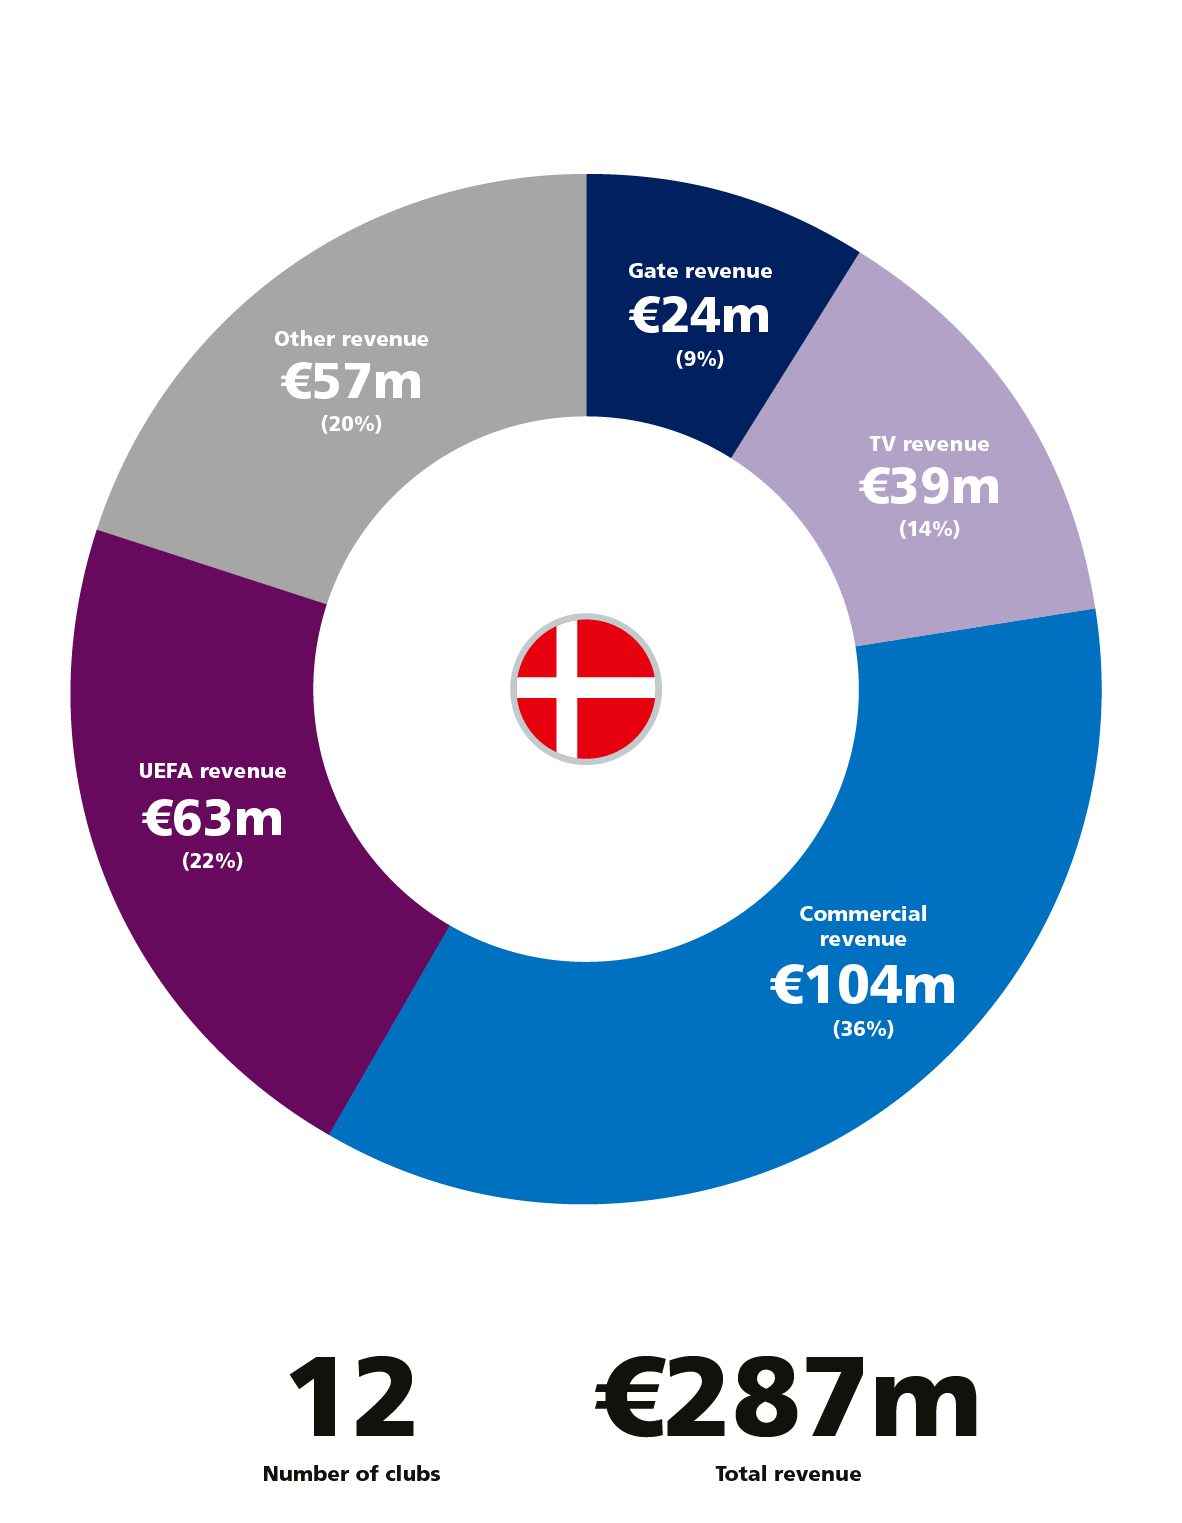
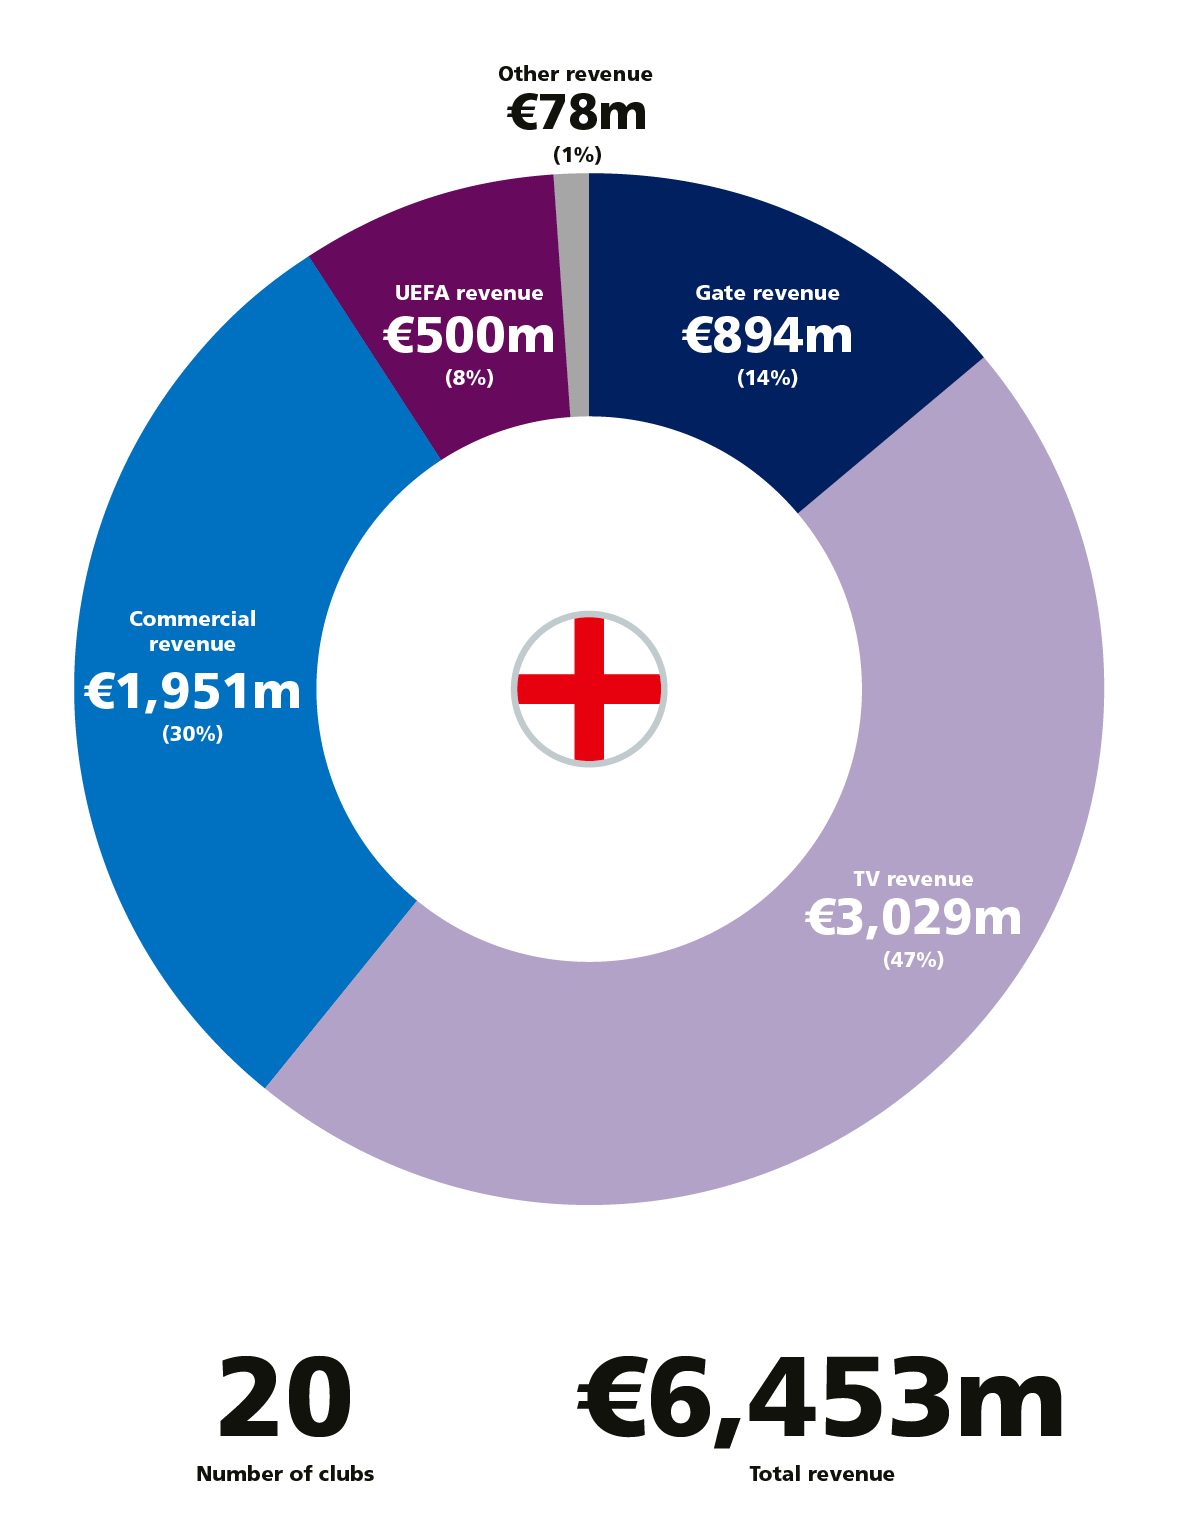
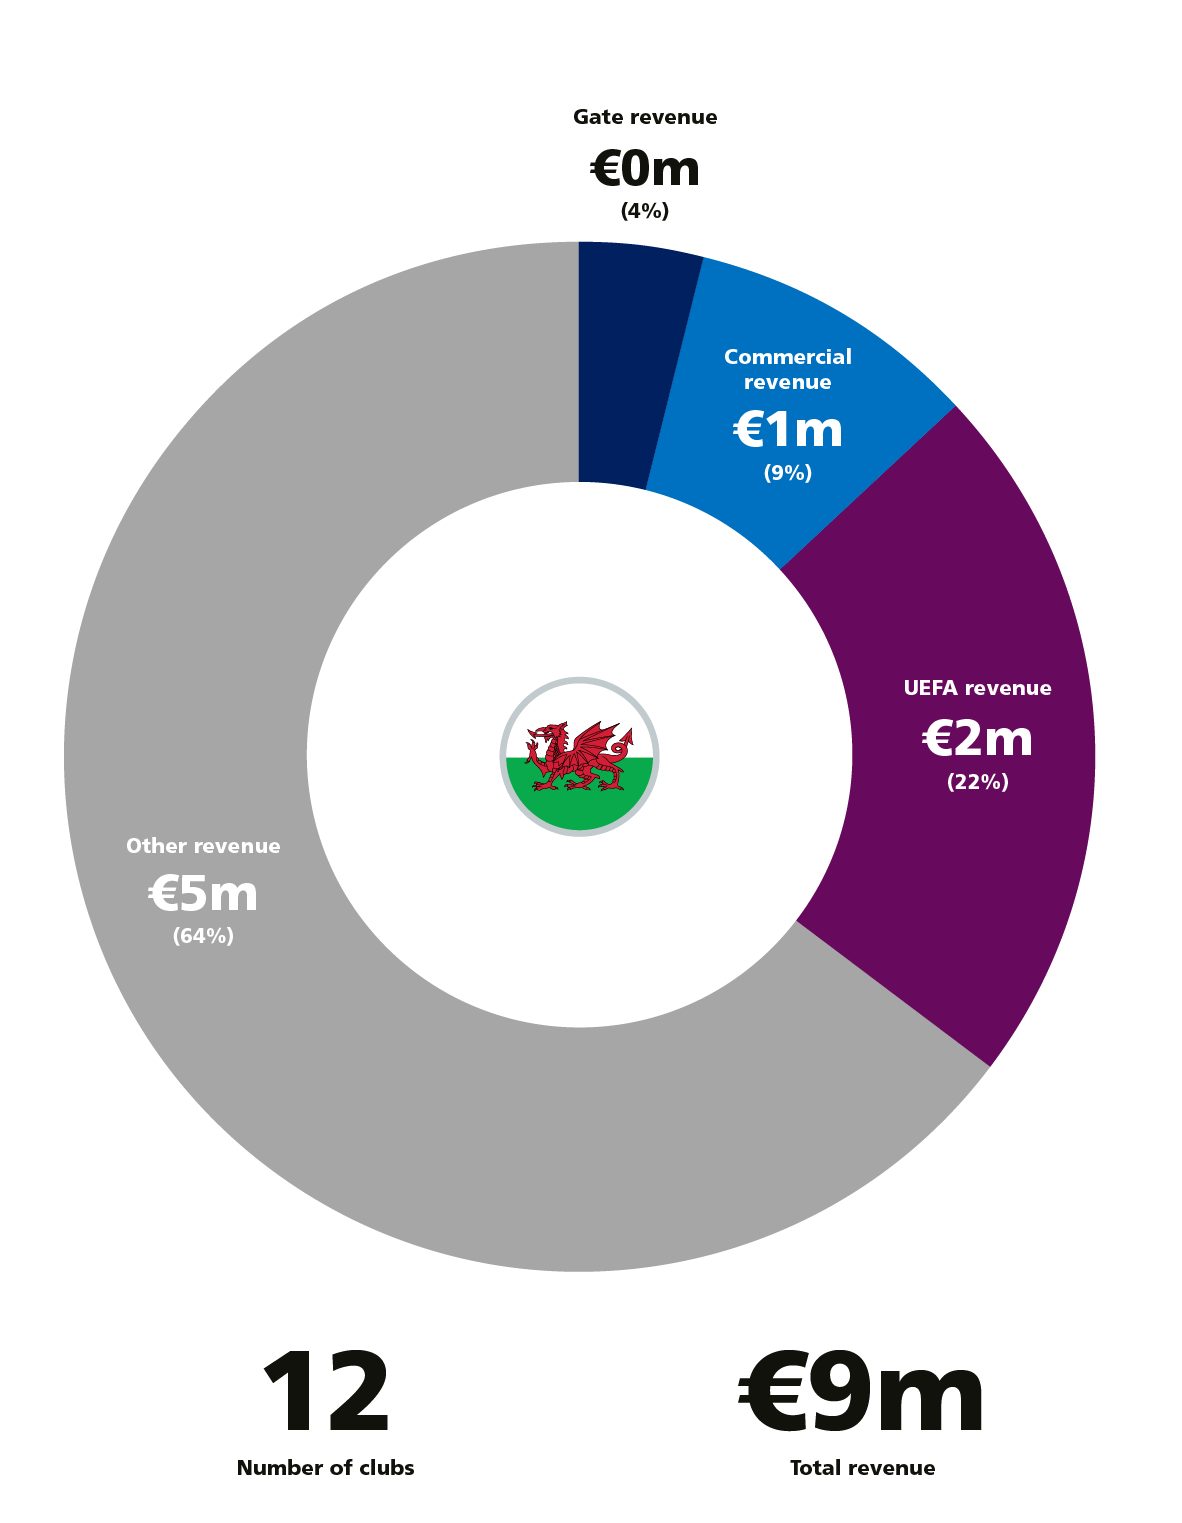
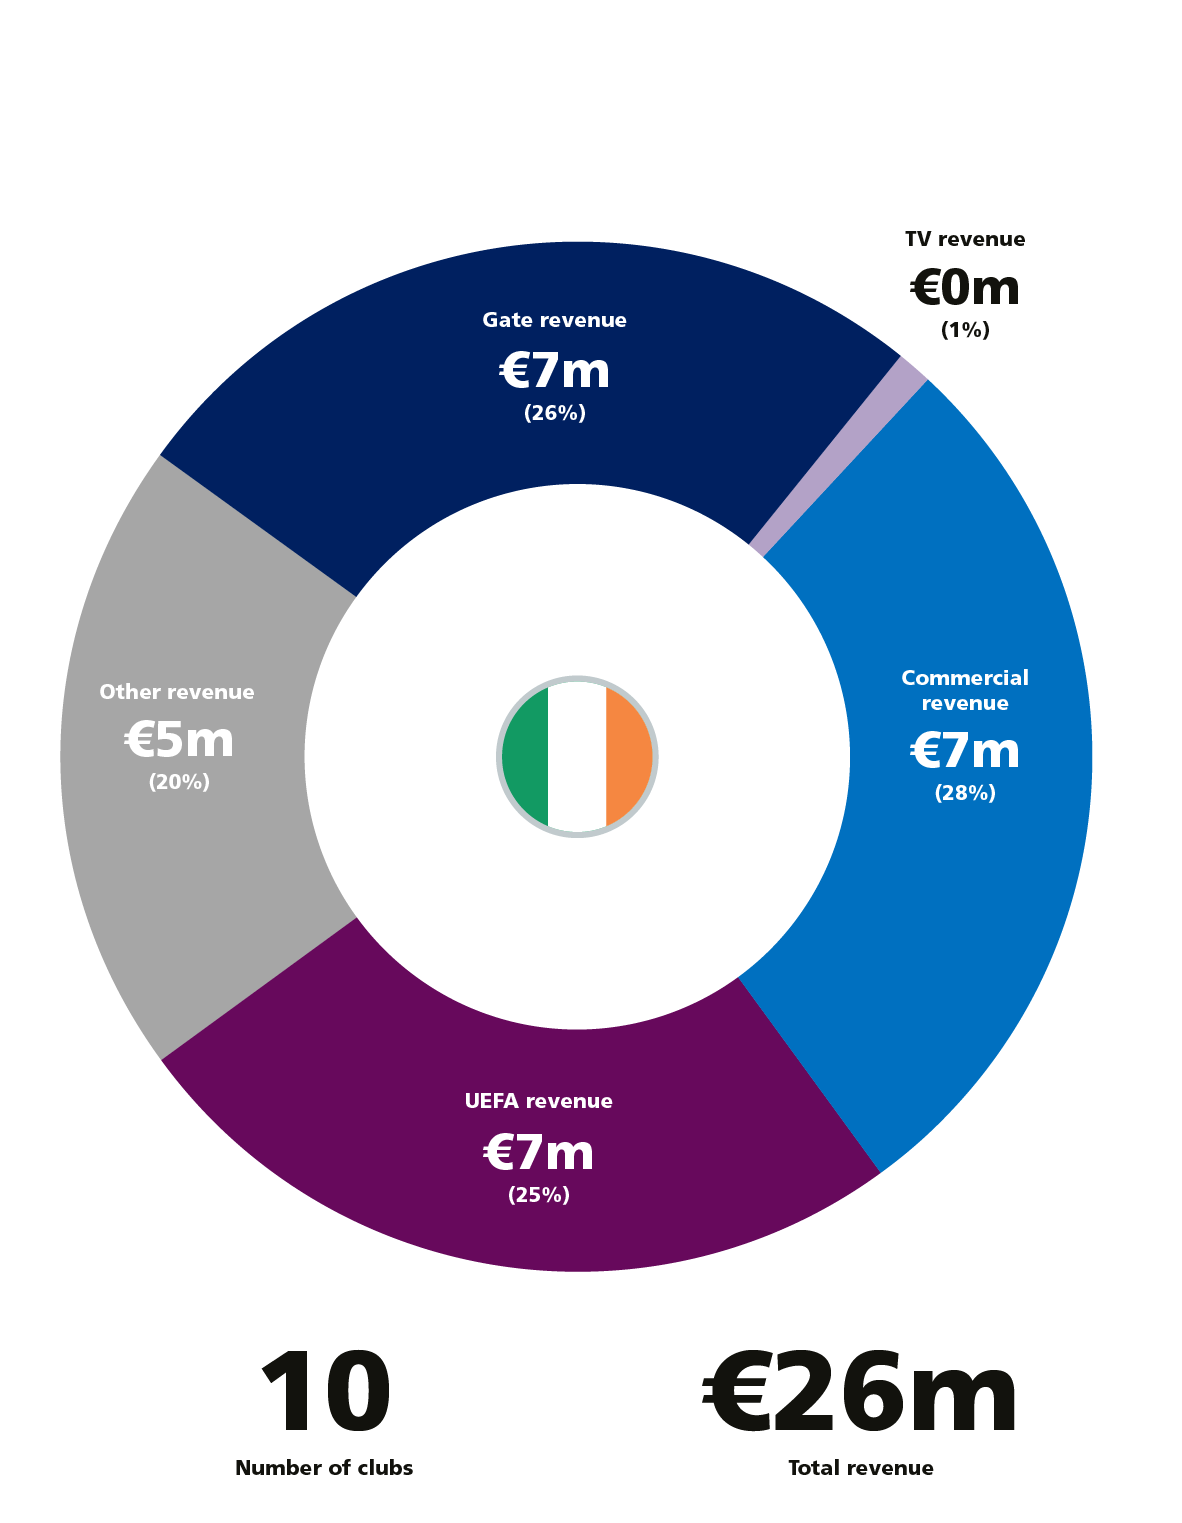
Revenue levels between countries and within countries remain large. The report explains how TV revenues drive the gap between countries and commercial revenues drive the gaps between clubs.

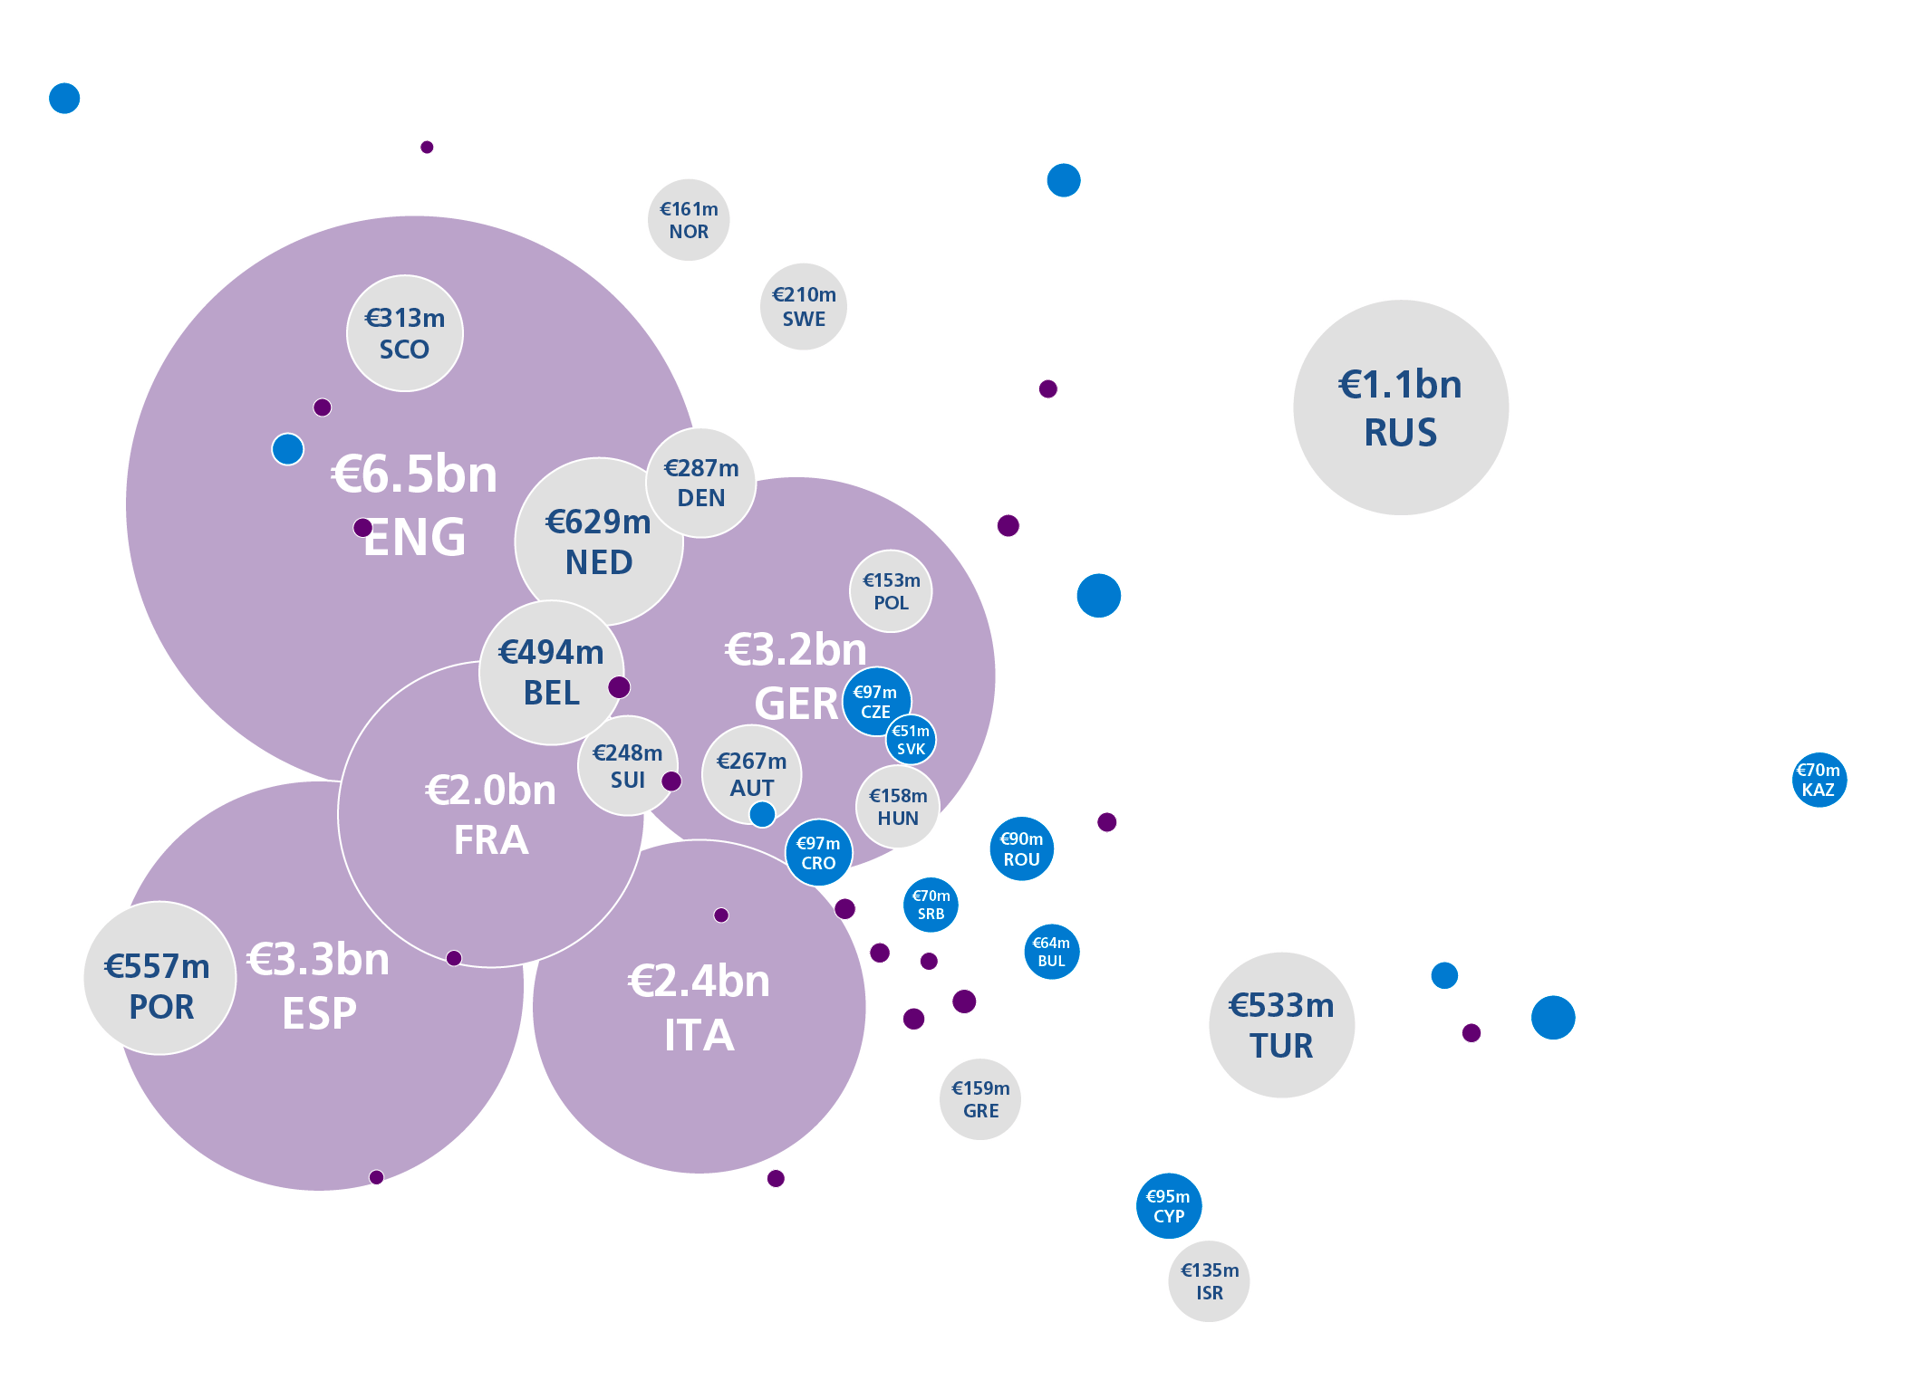
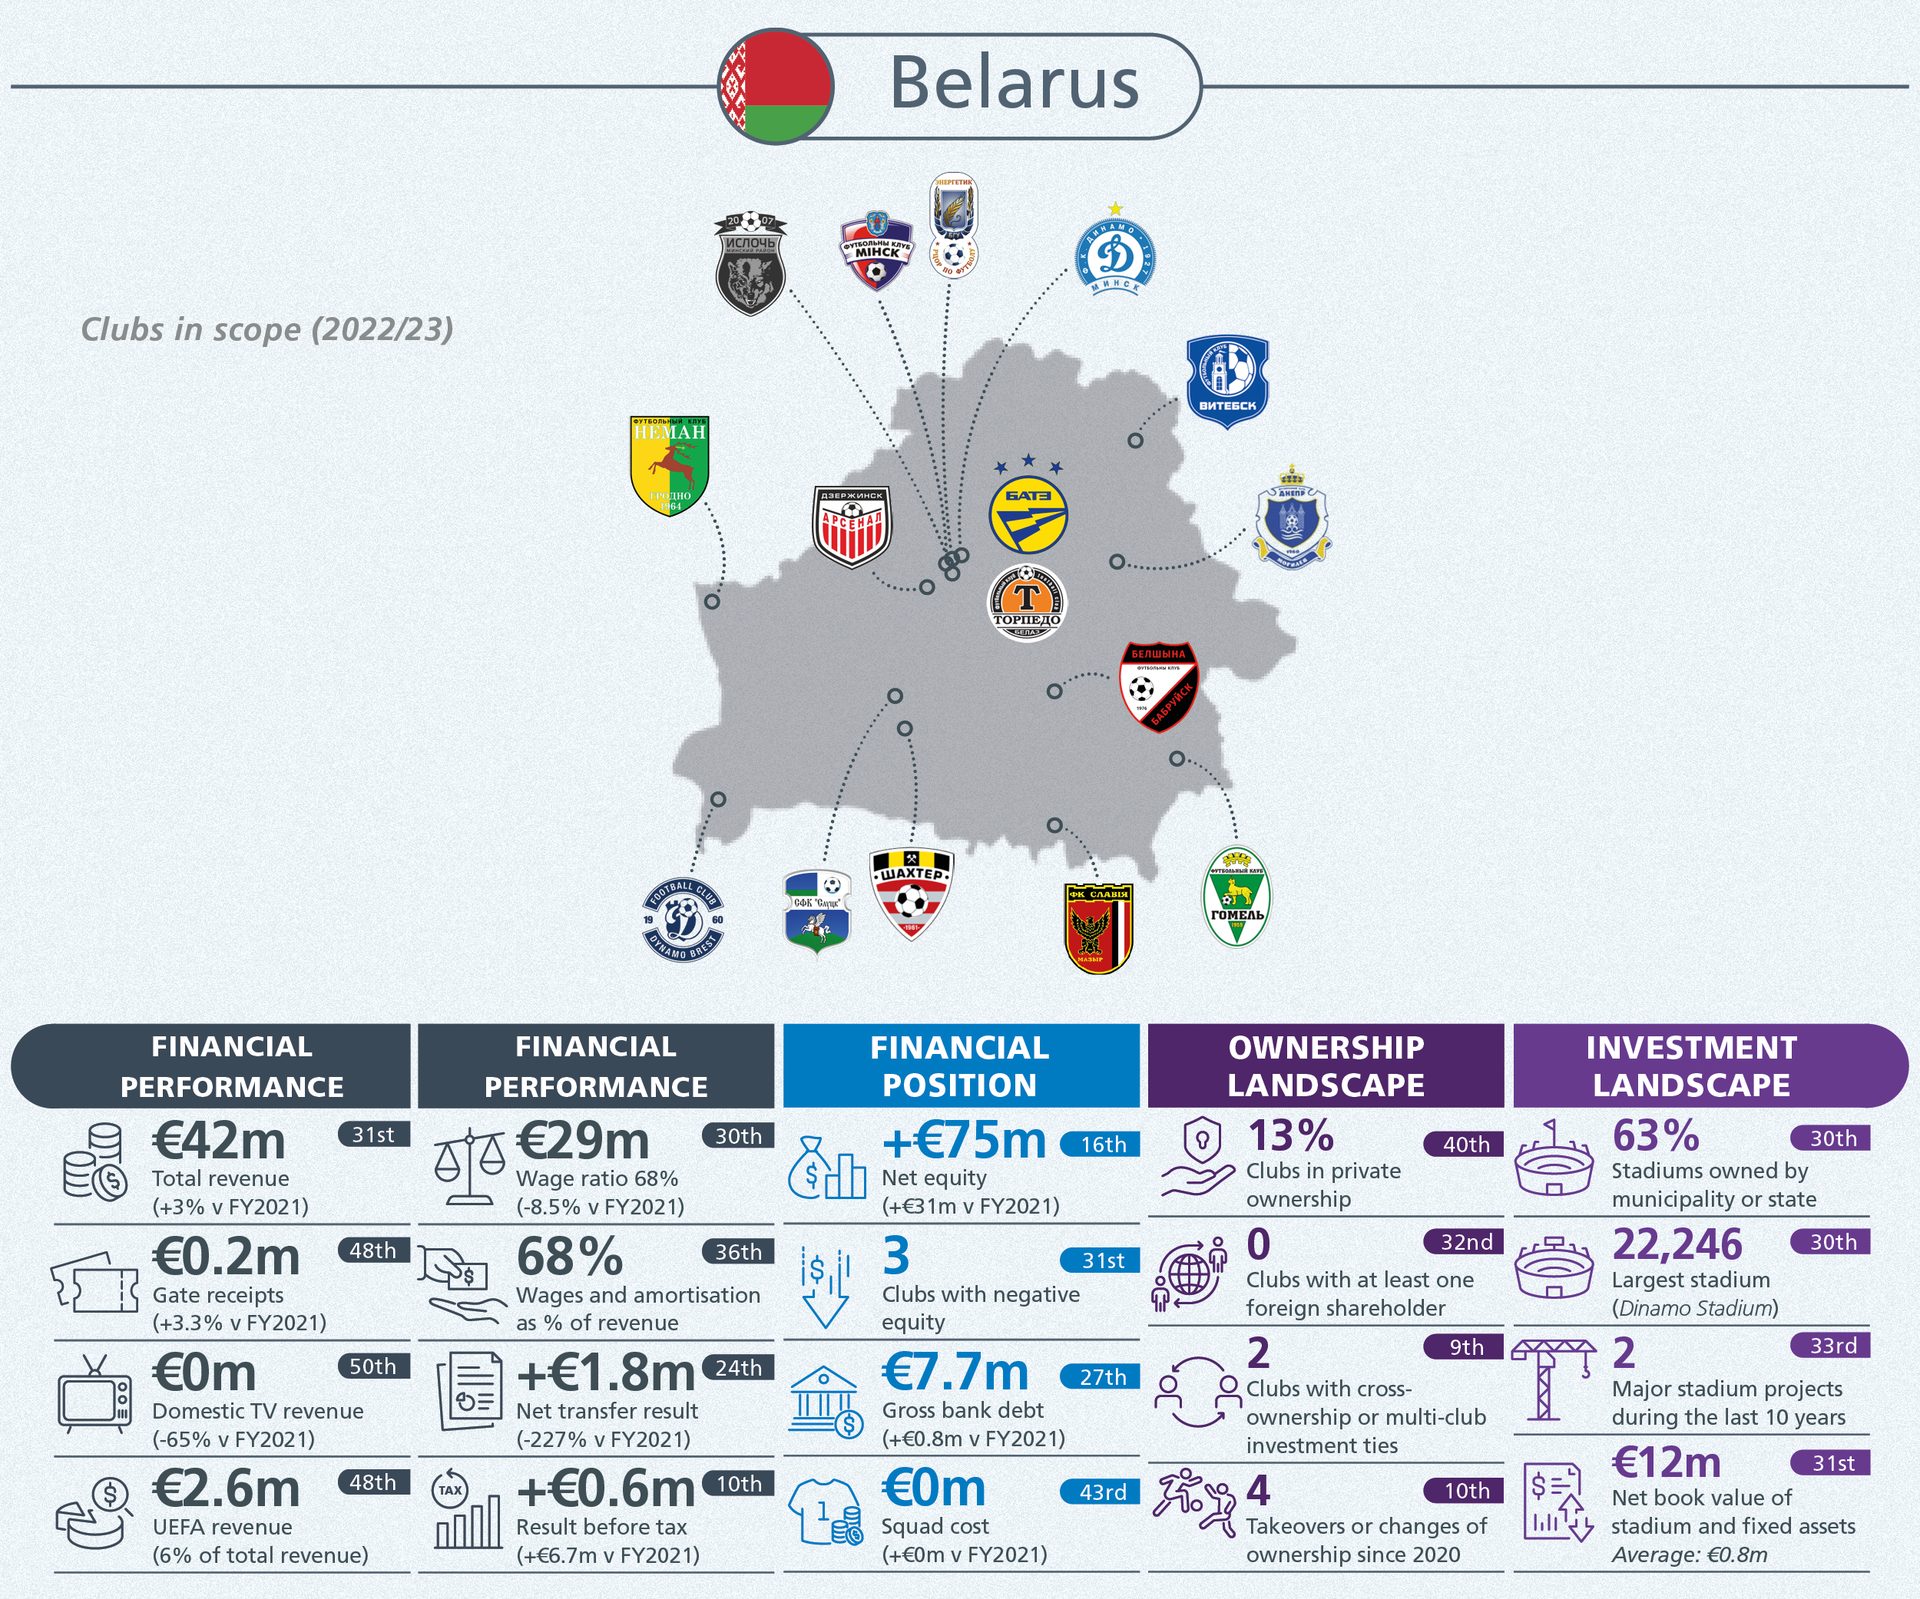
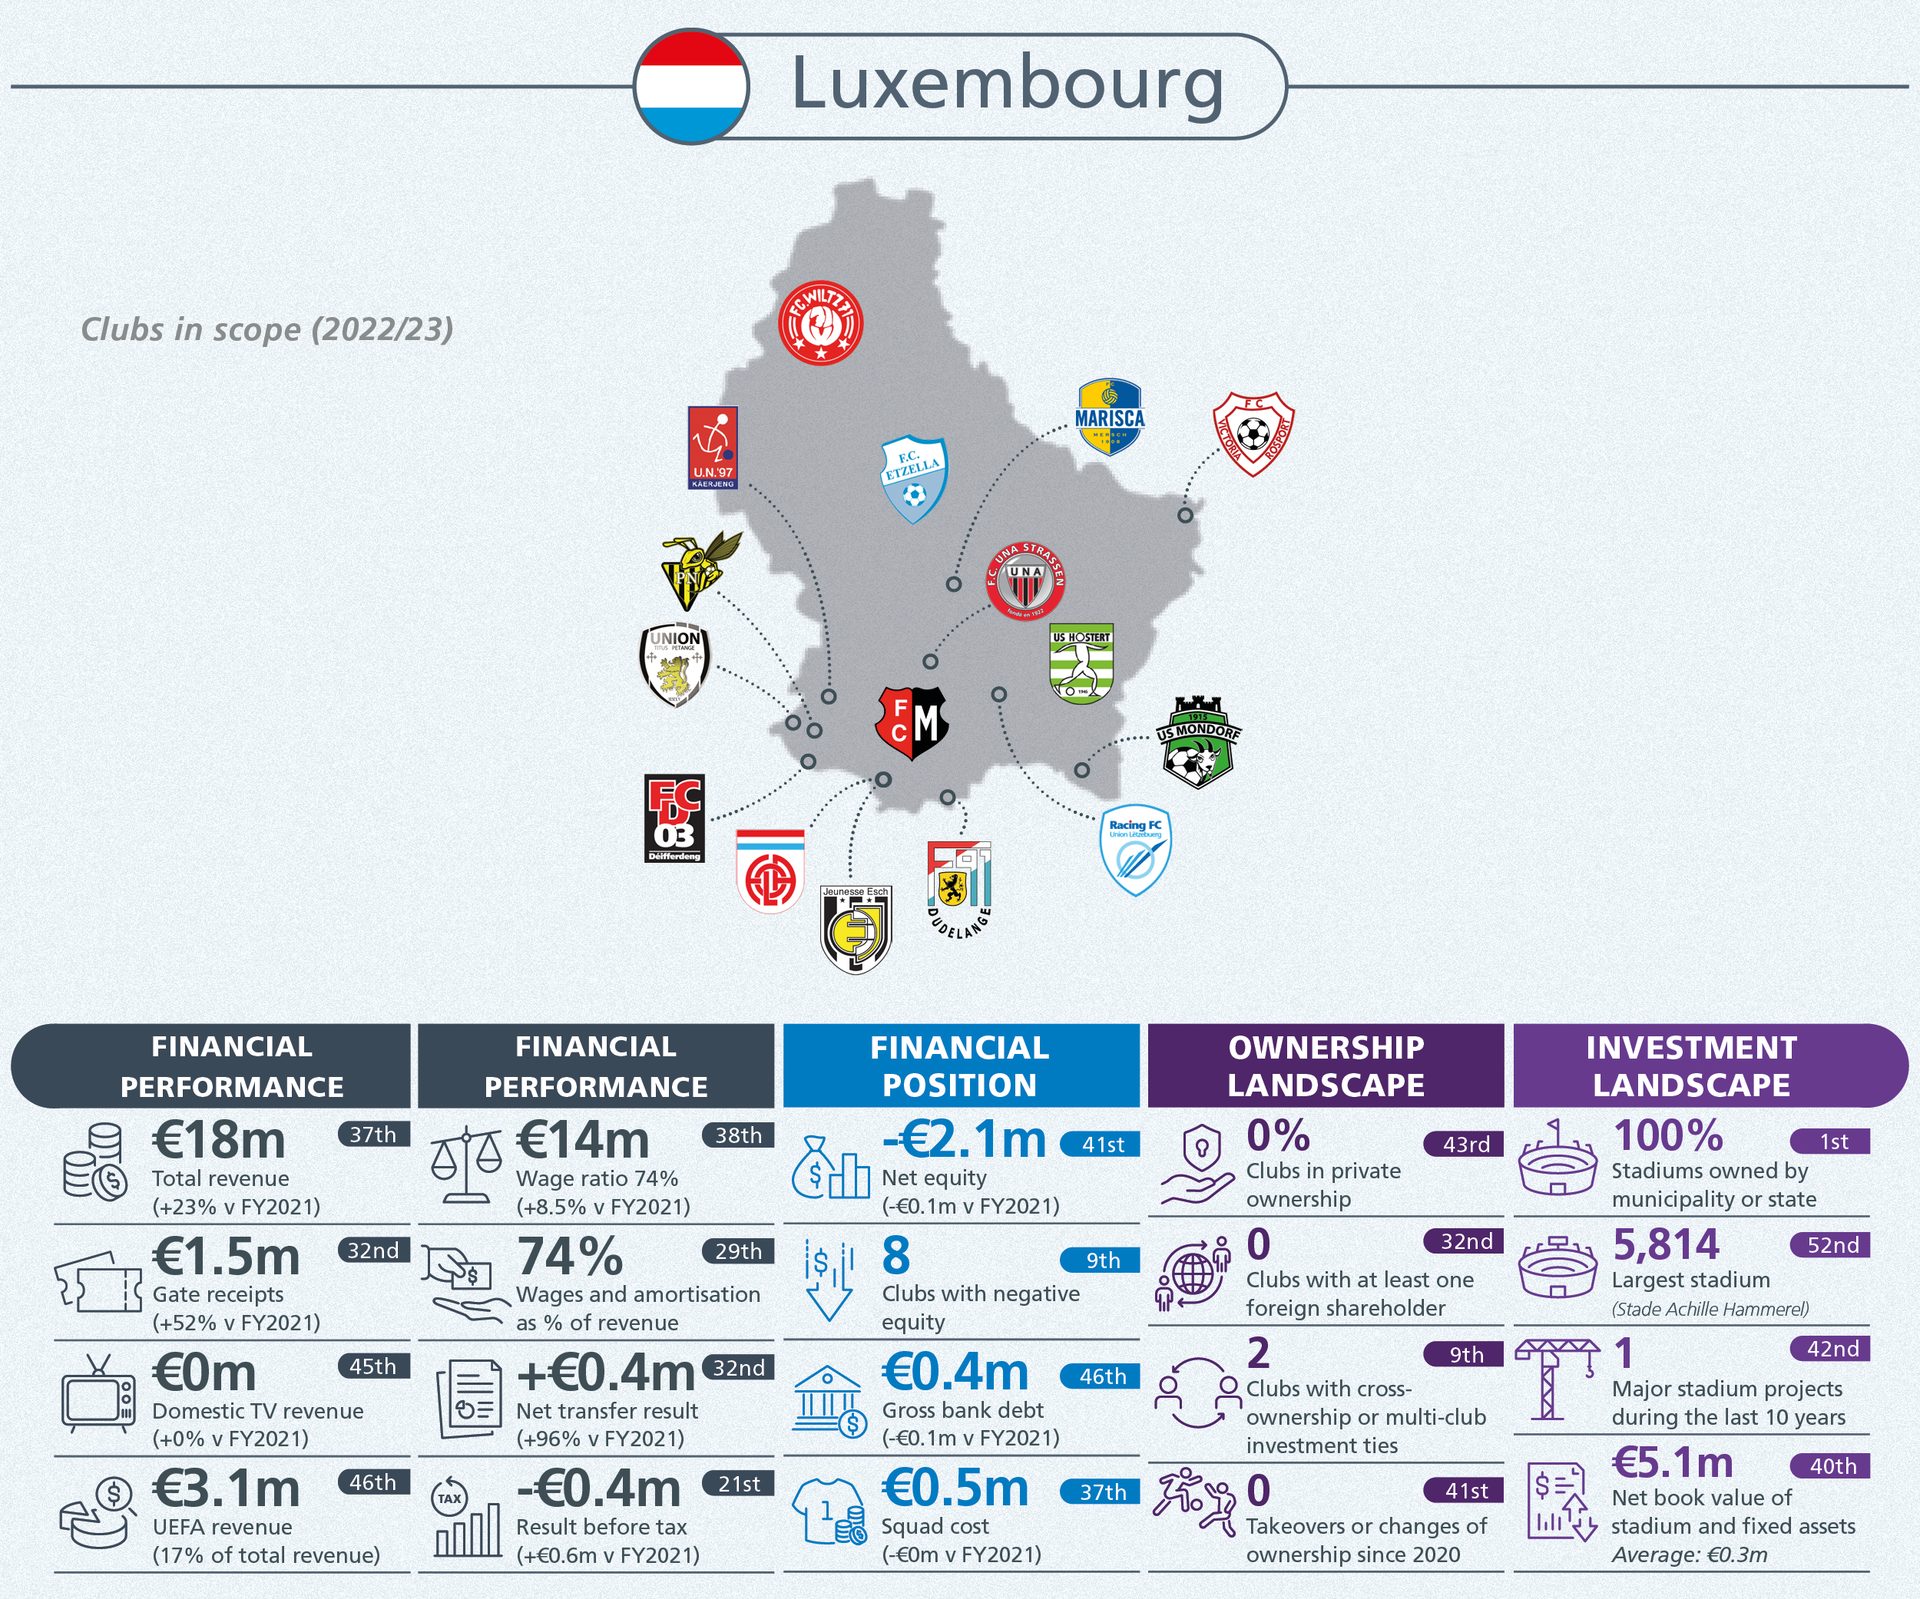
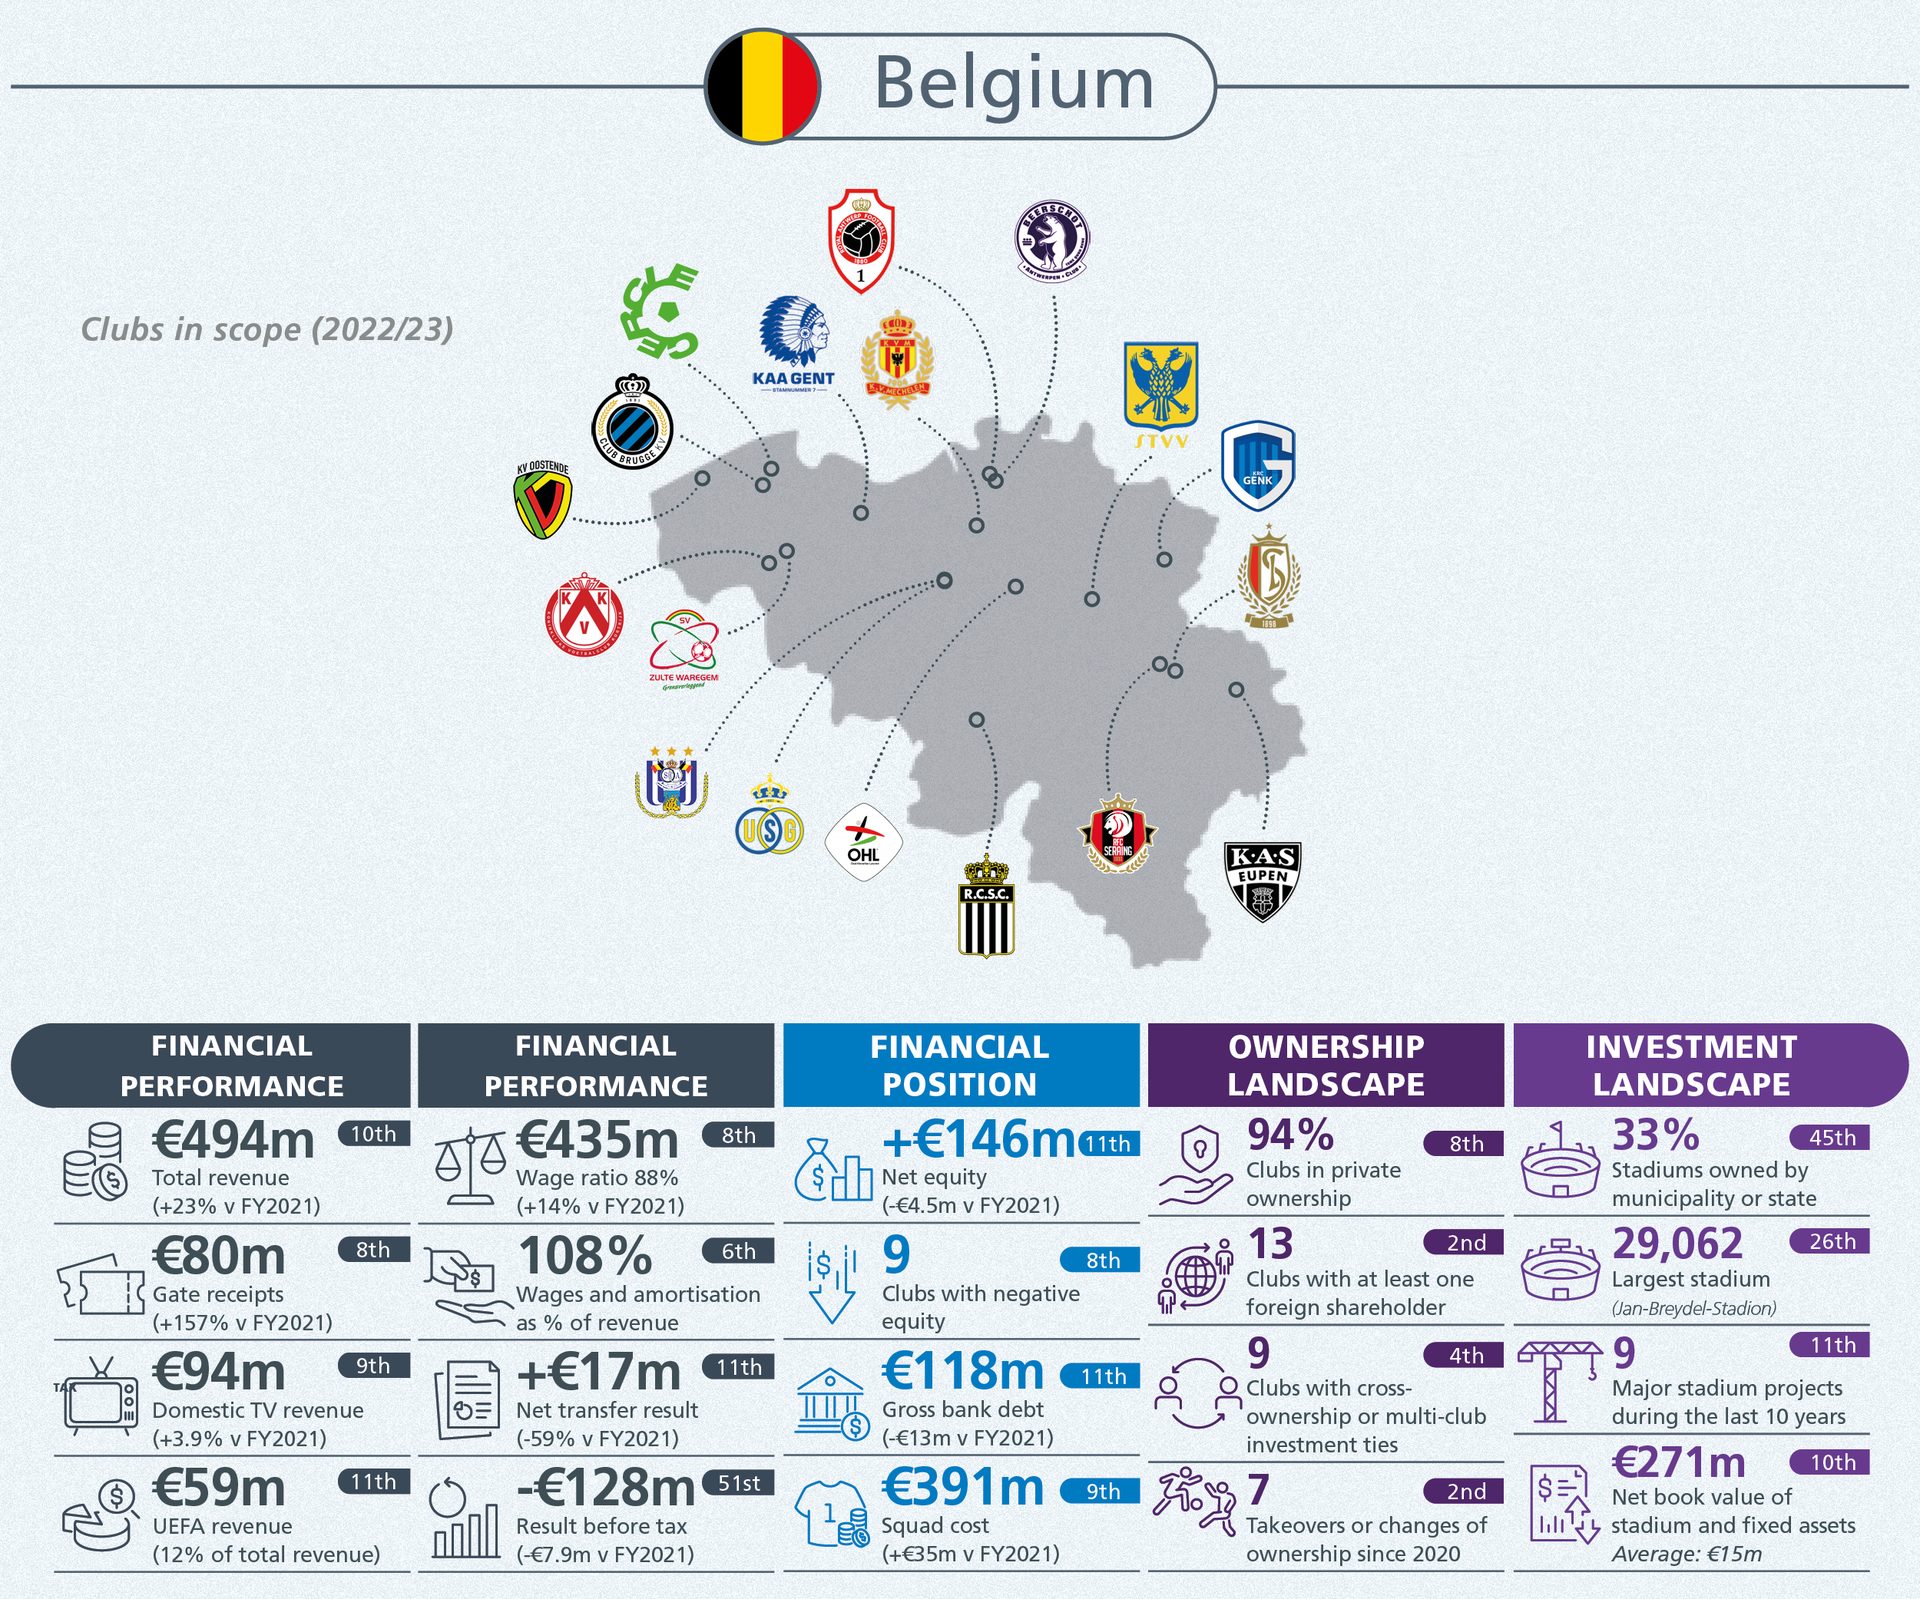
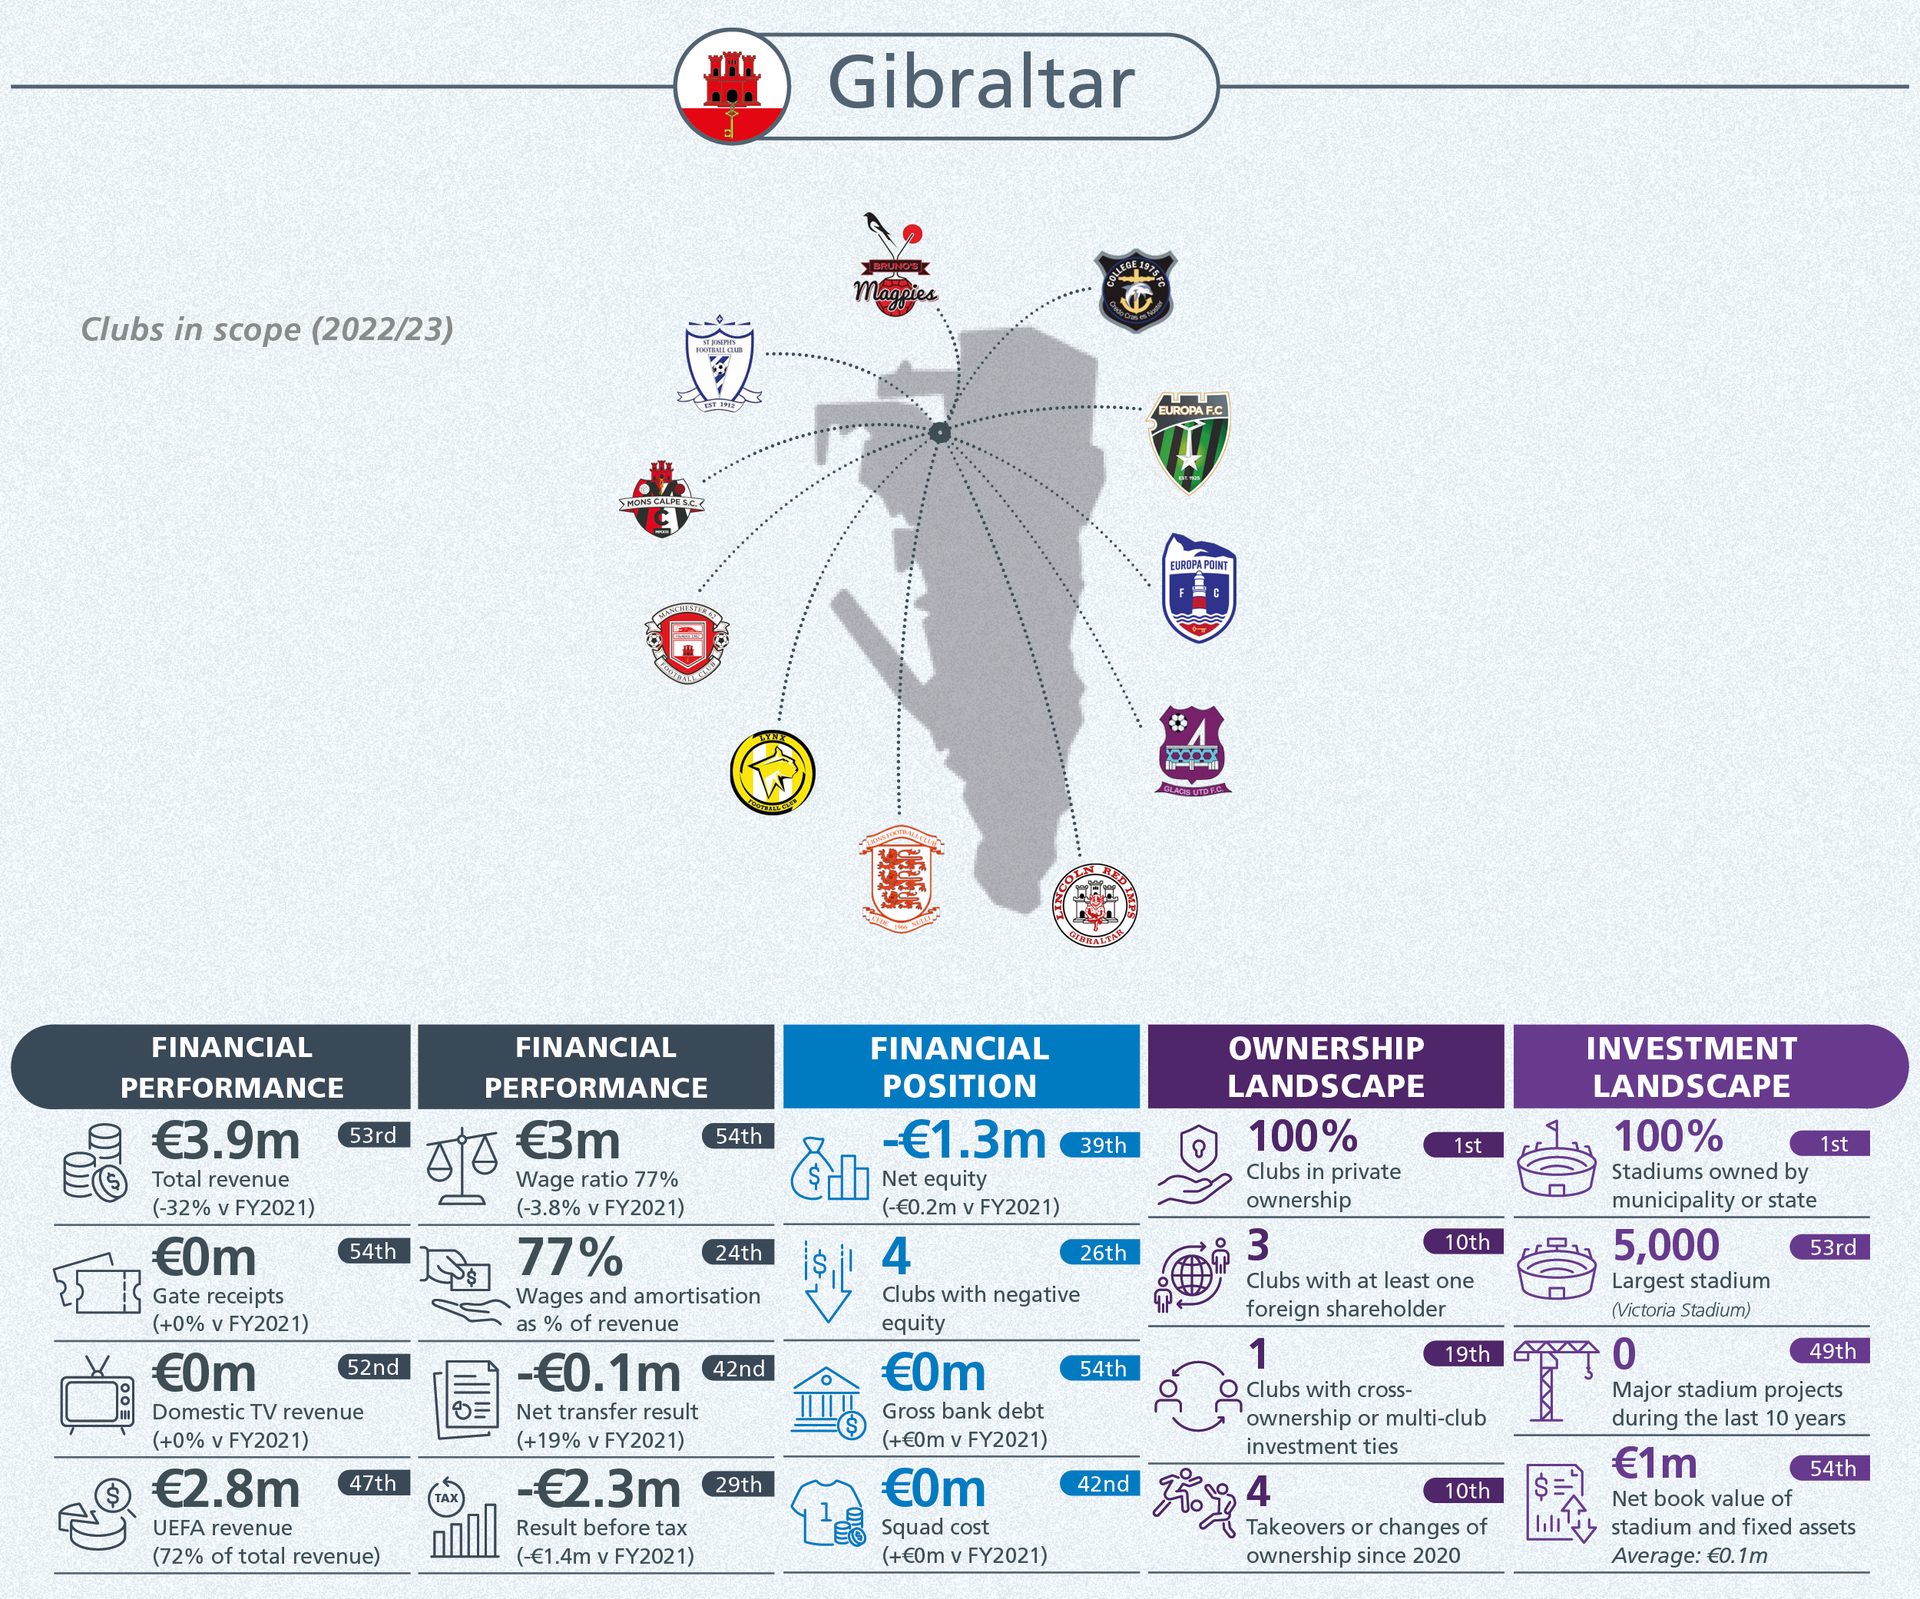
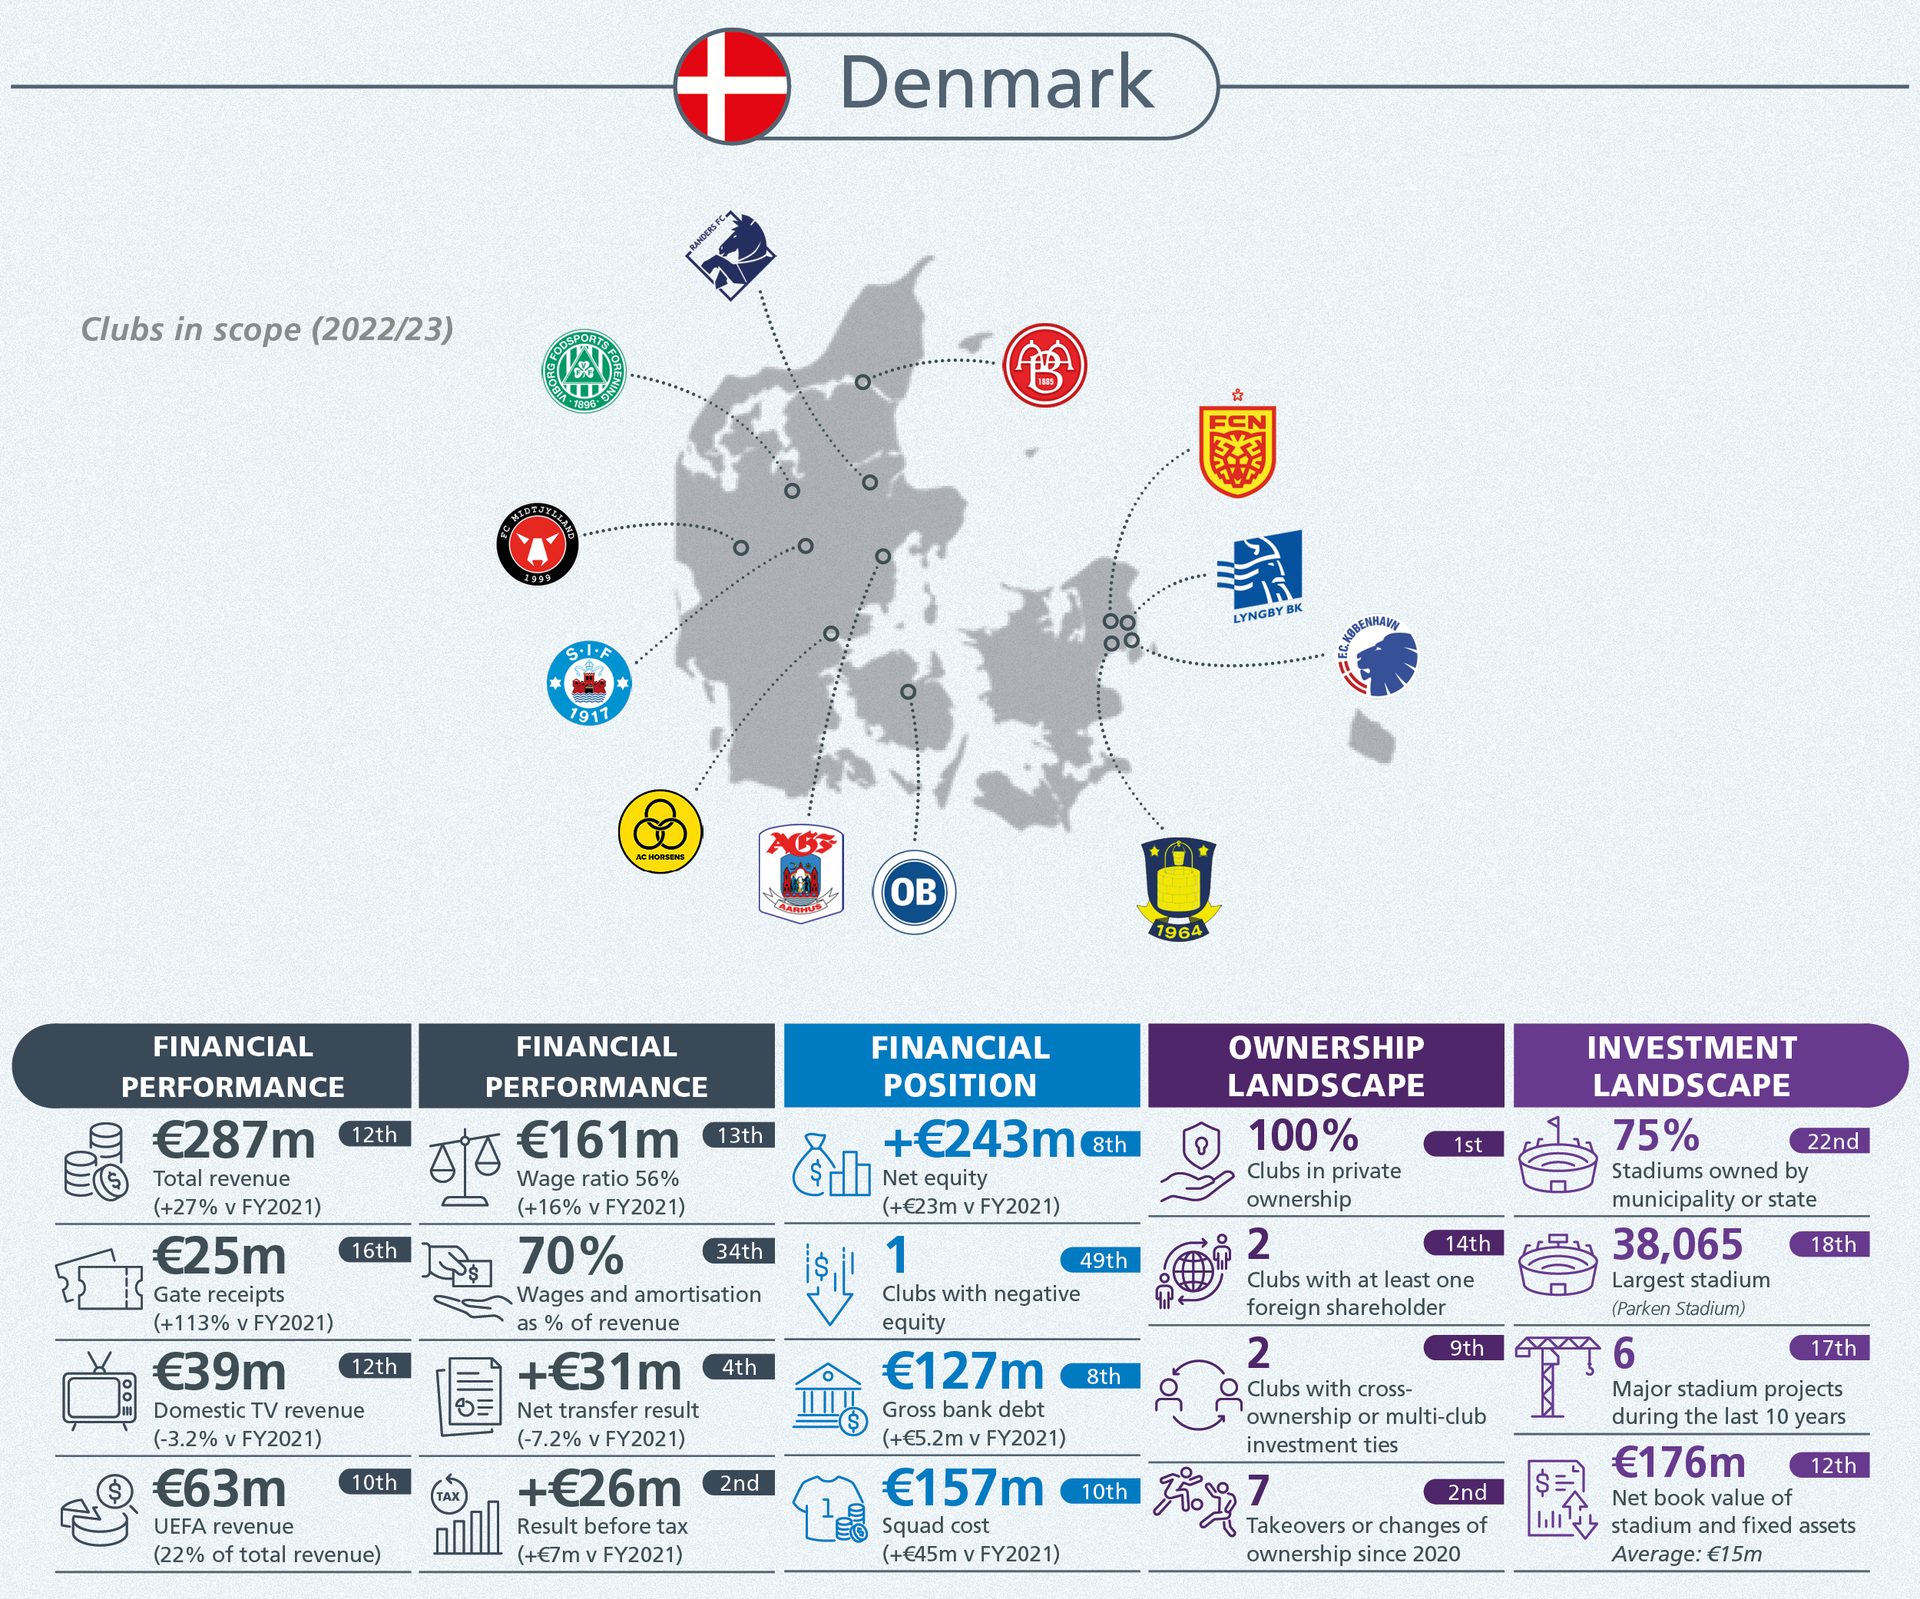
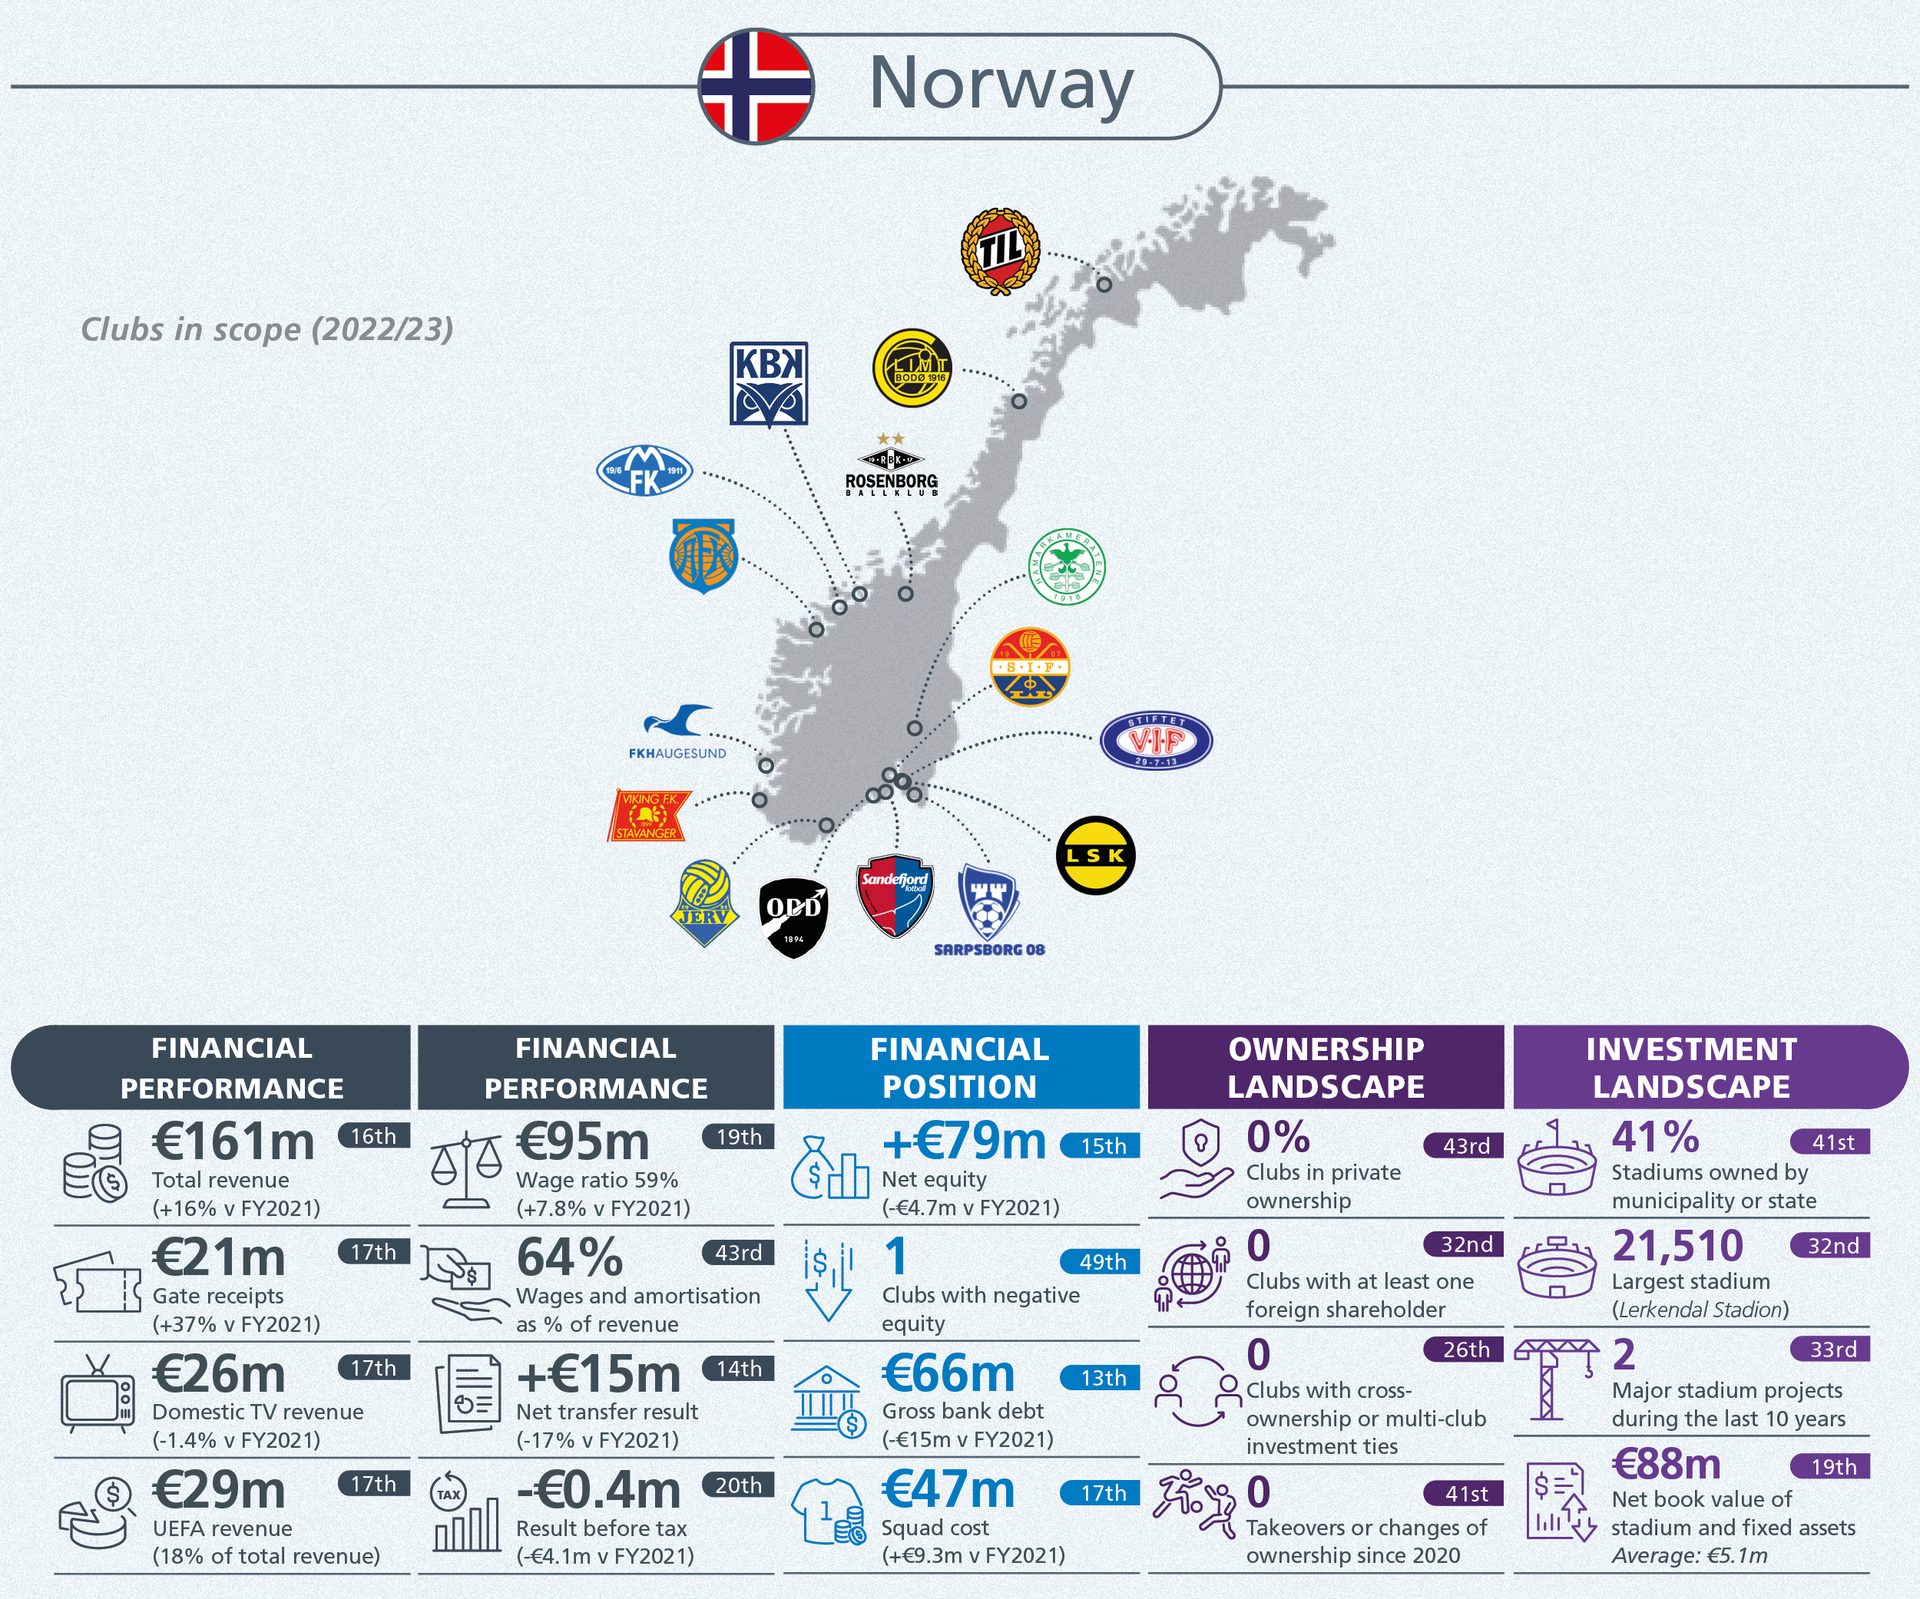
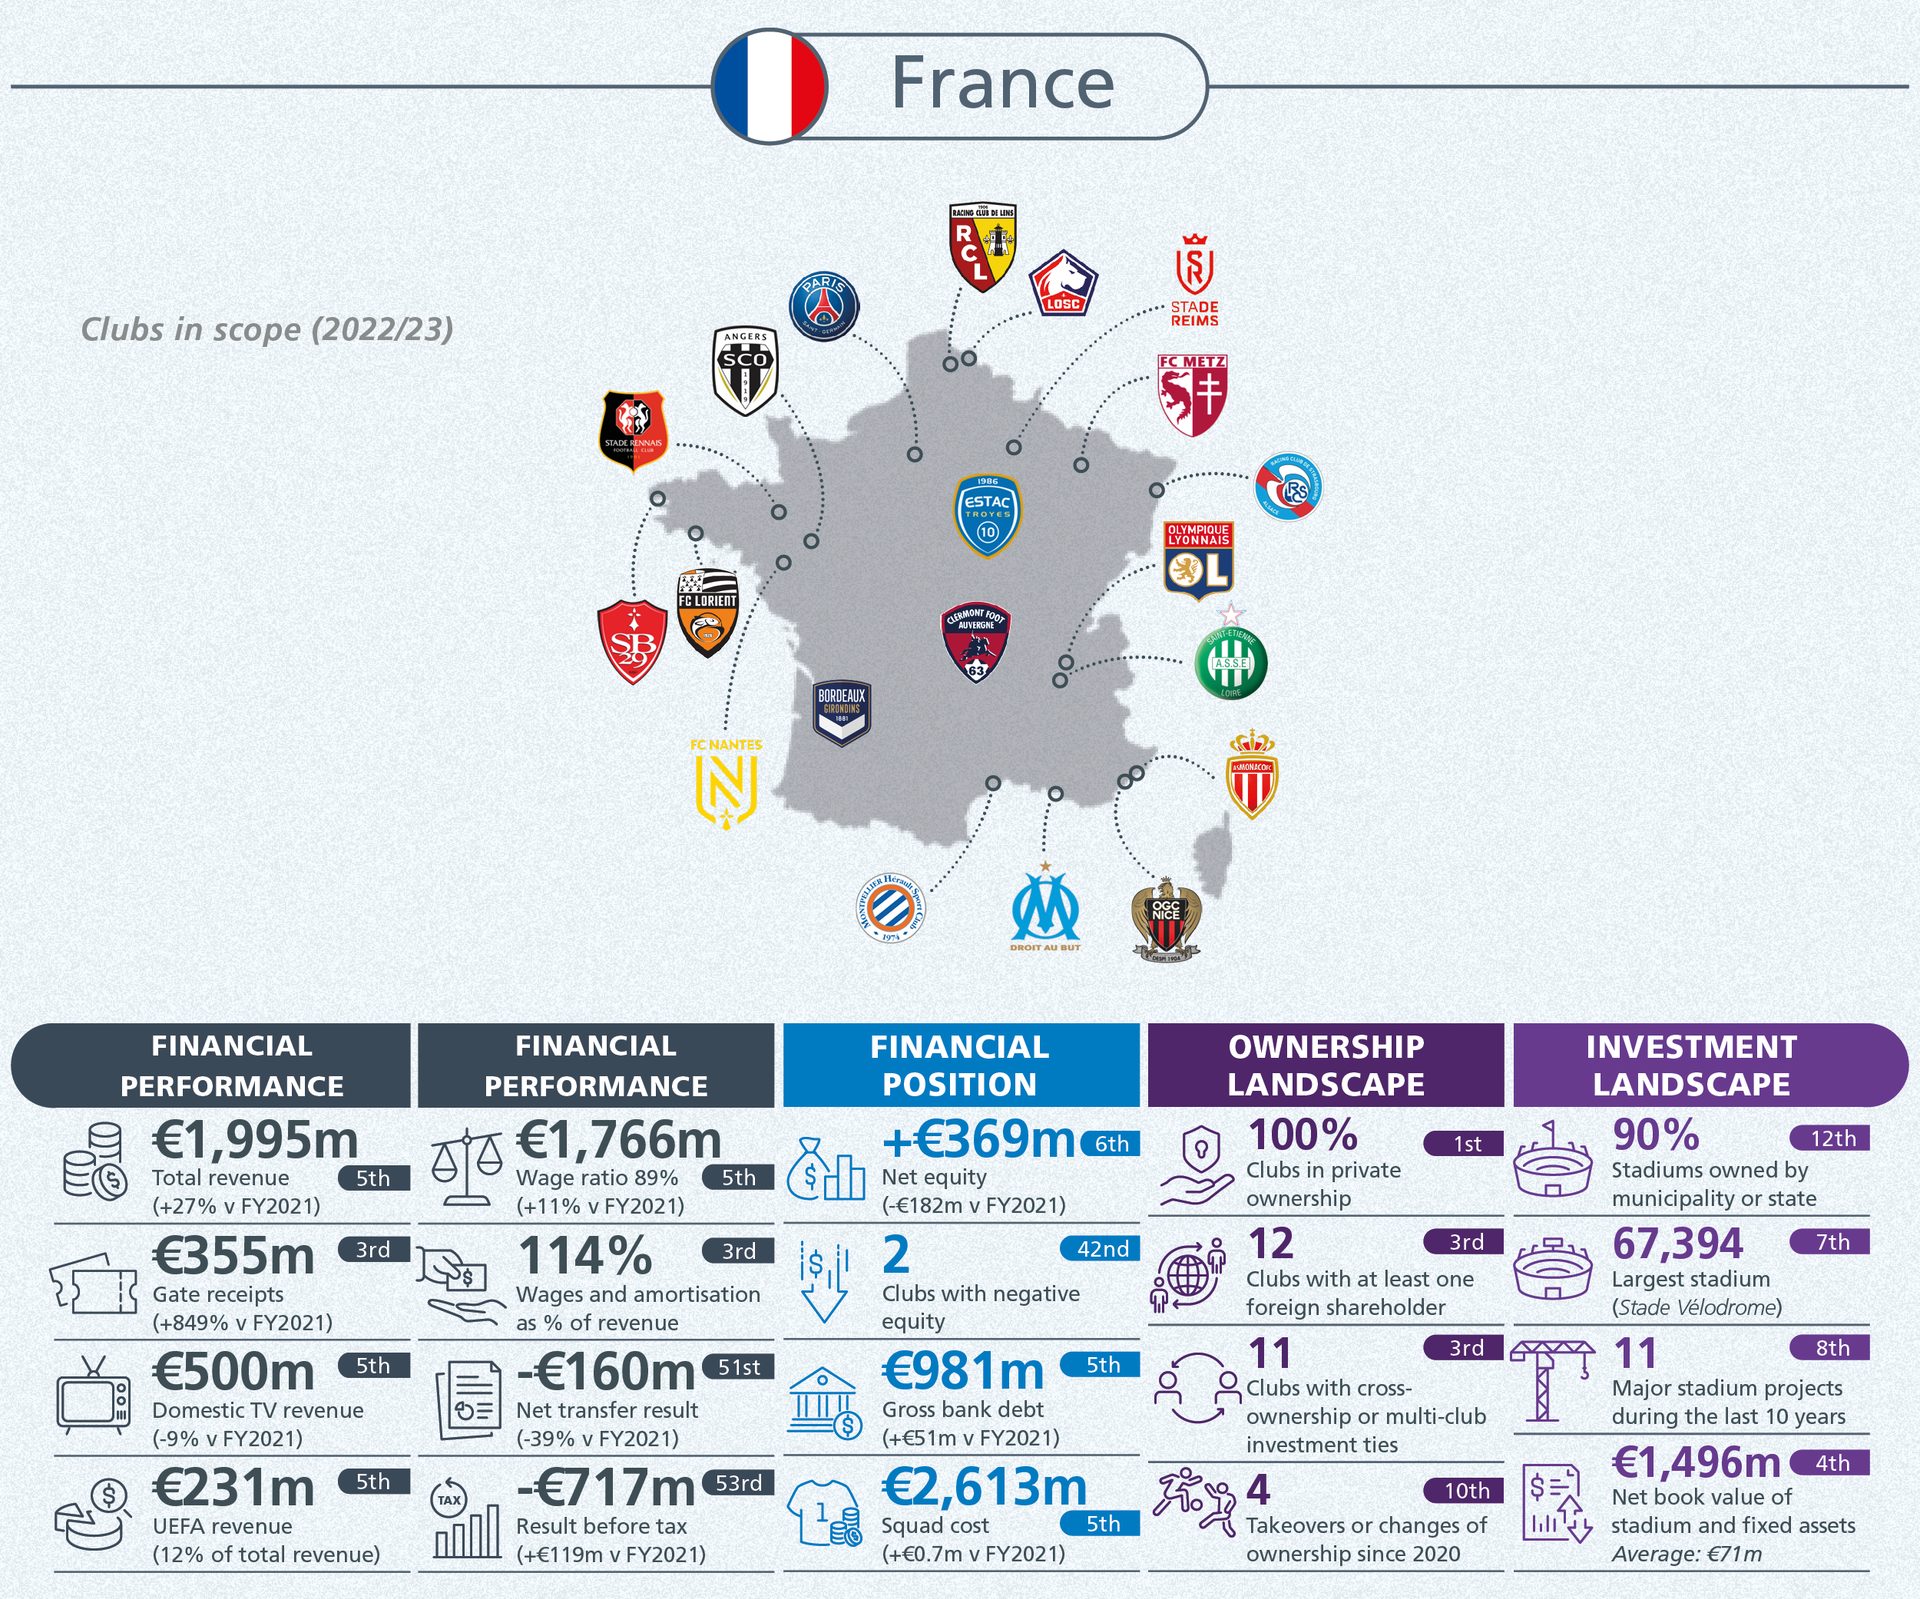
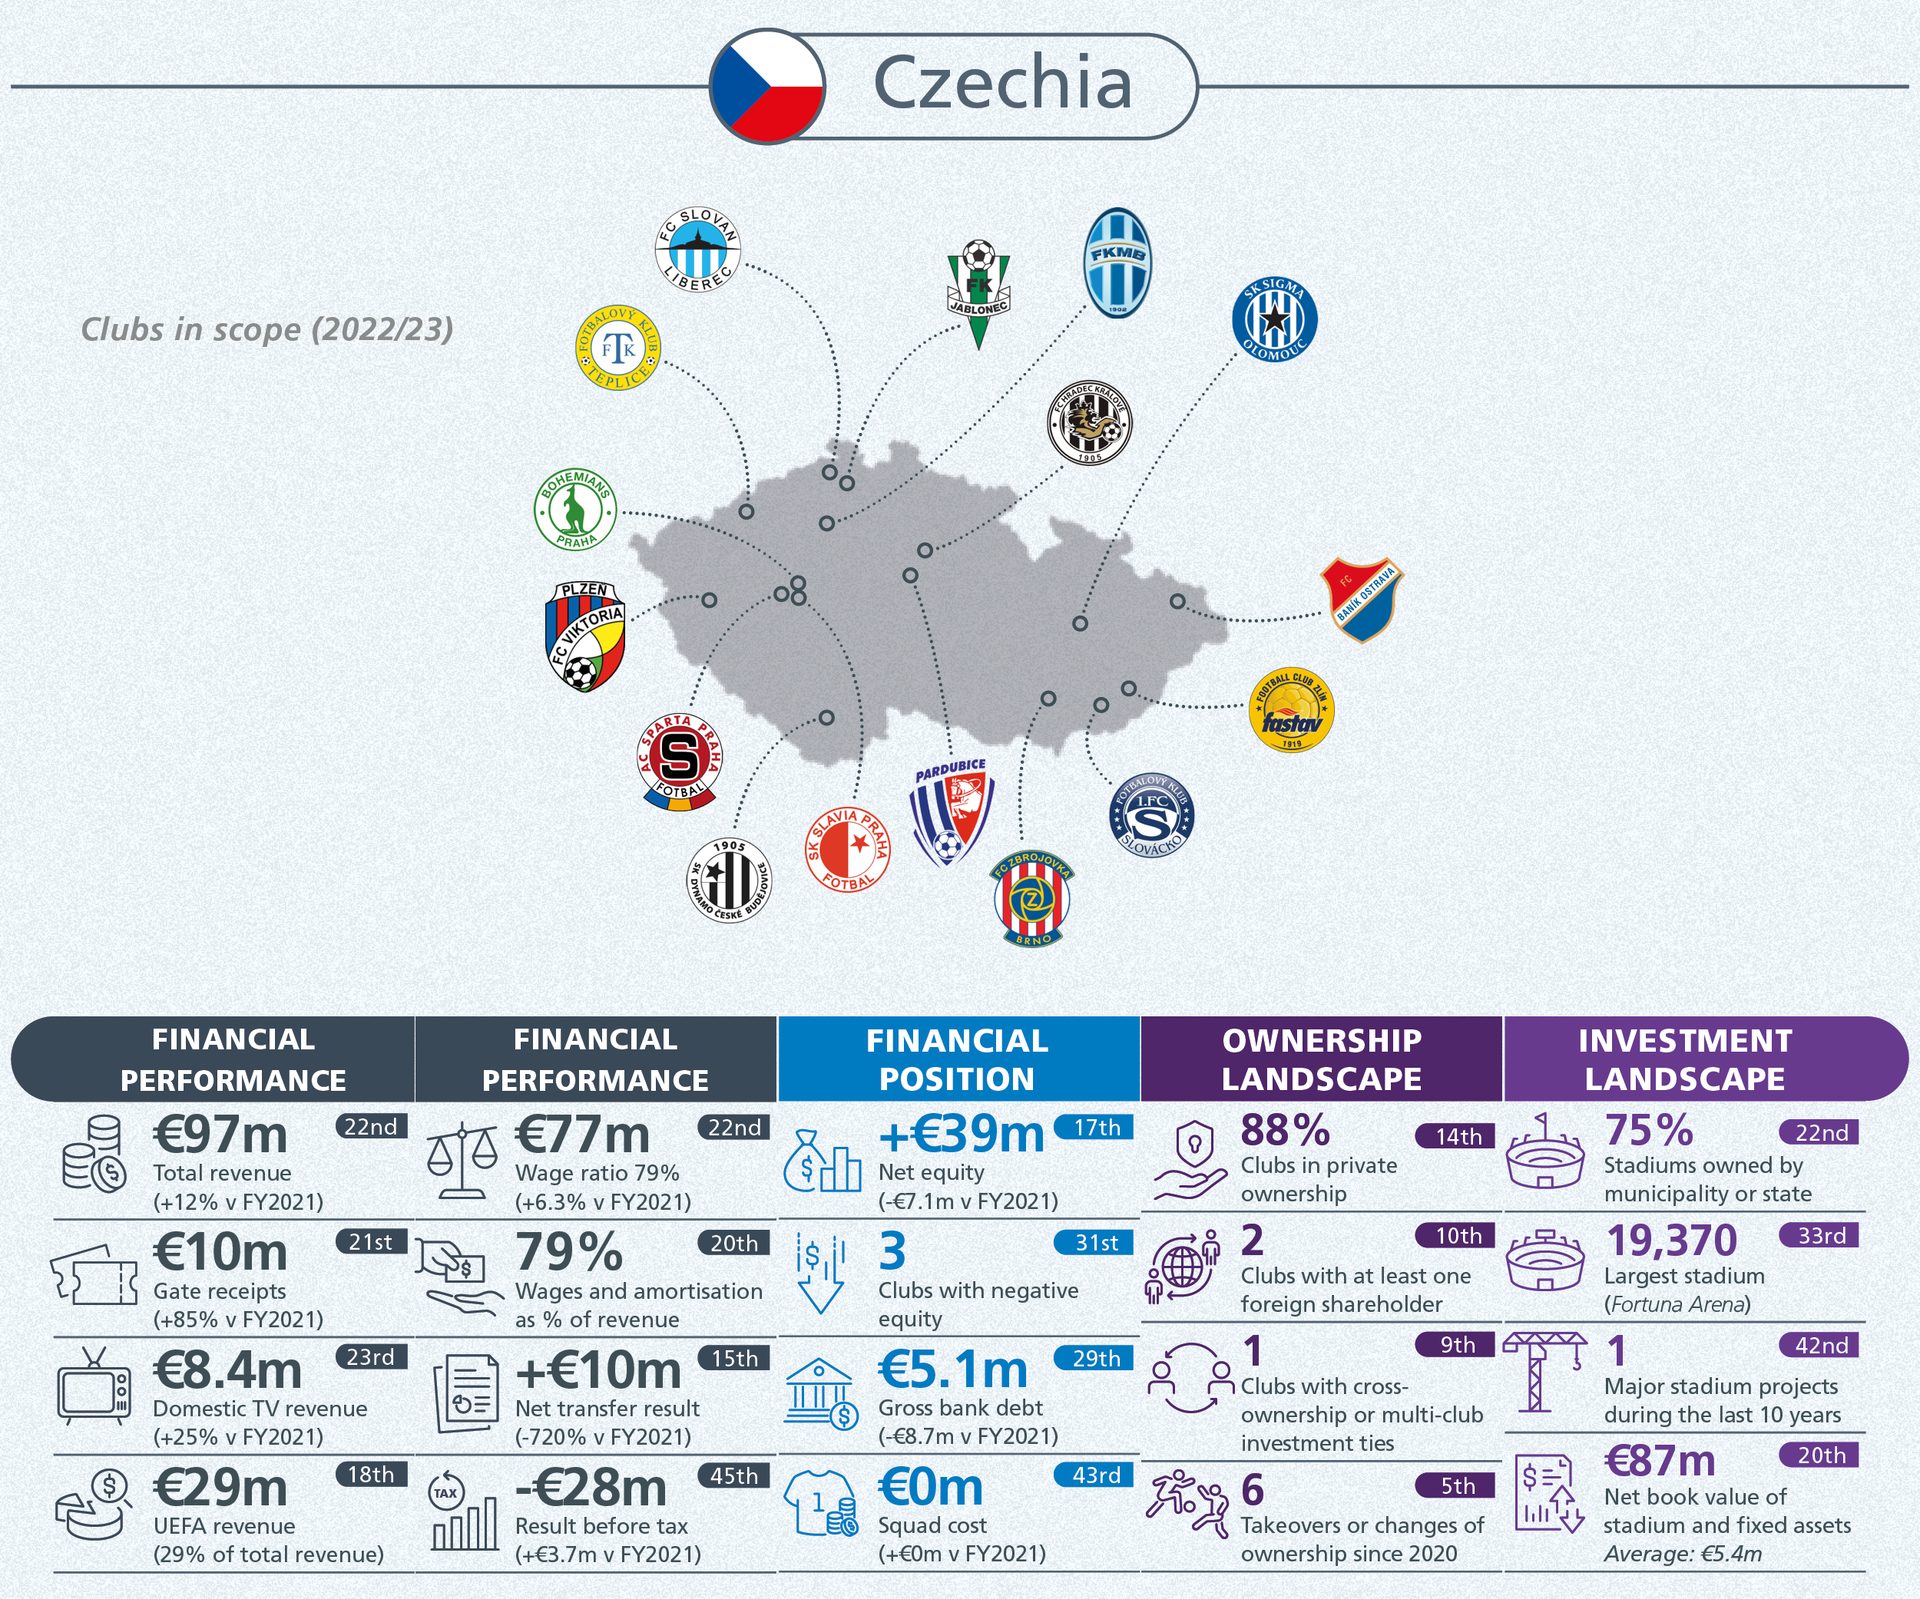
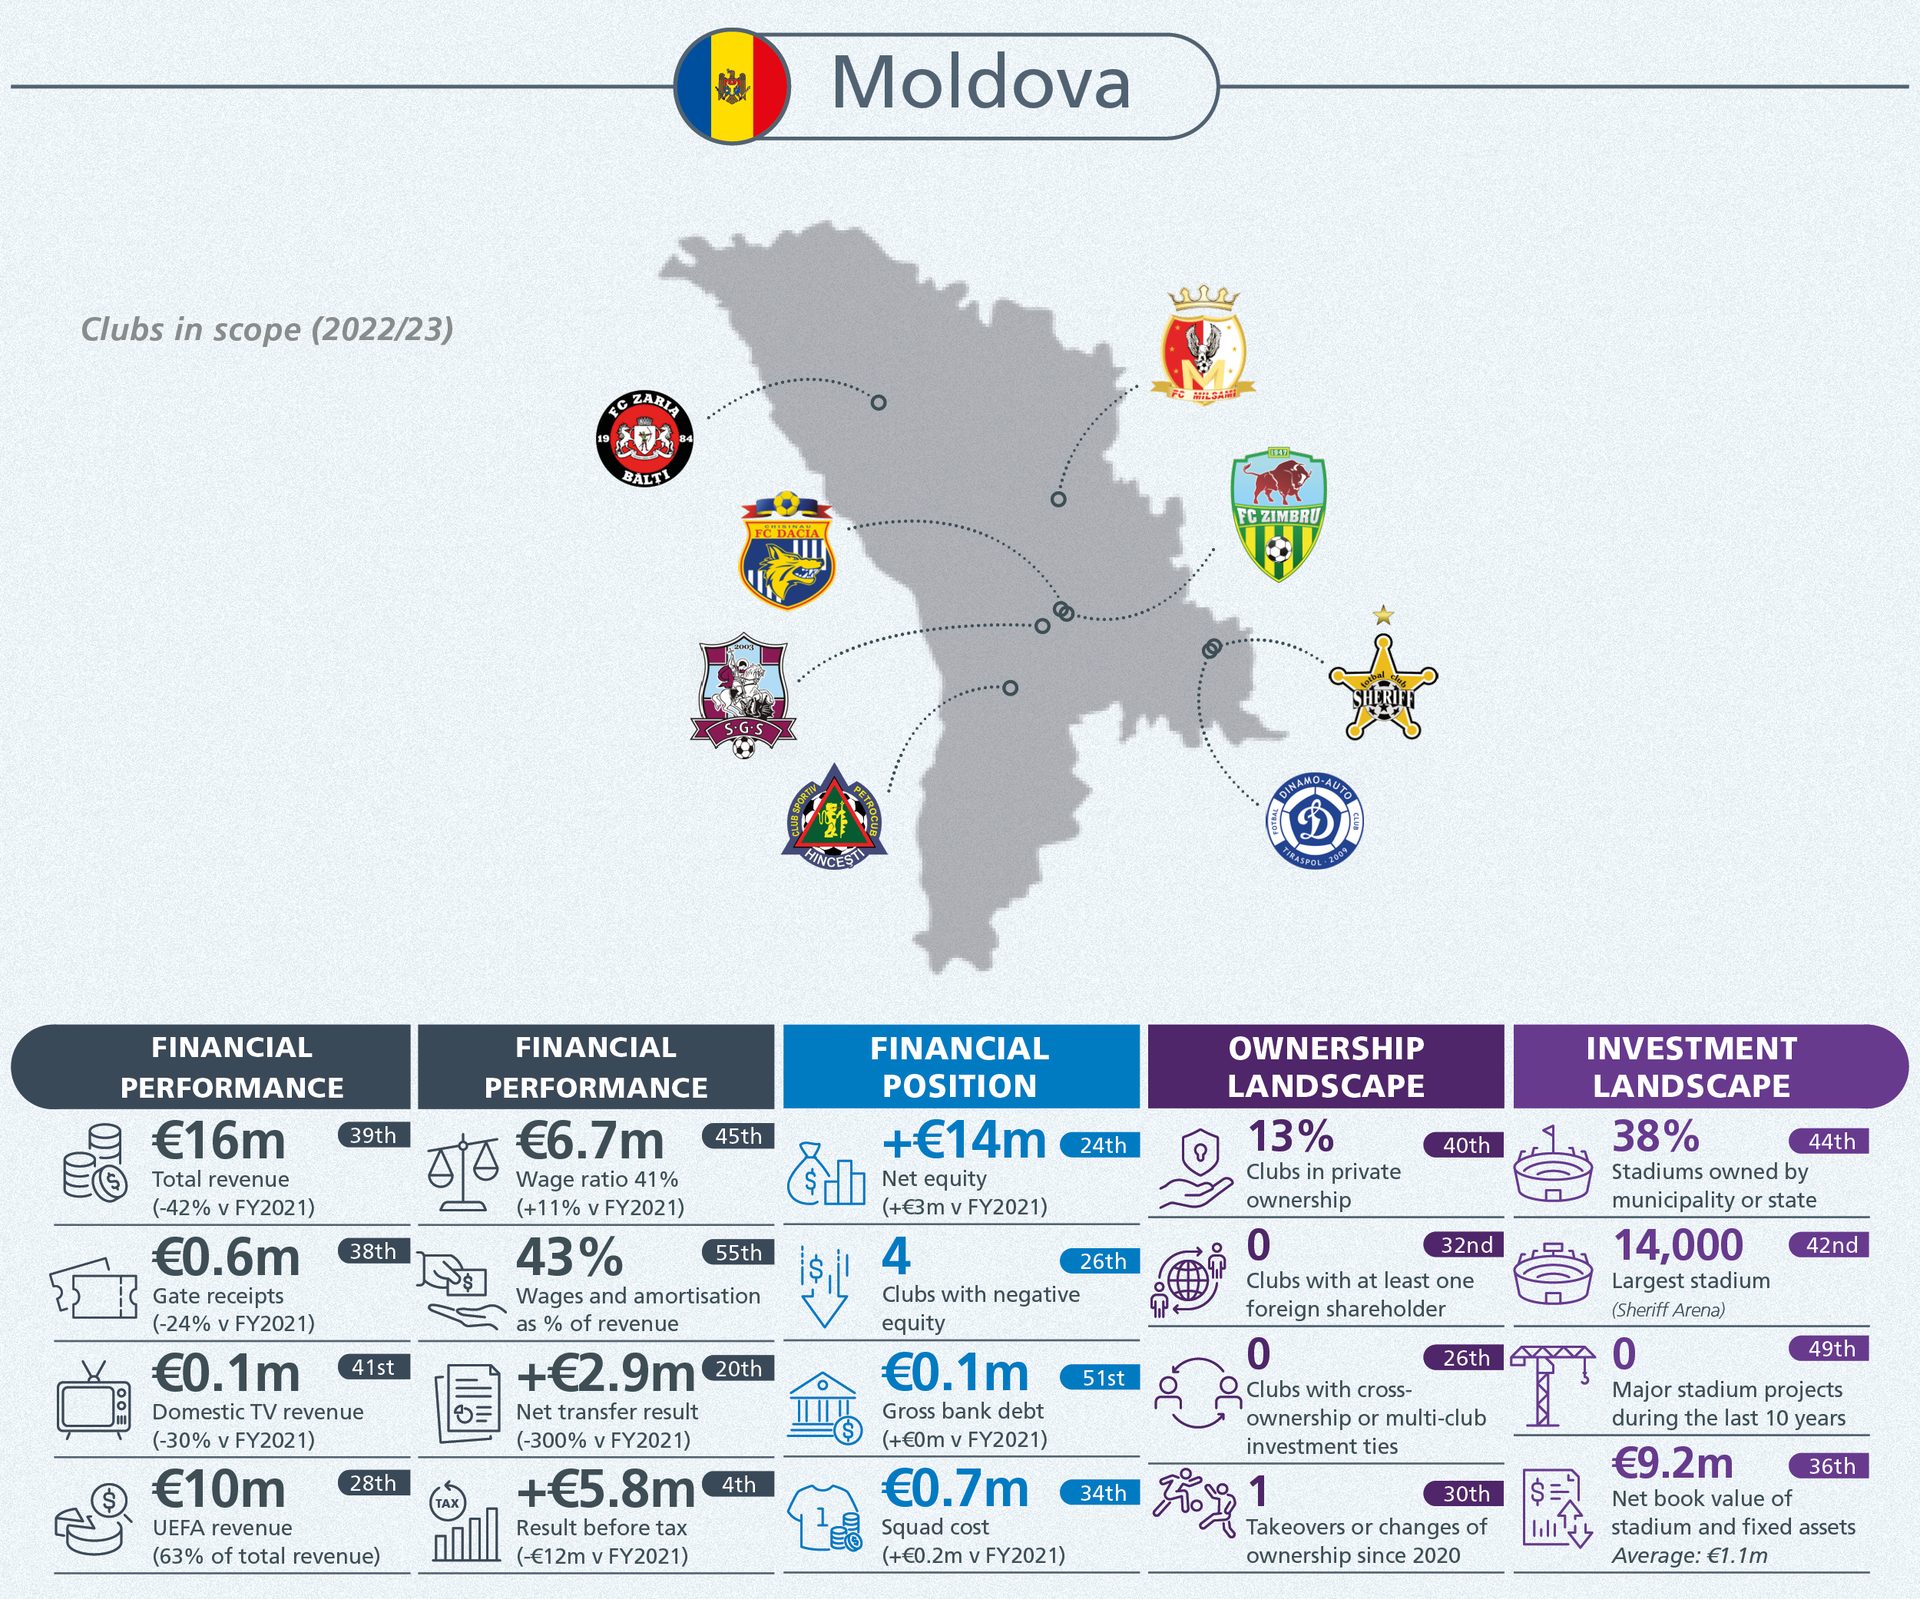
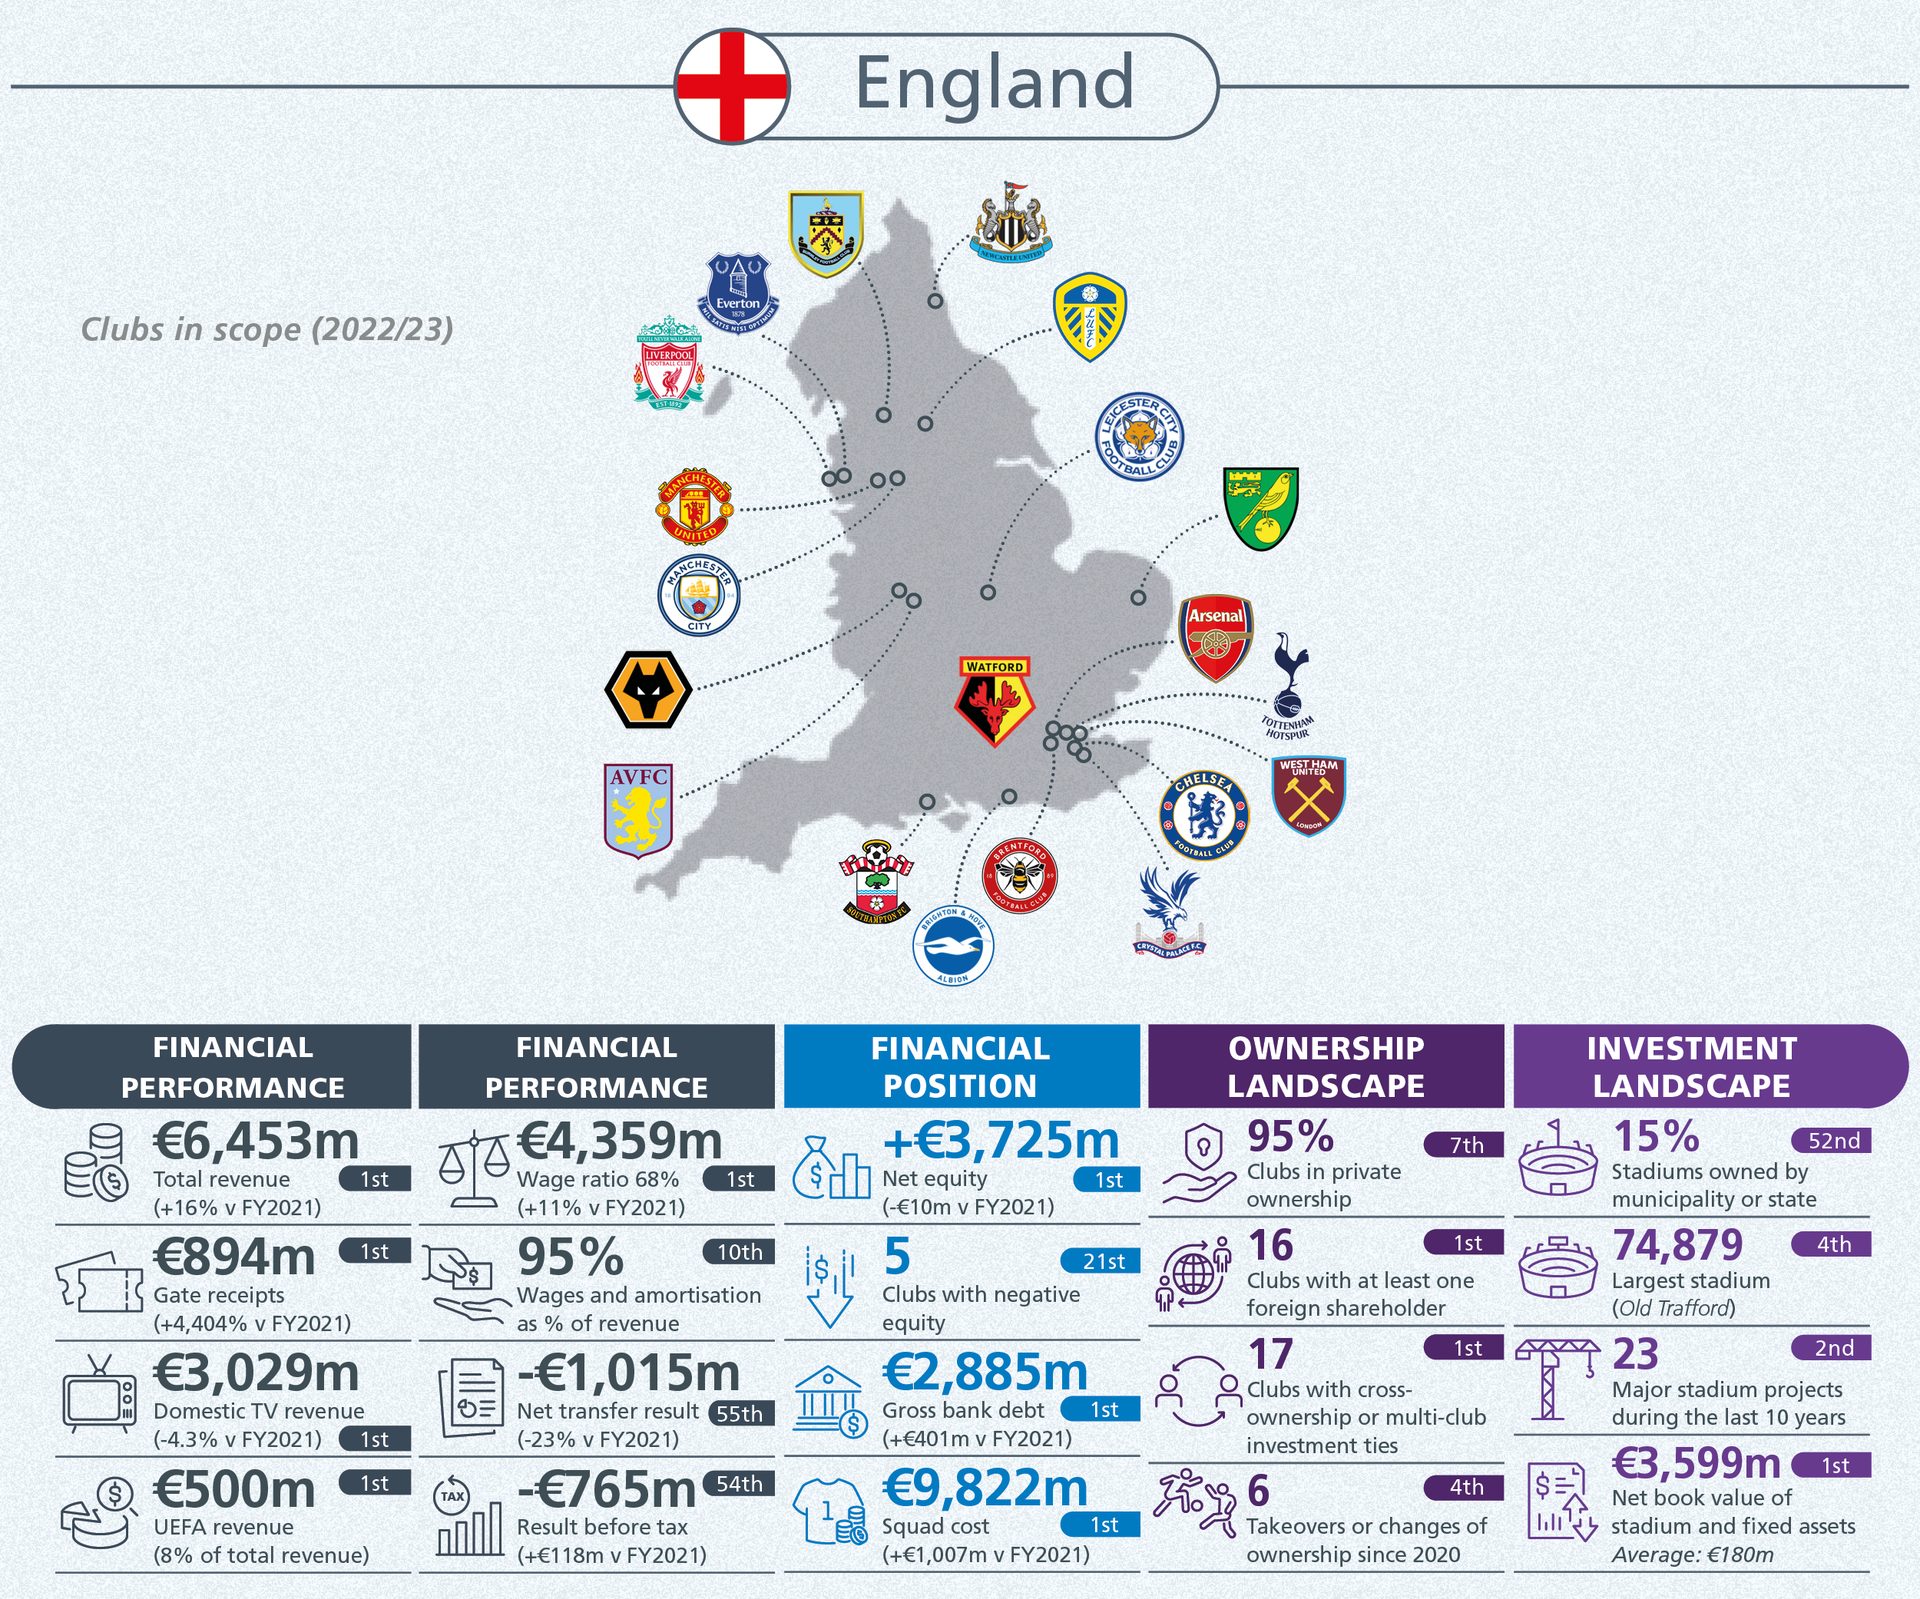
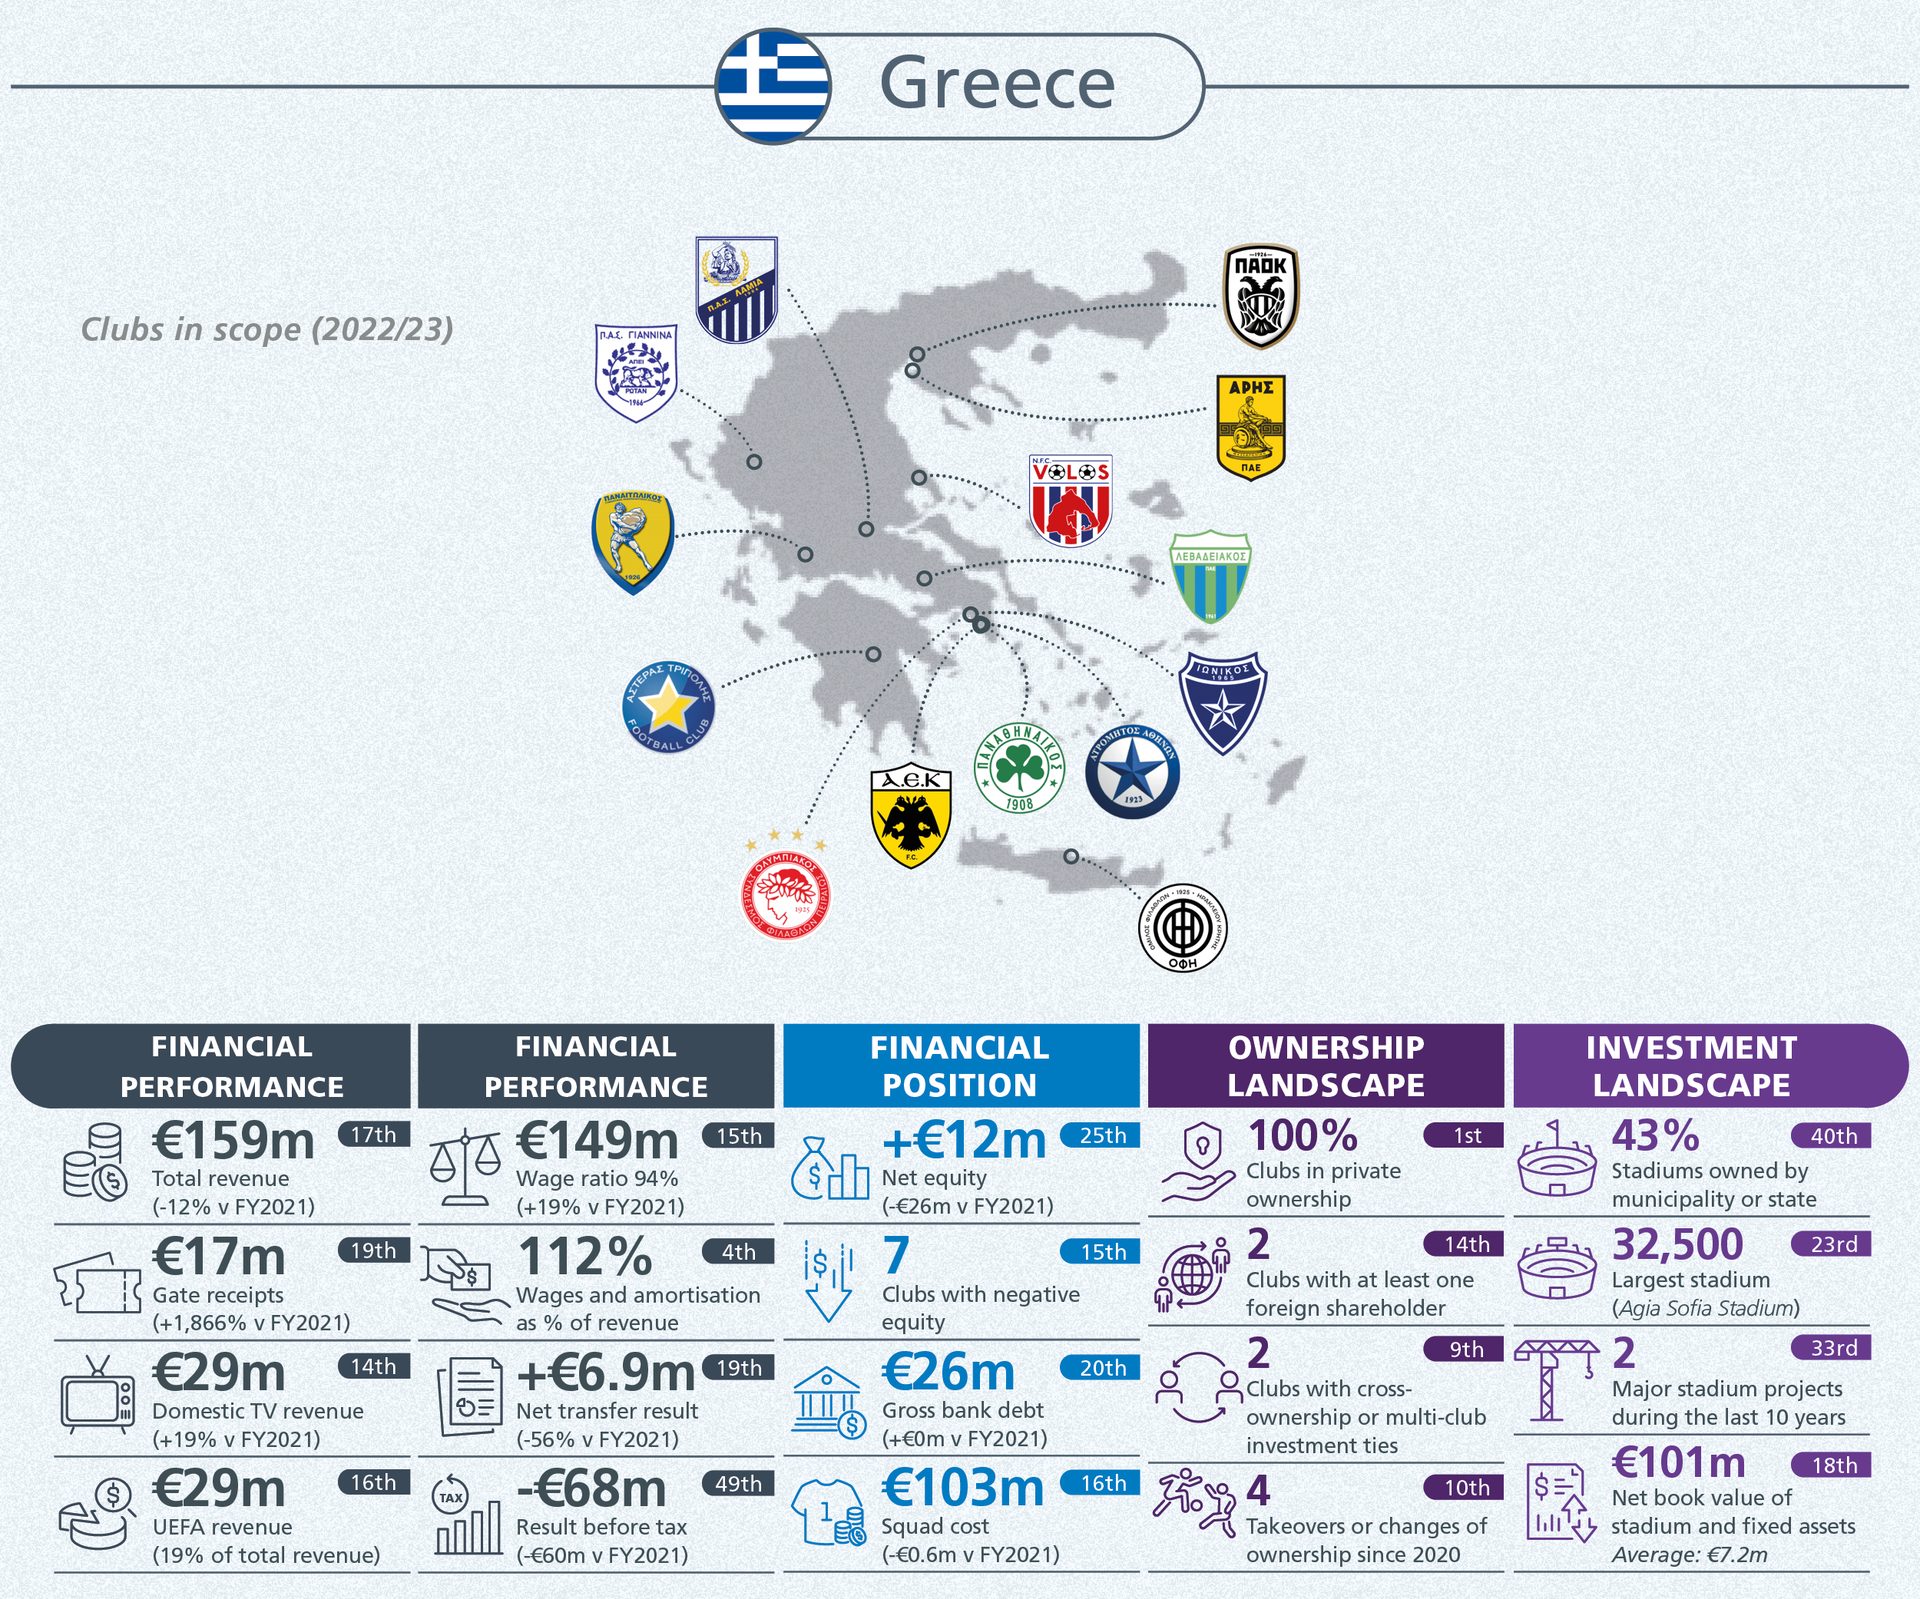
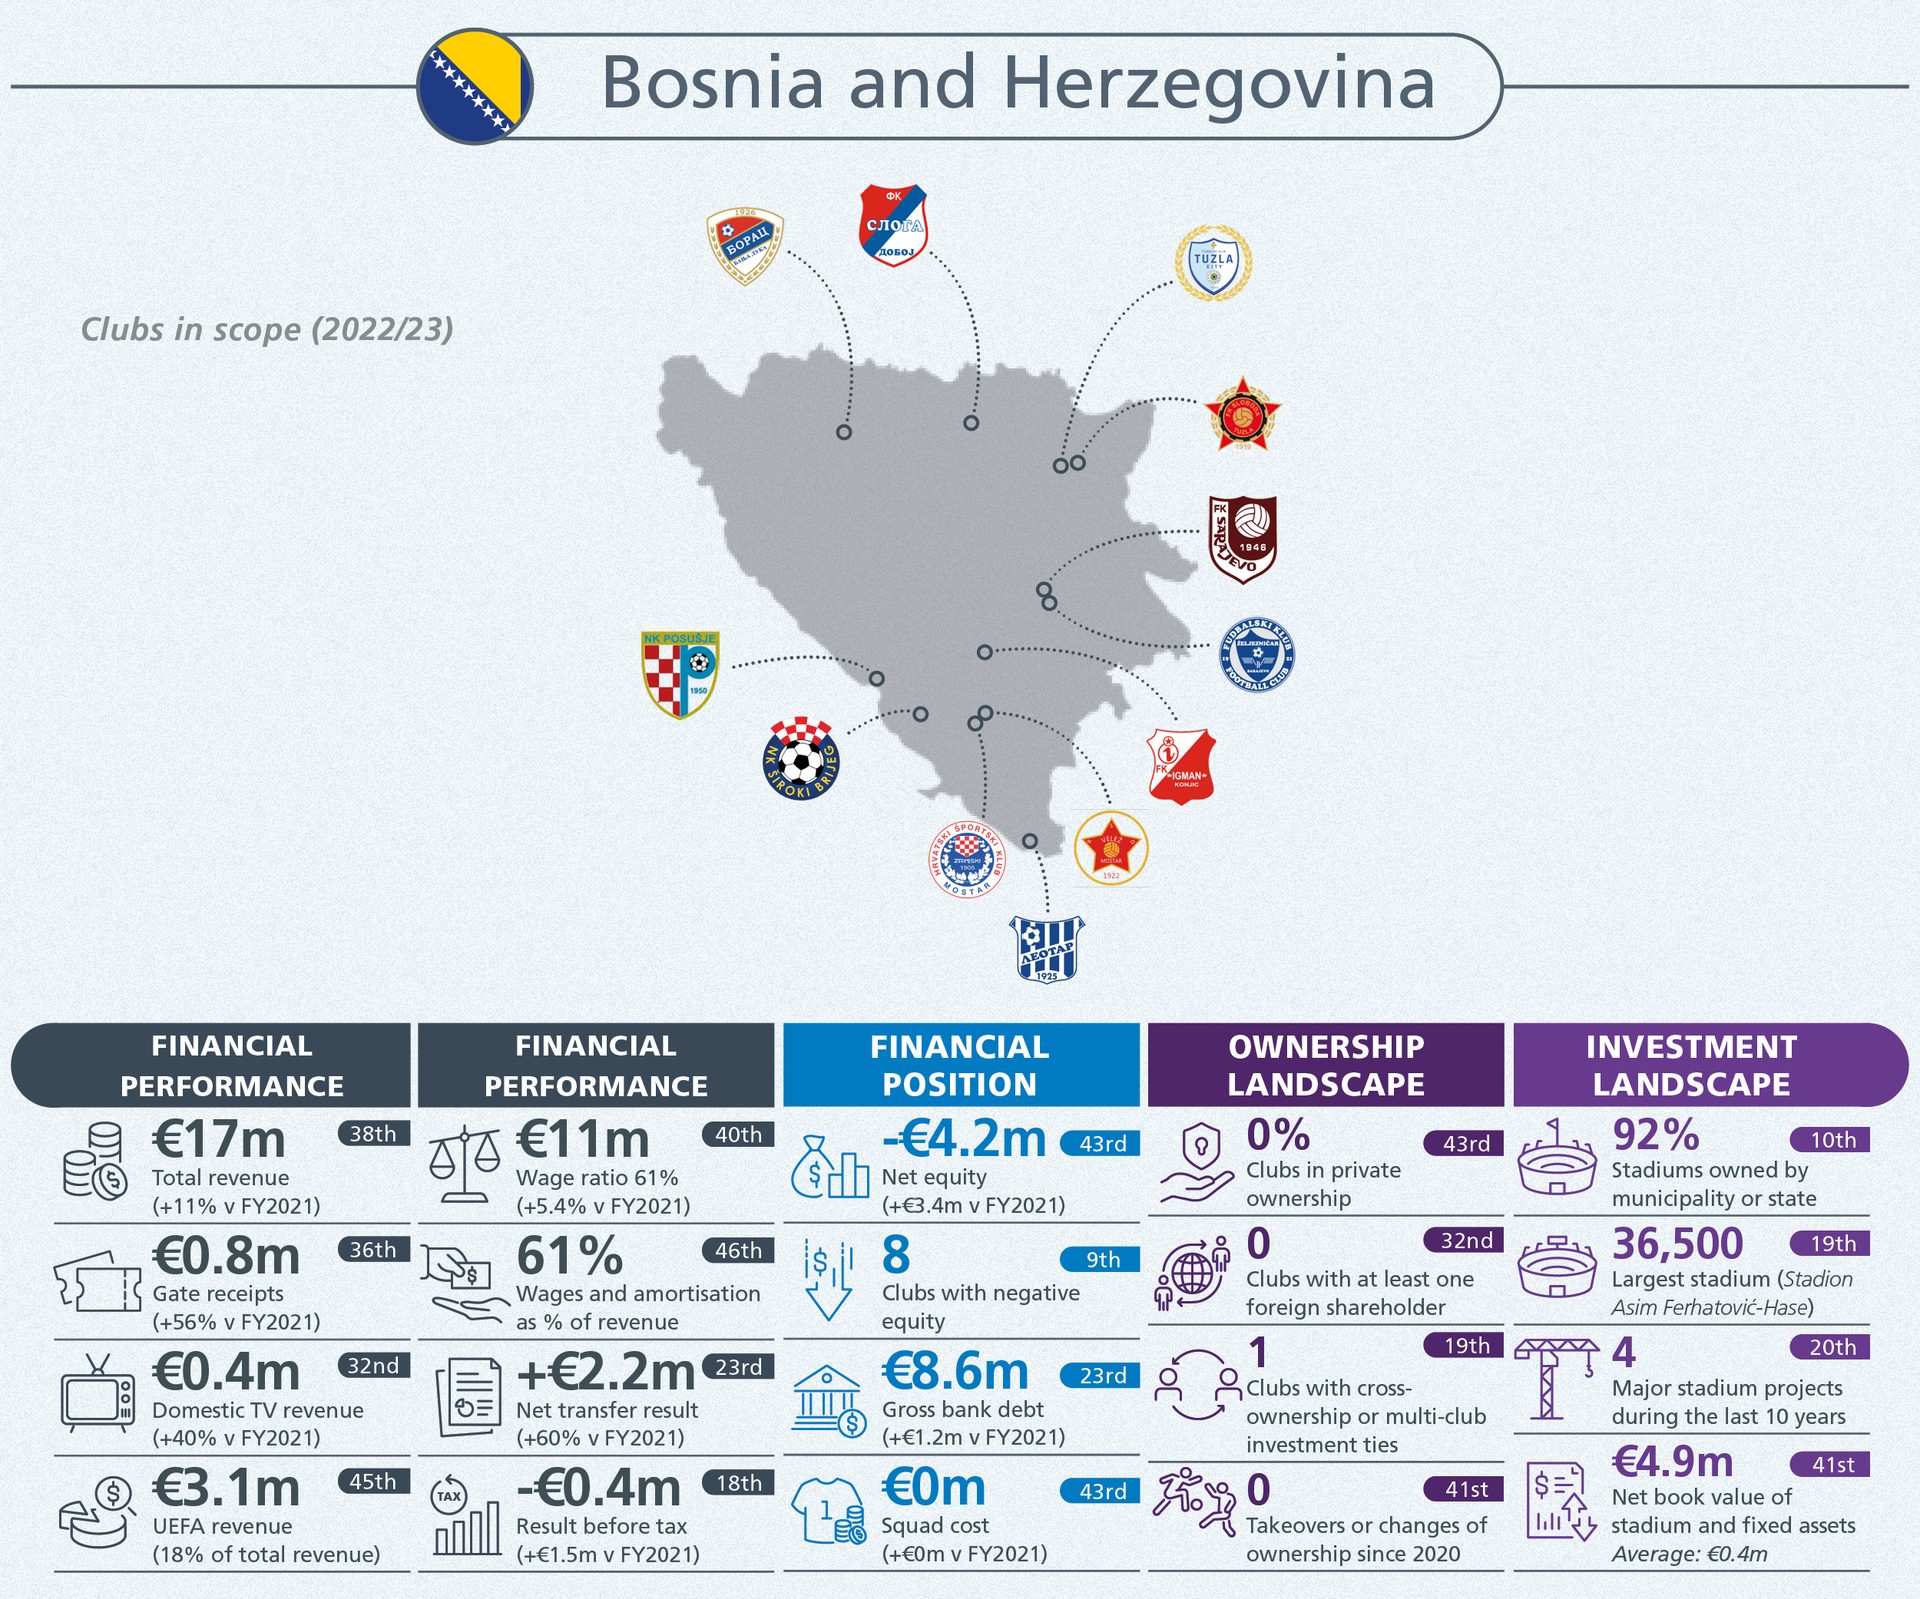
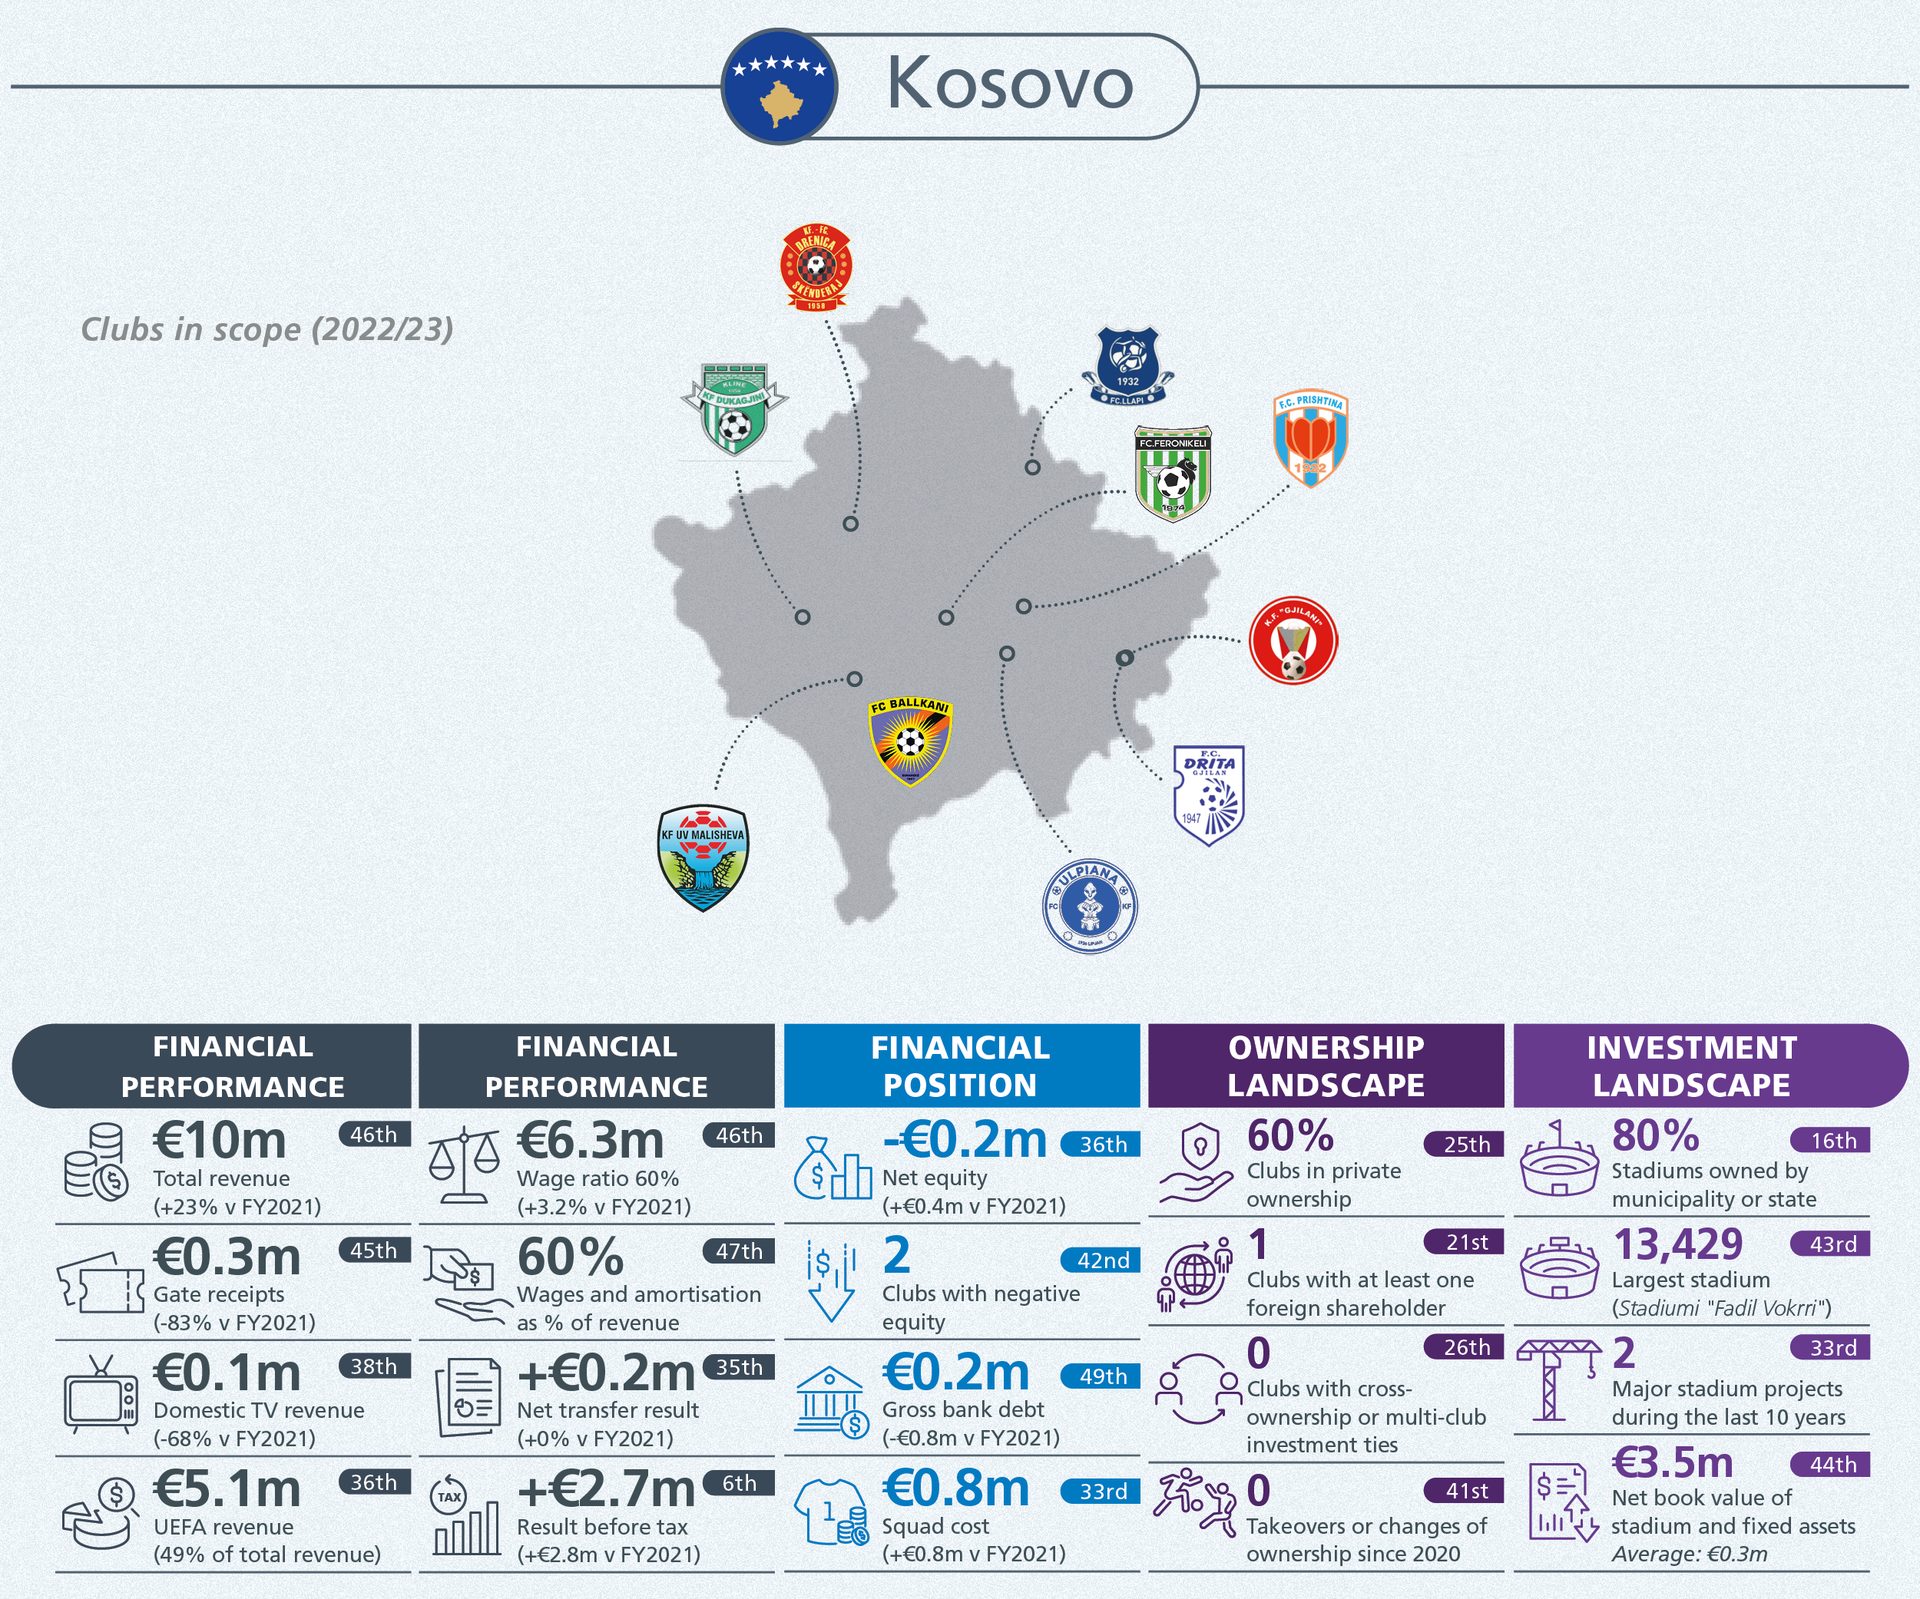
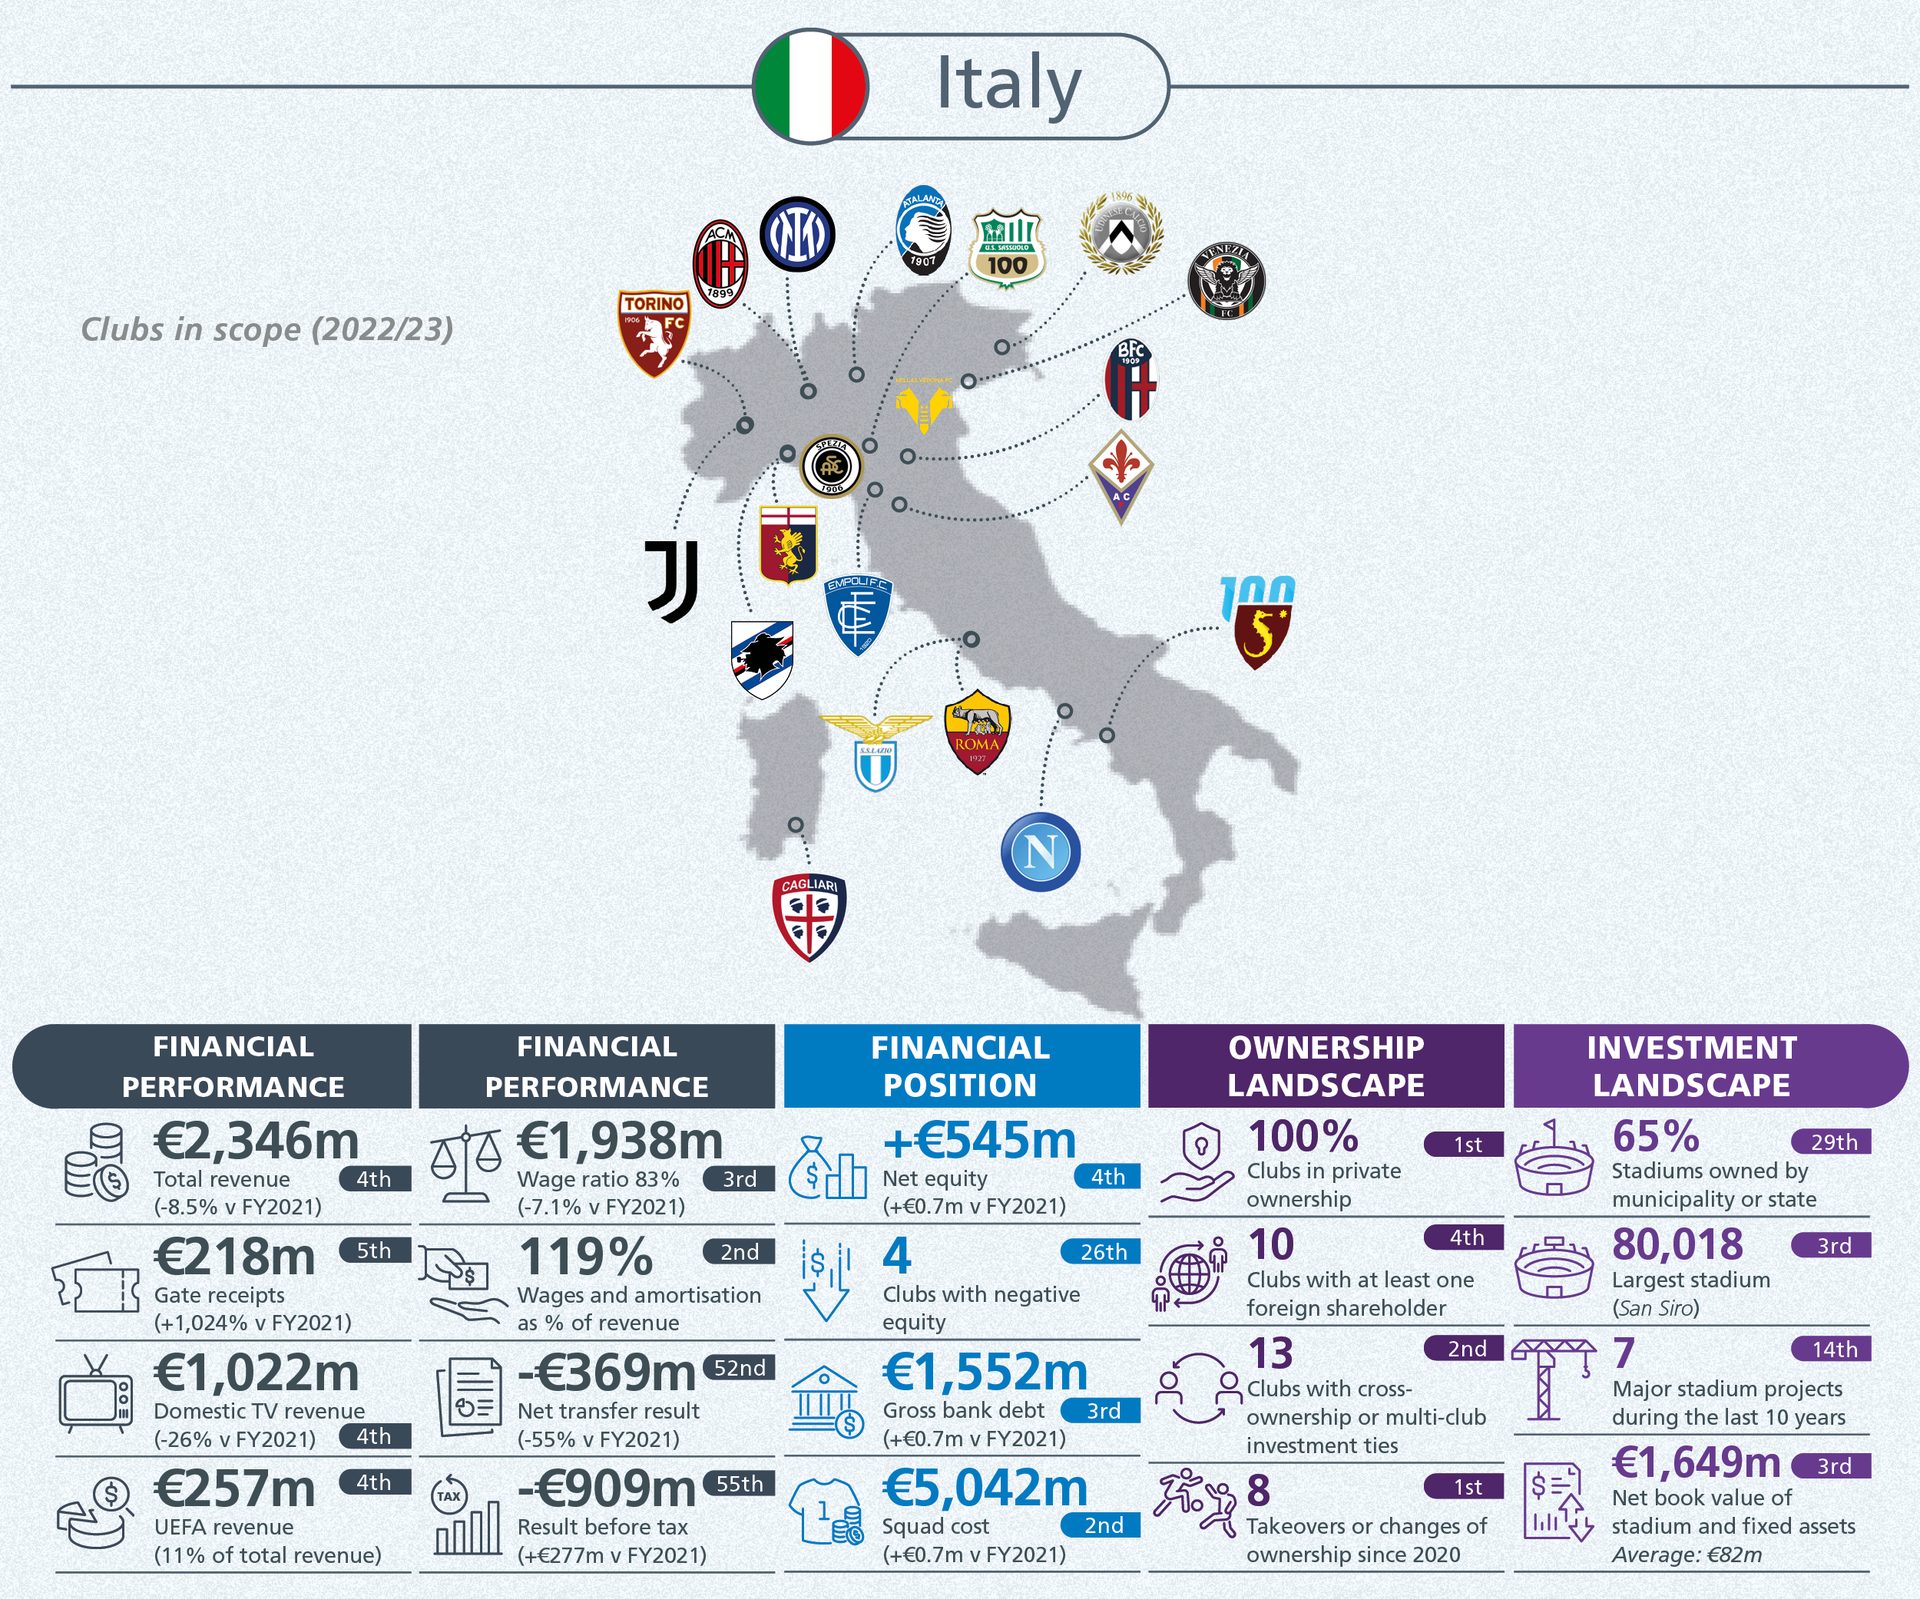
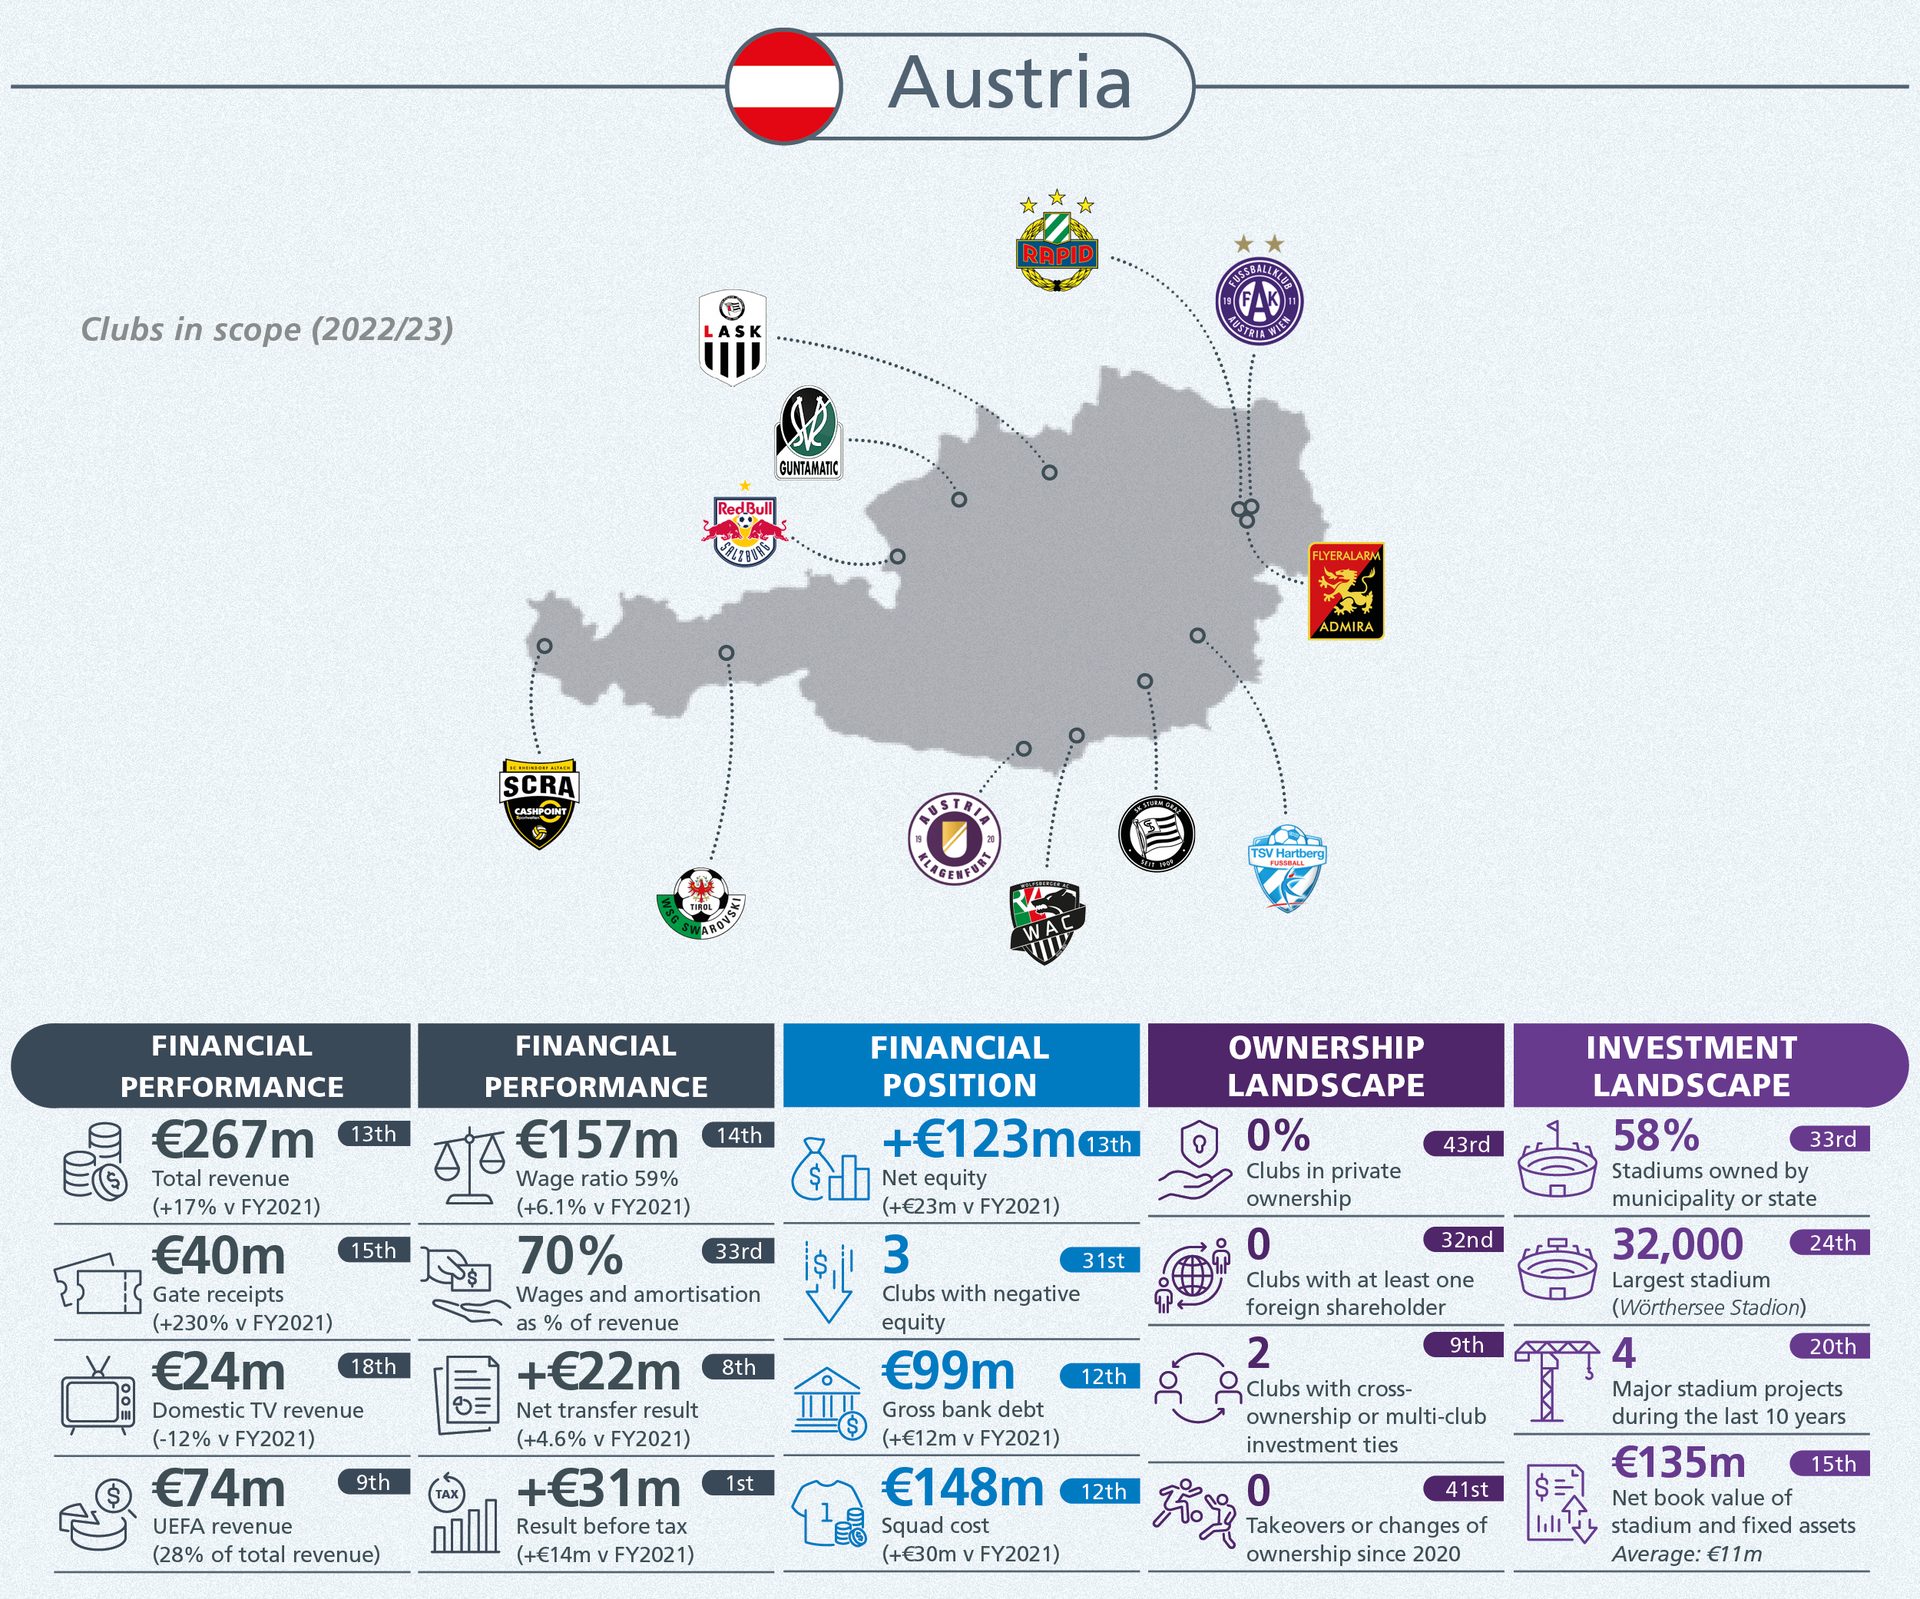
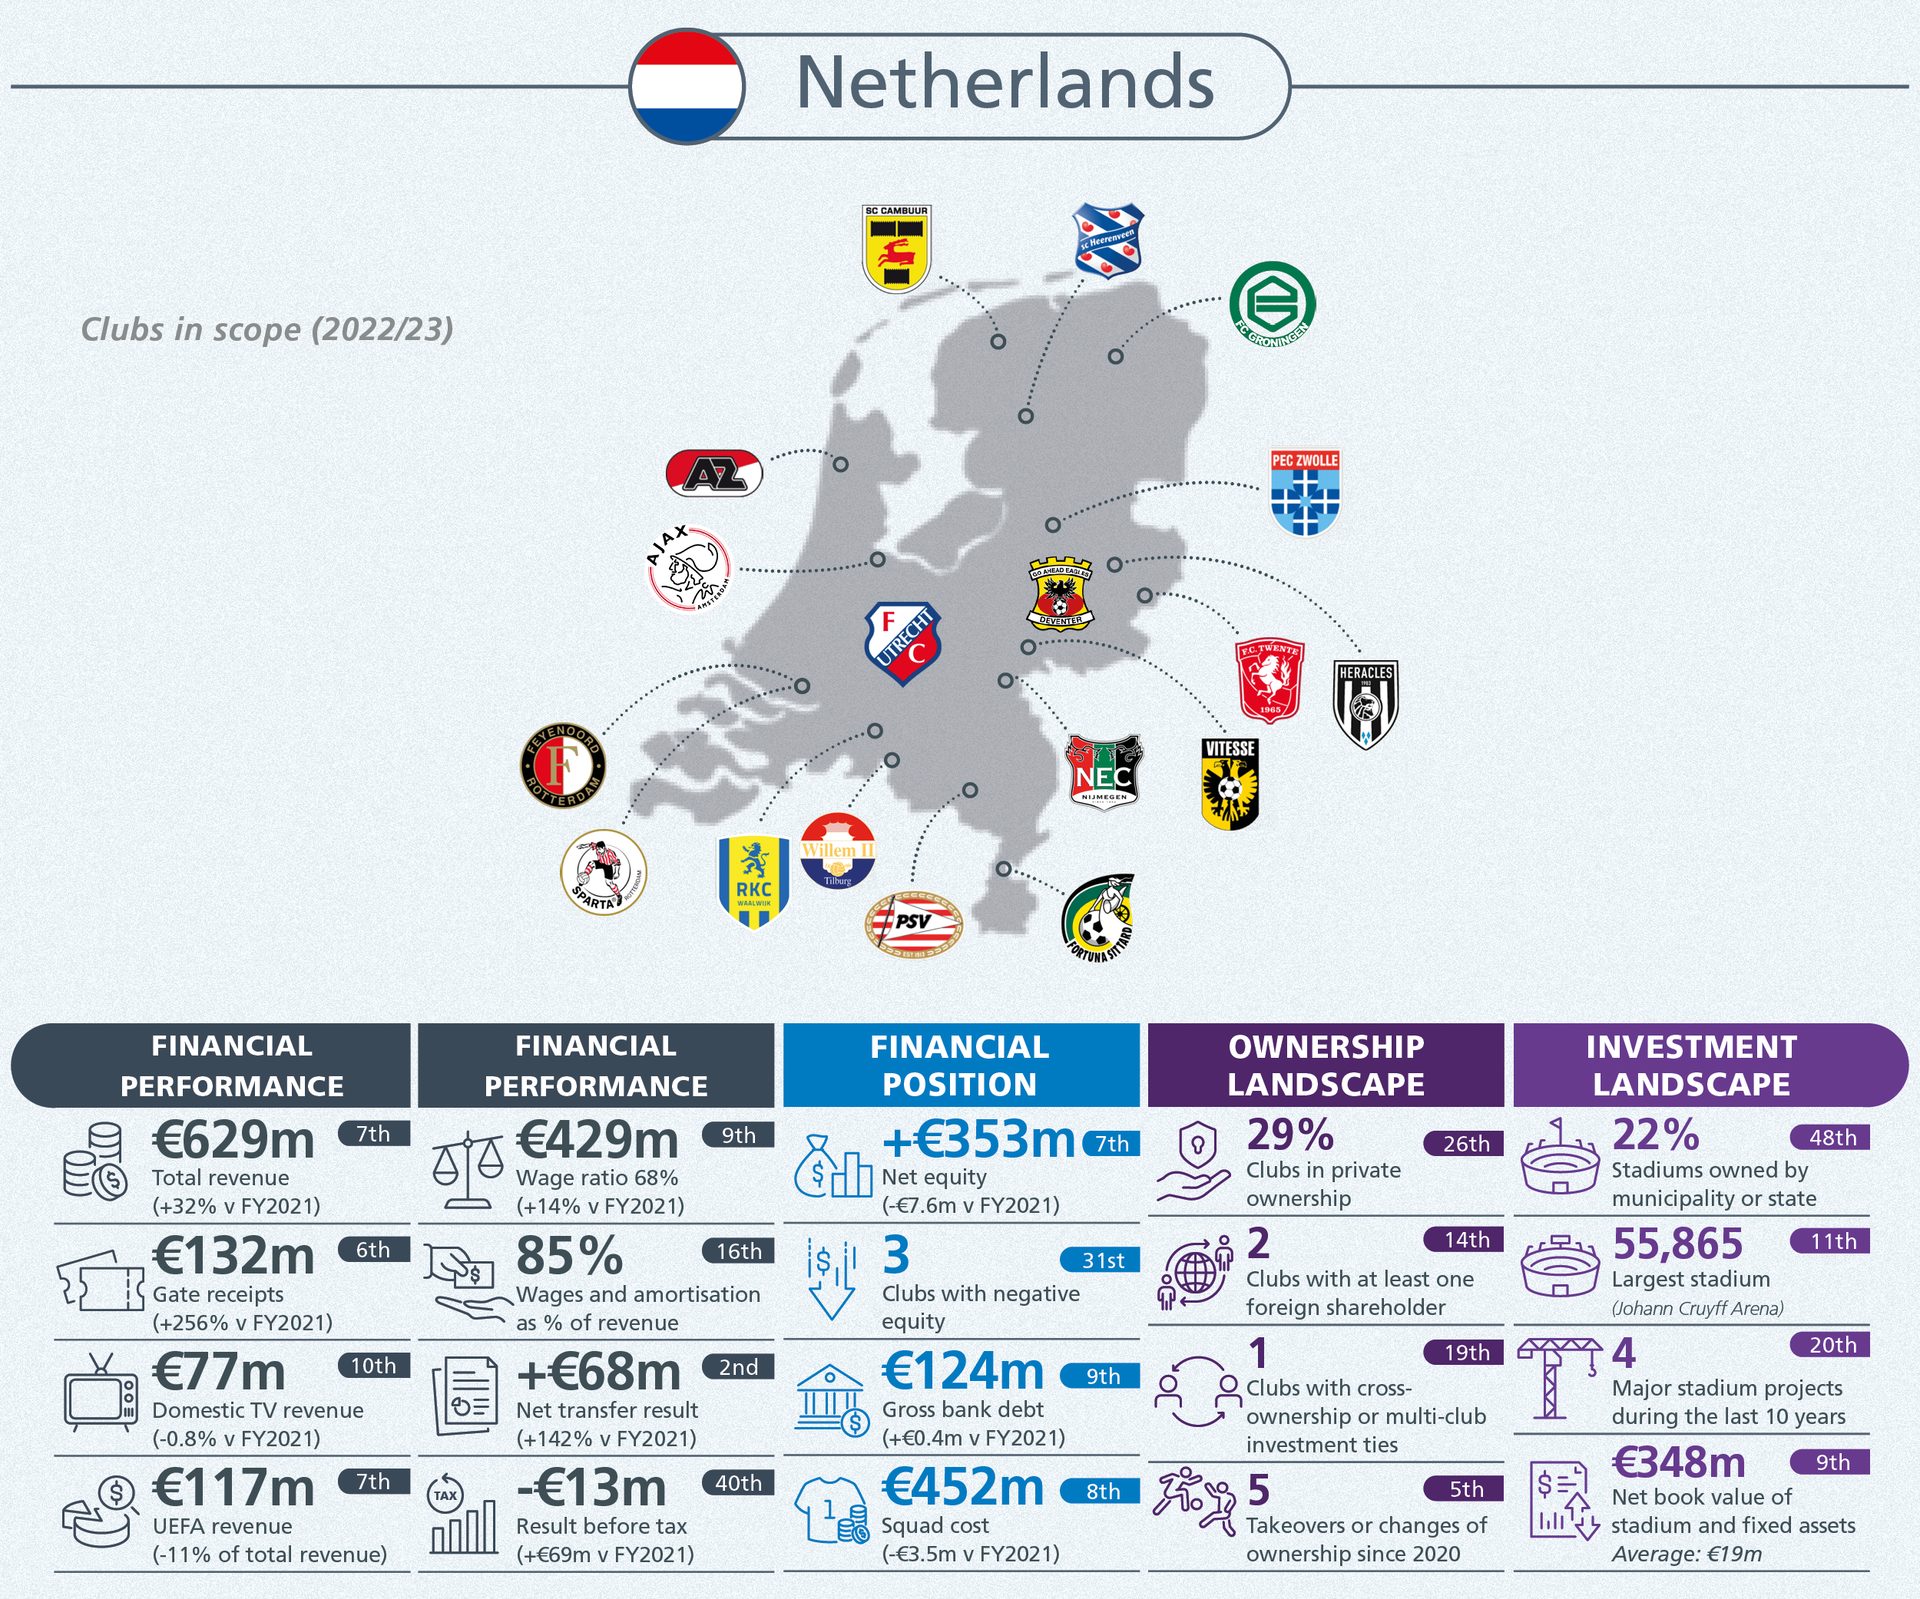
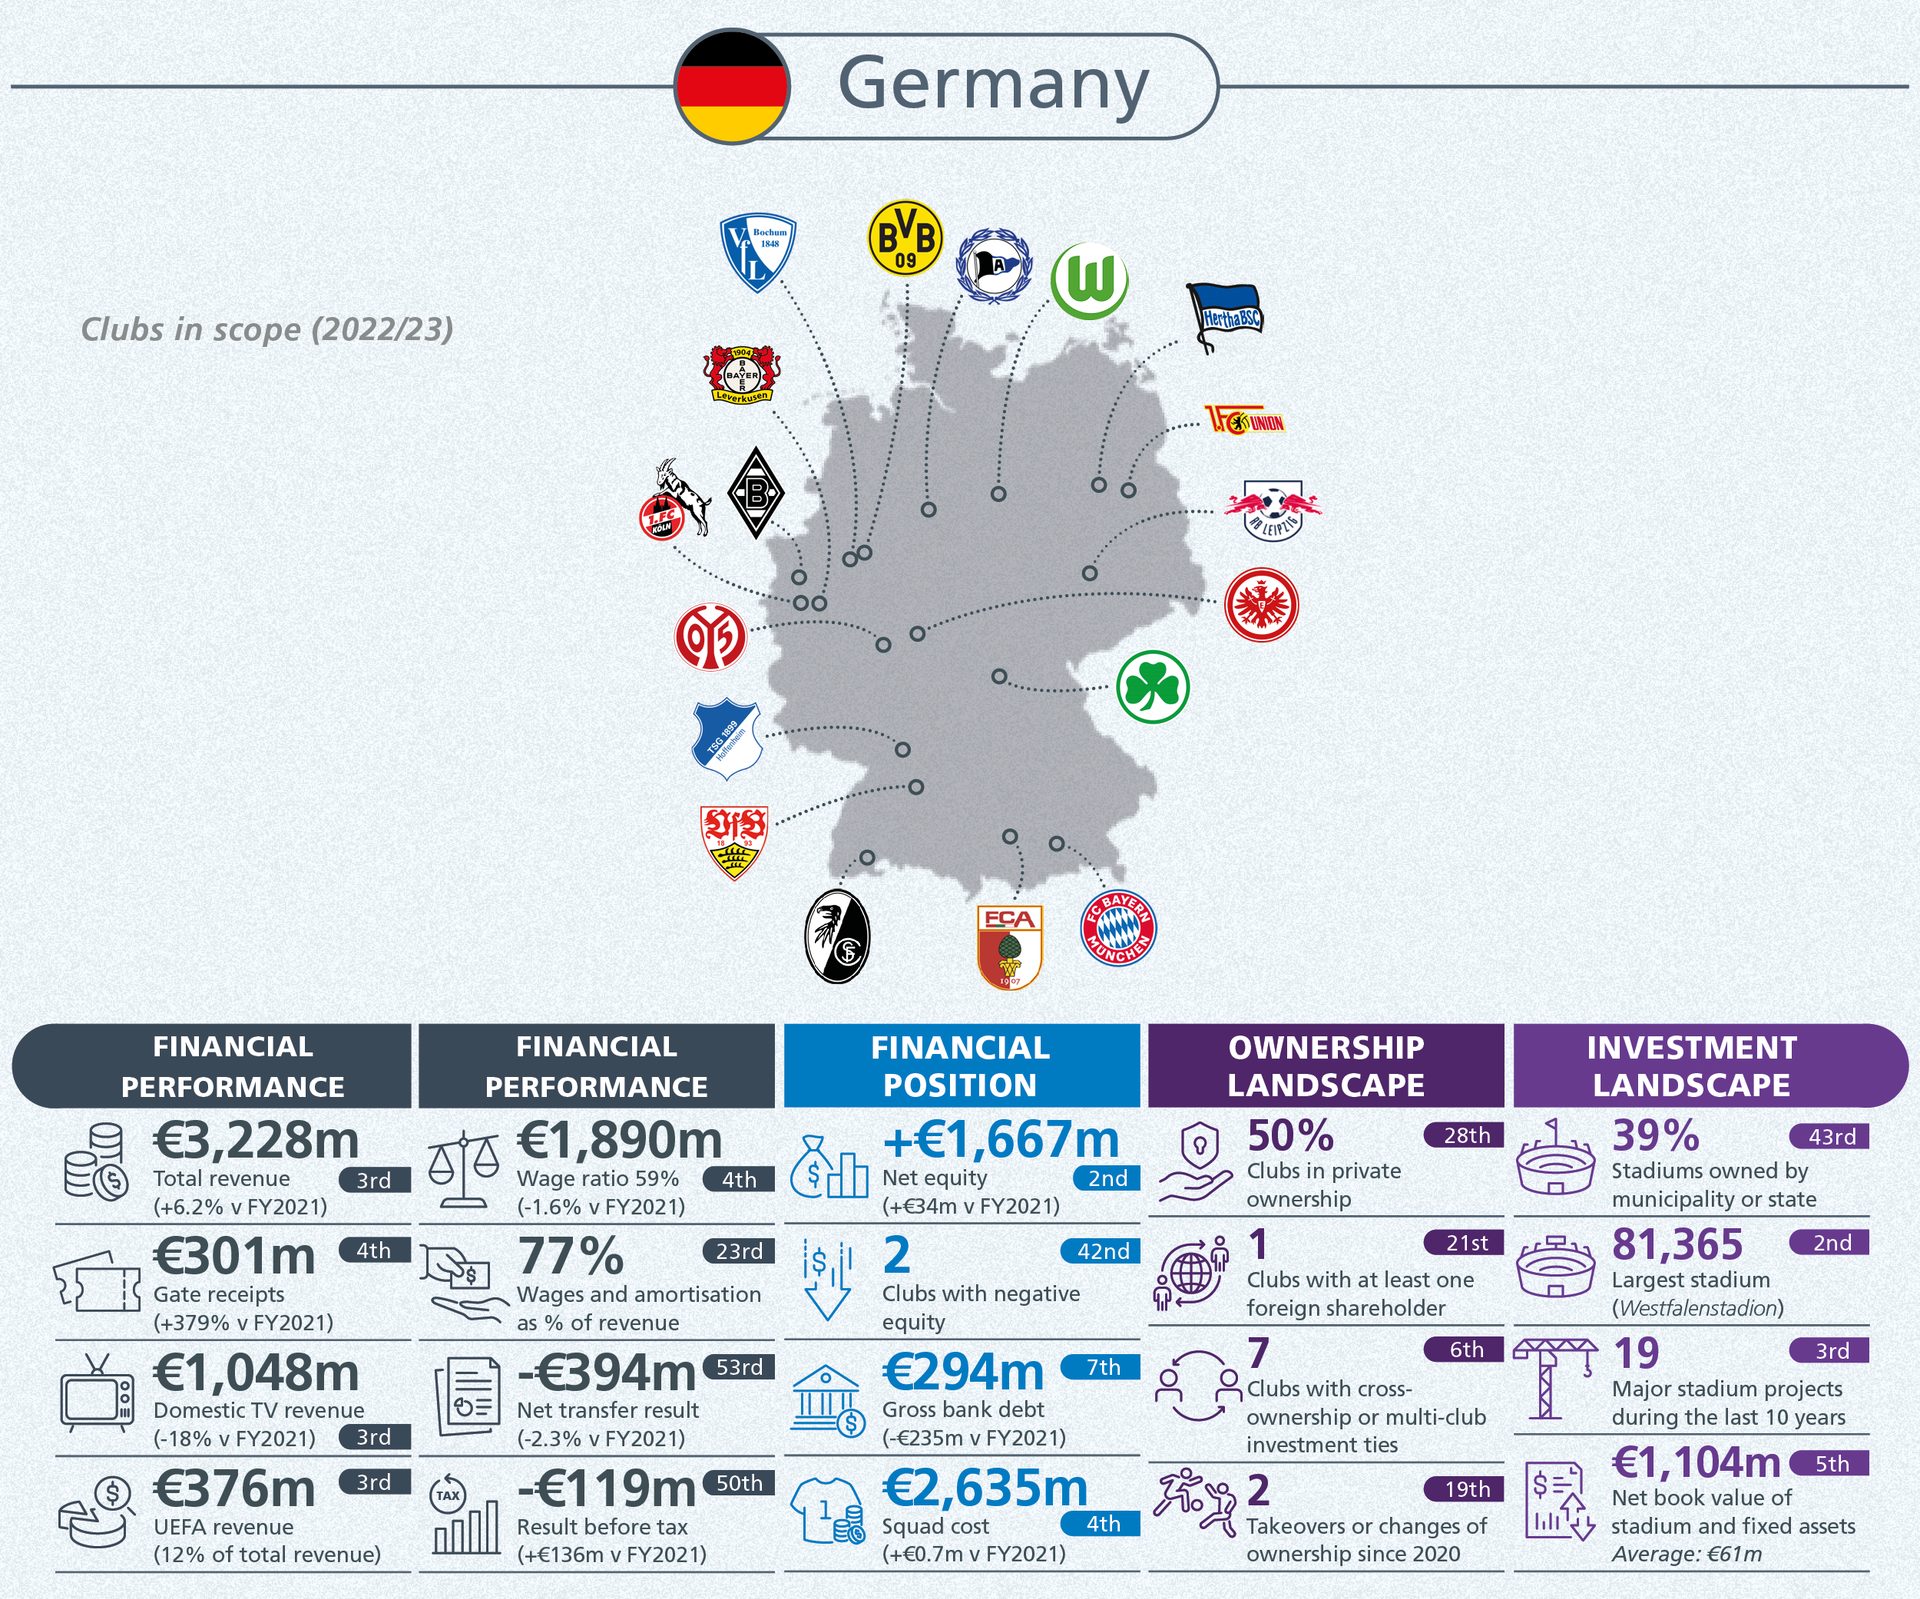
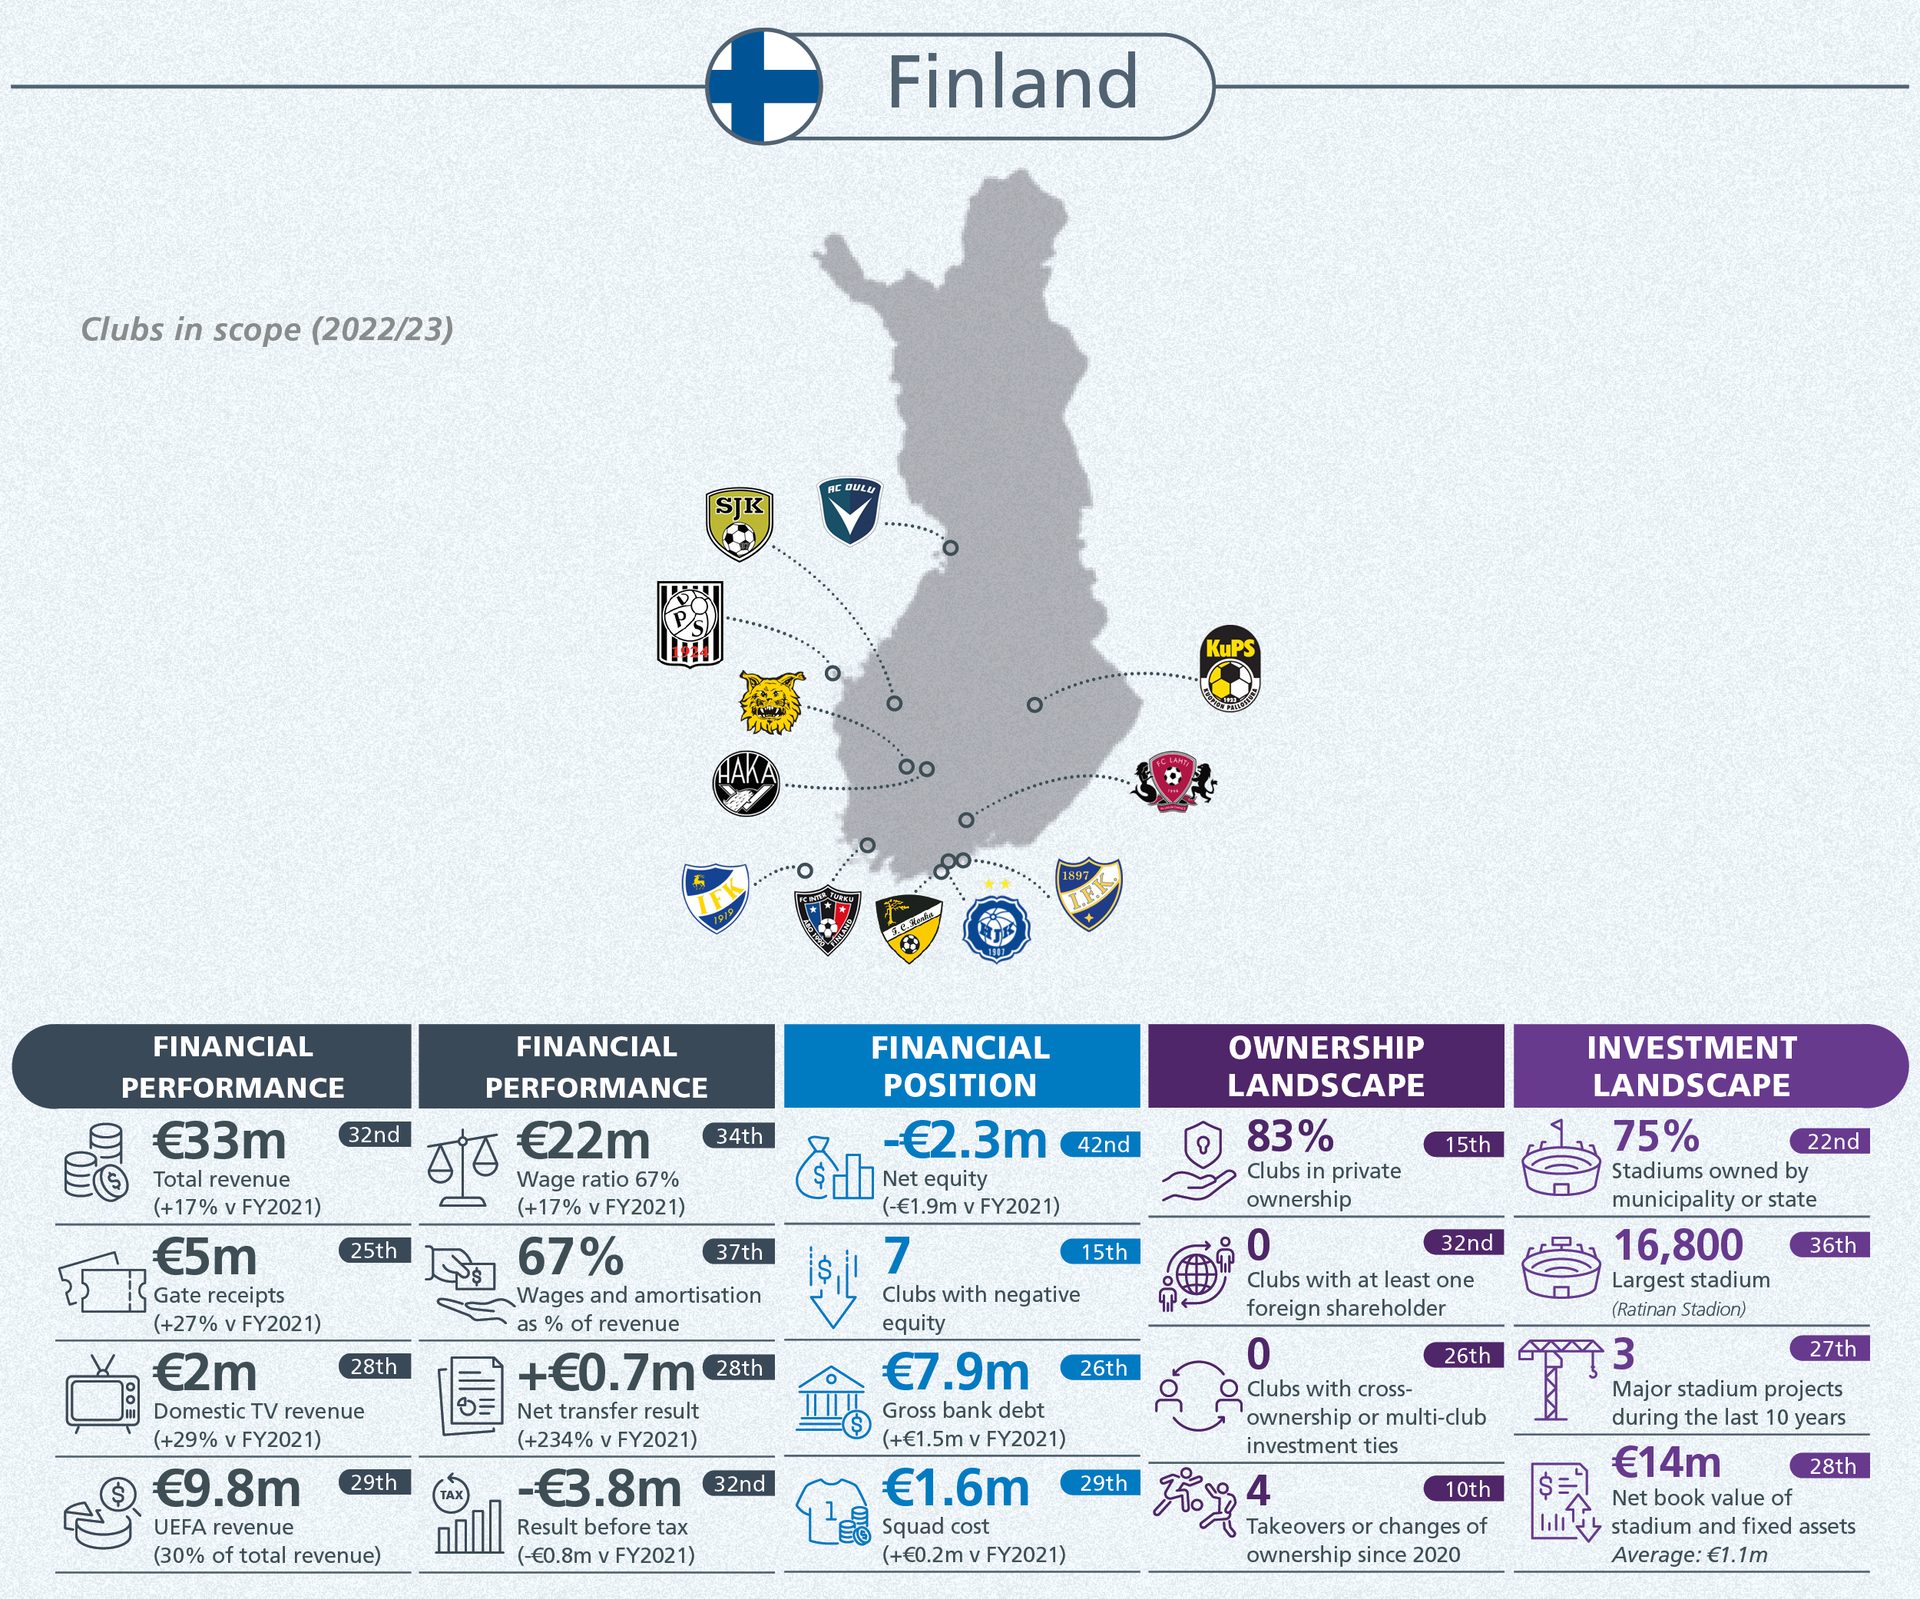
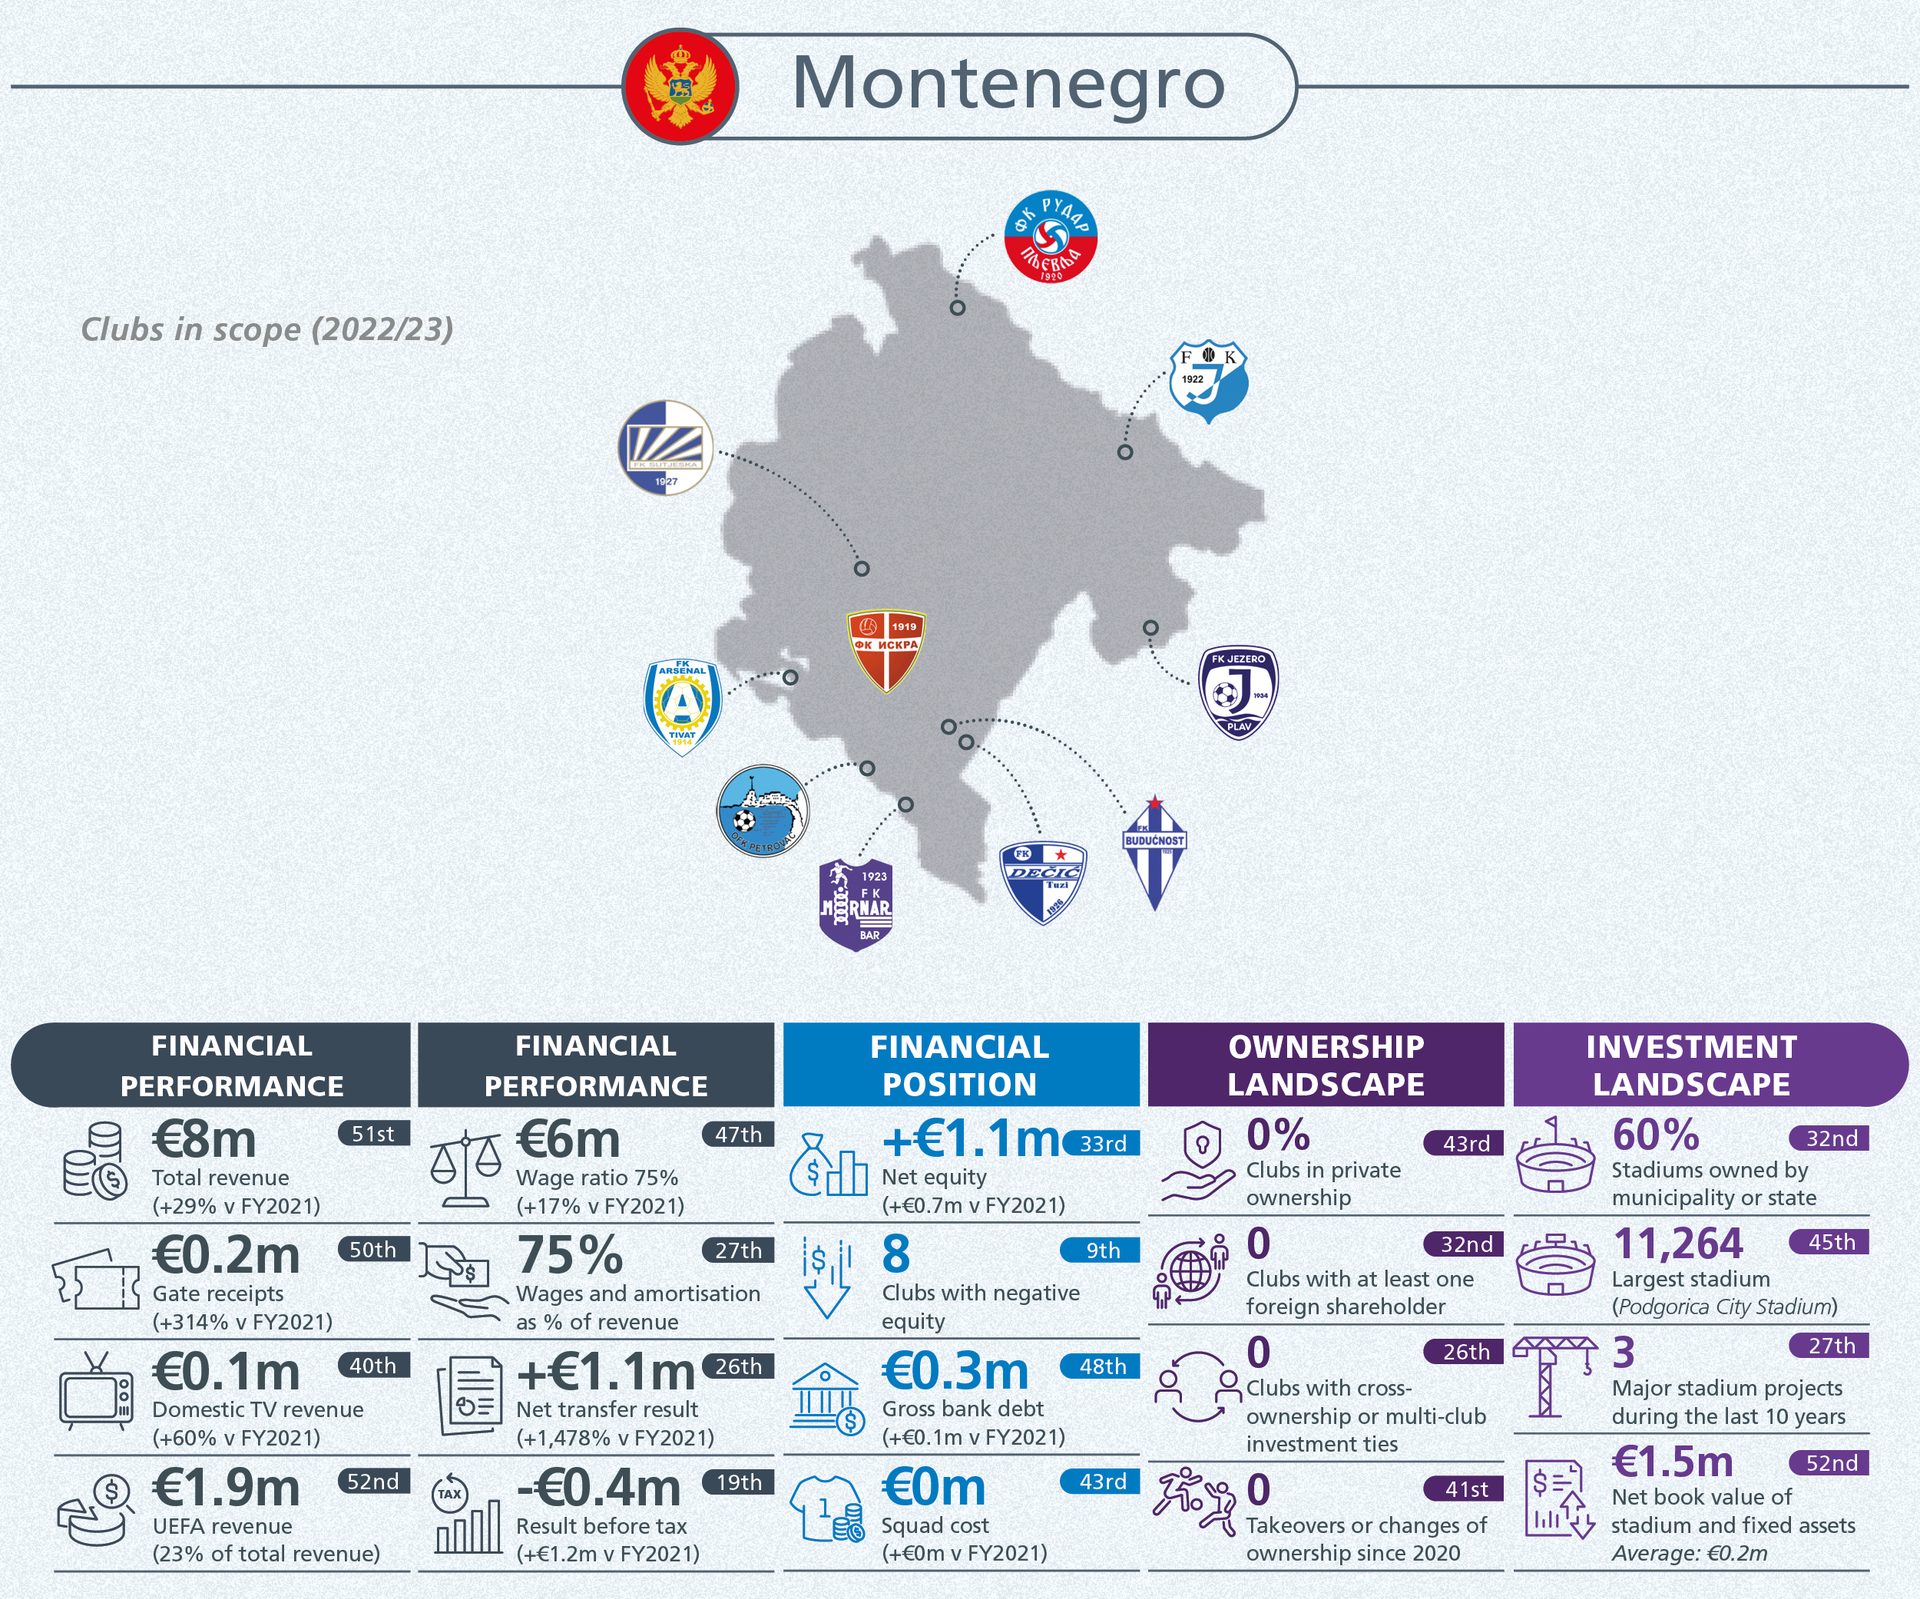
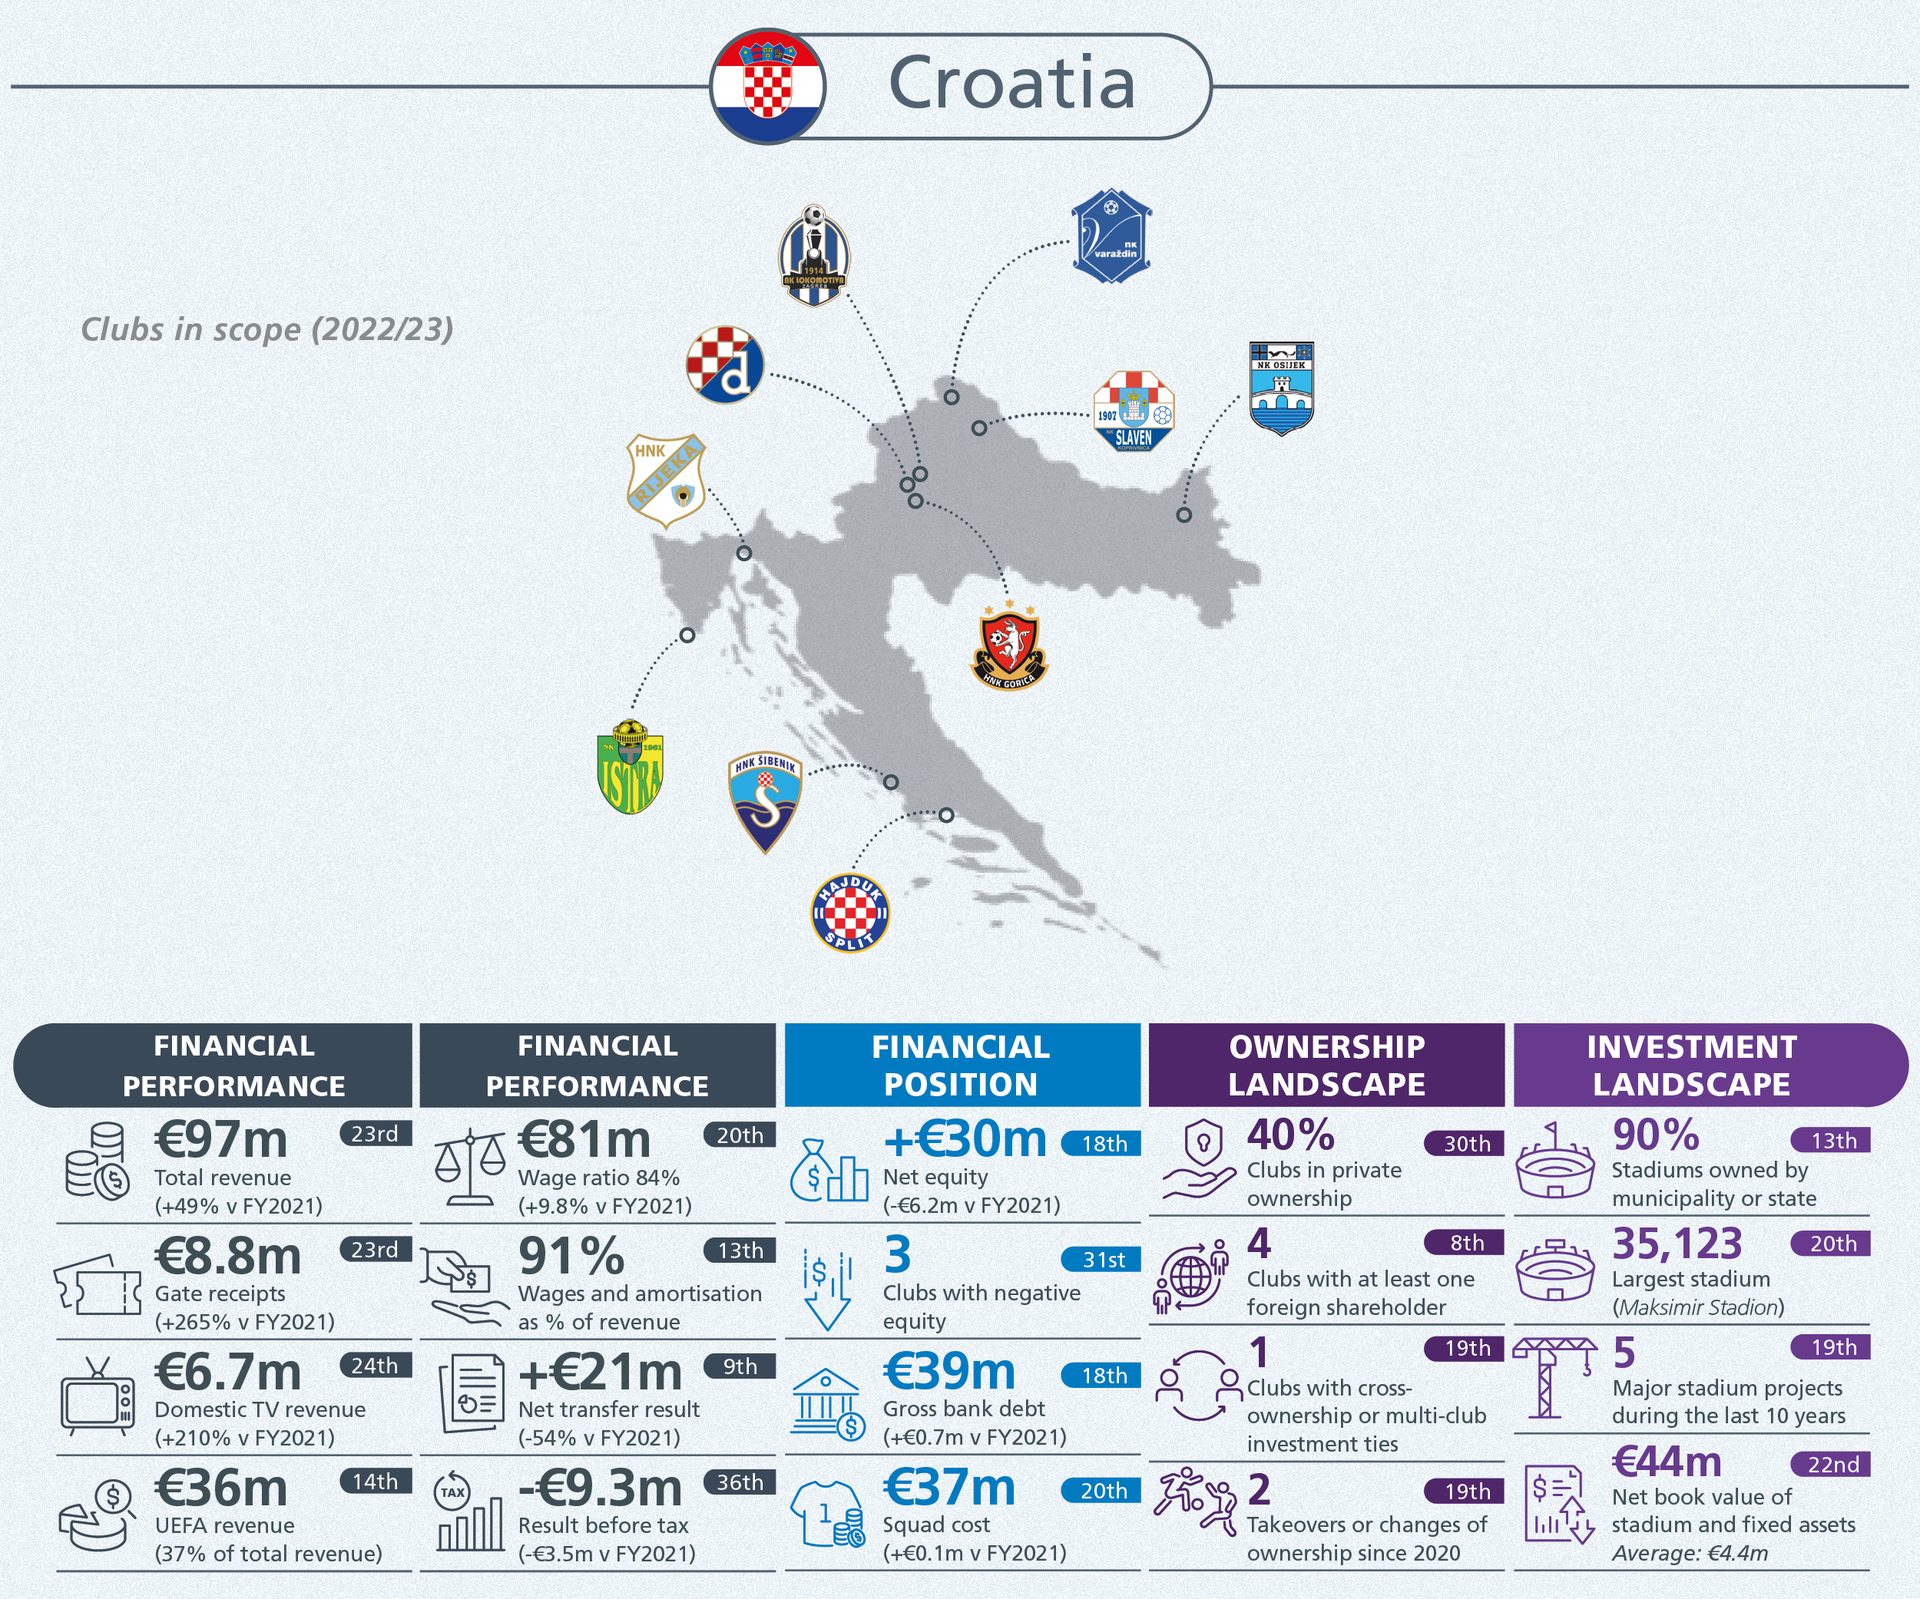
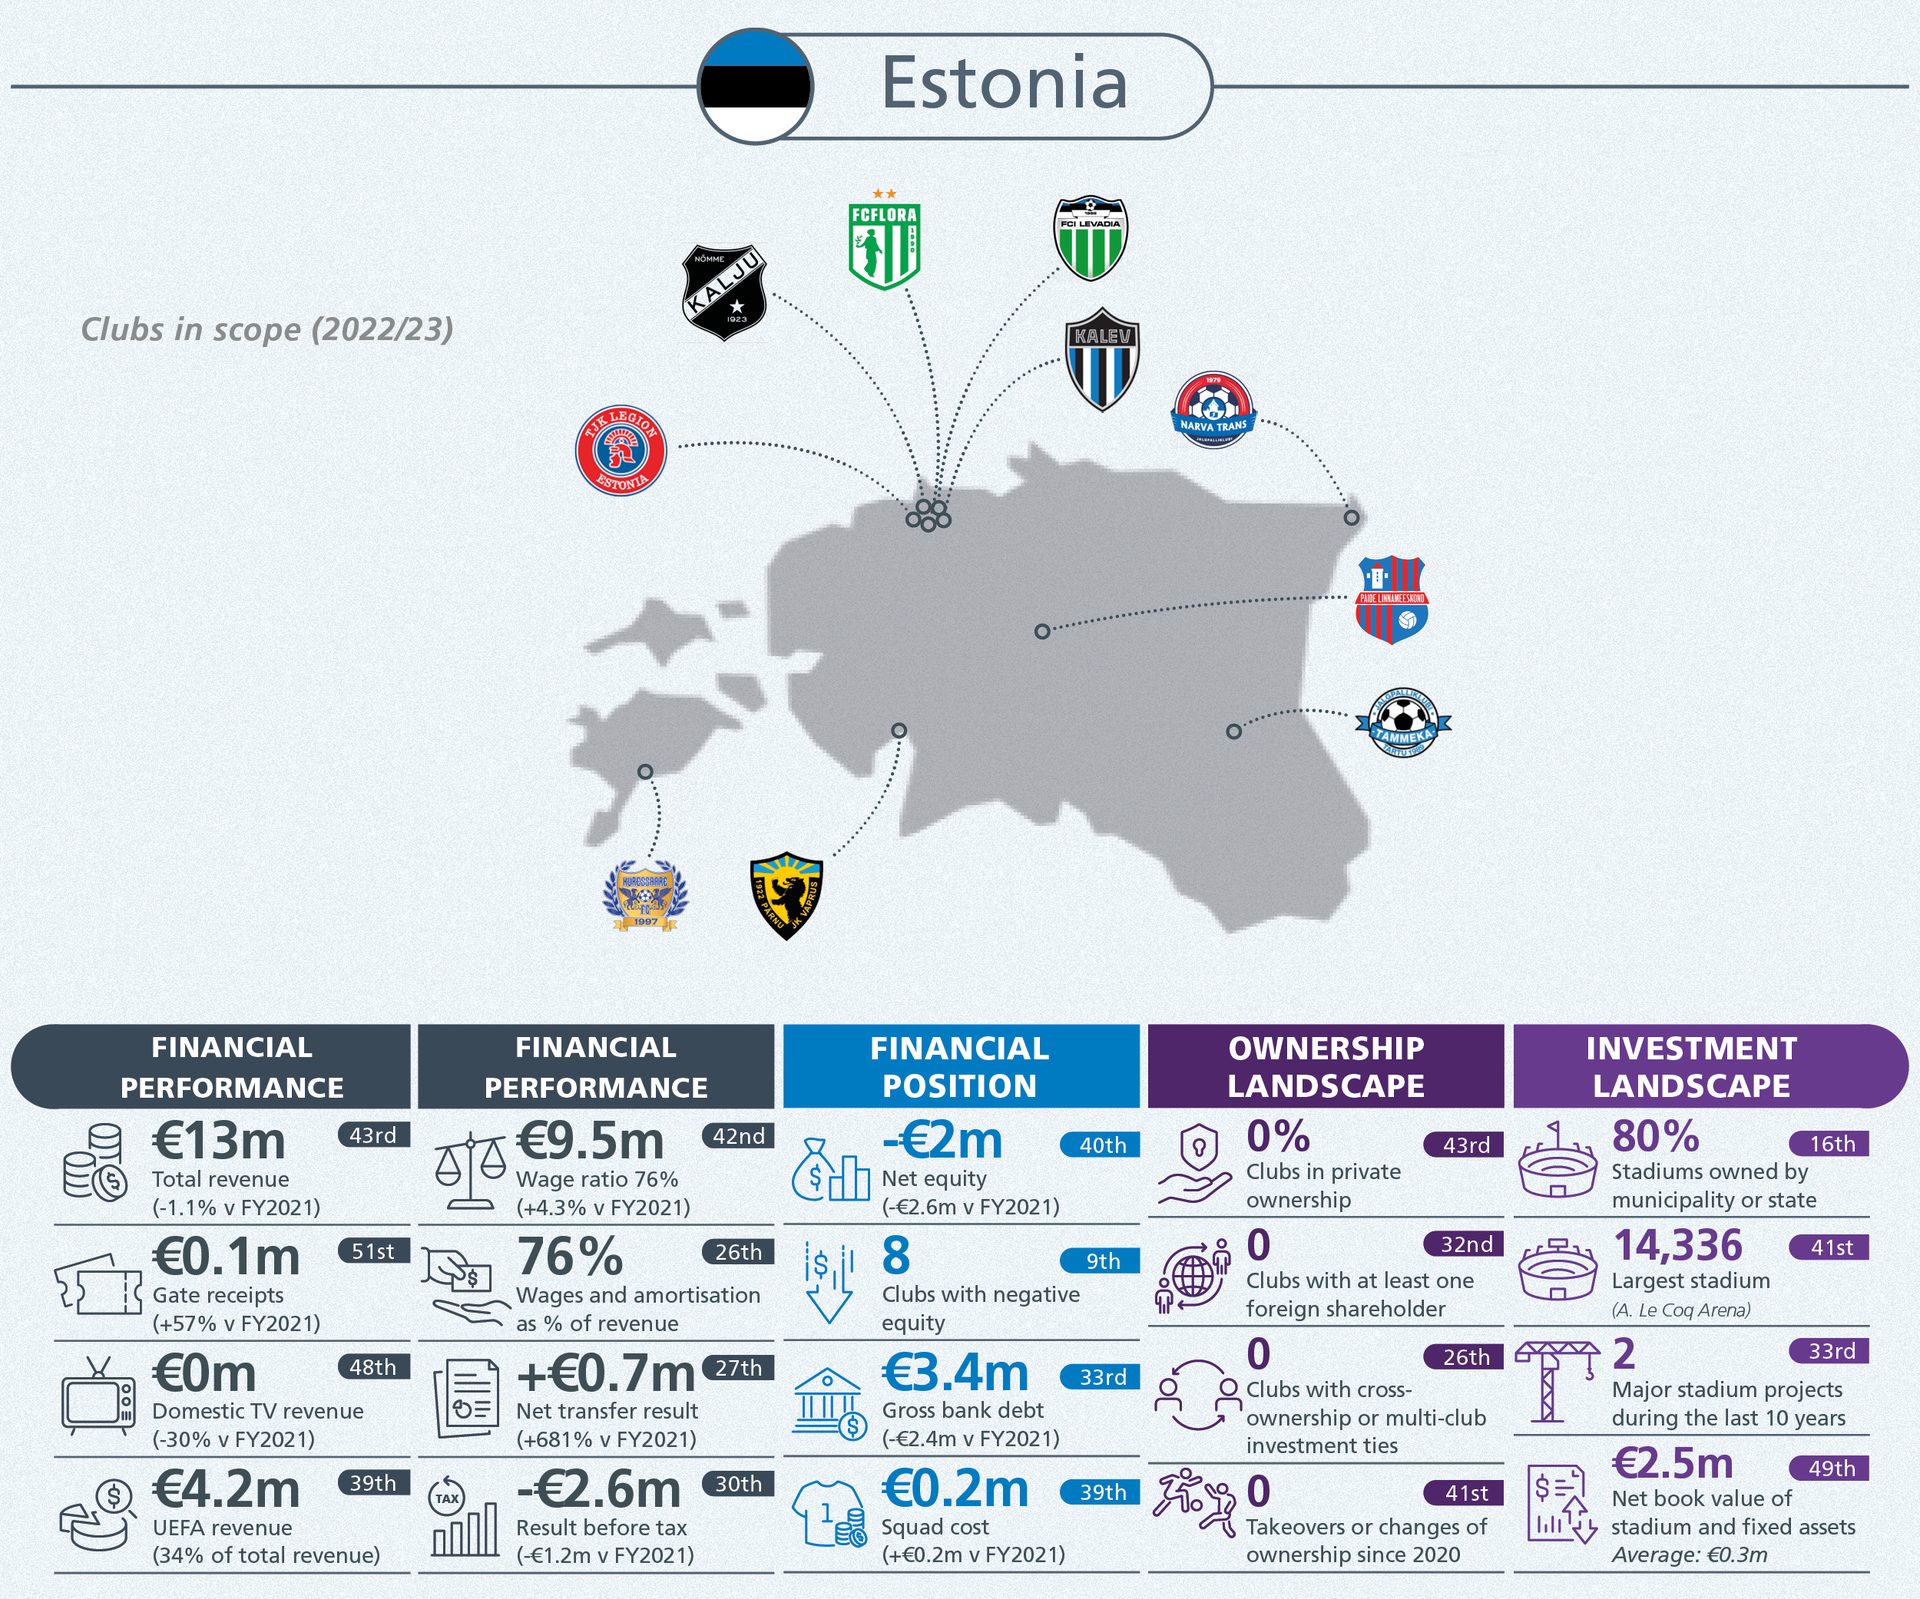
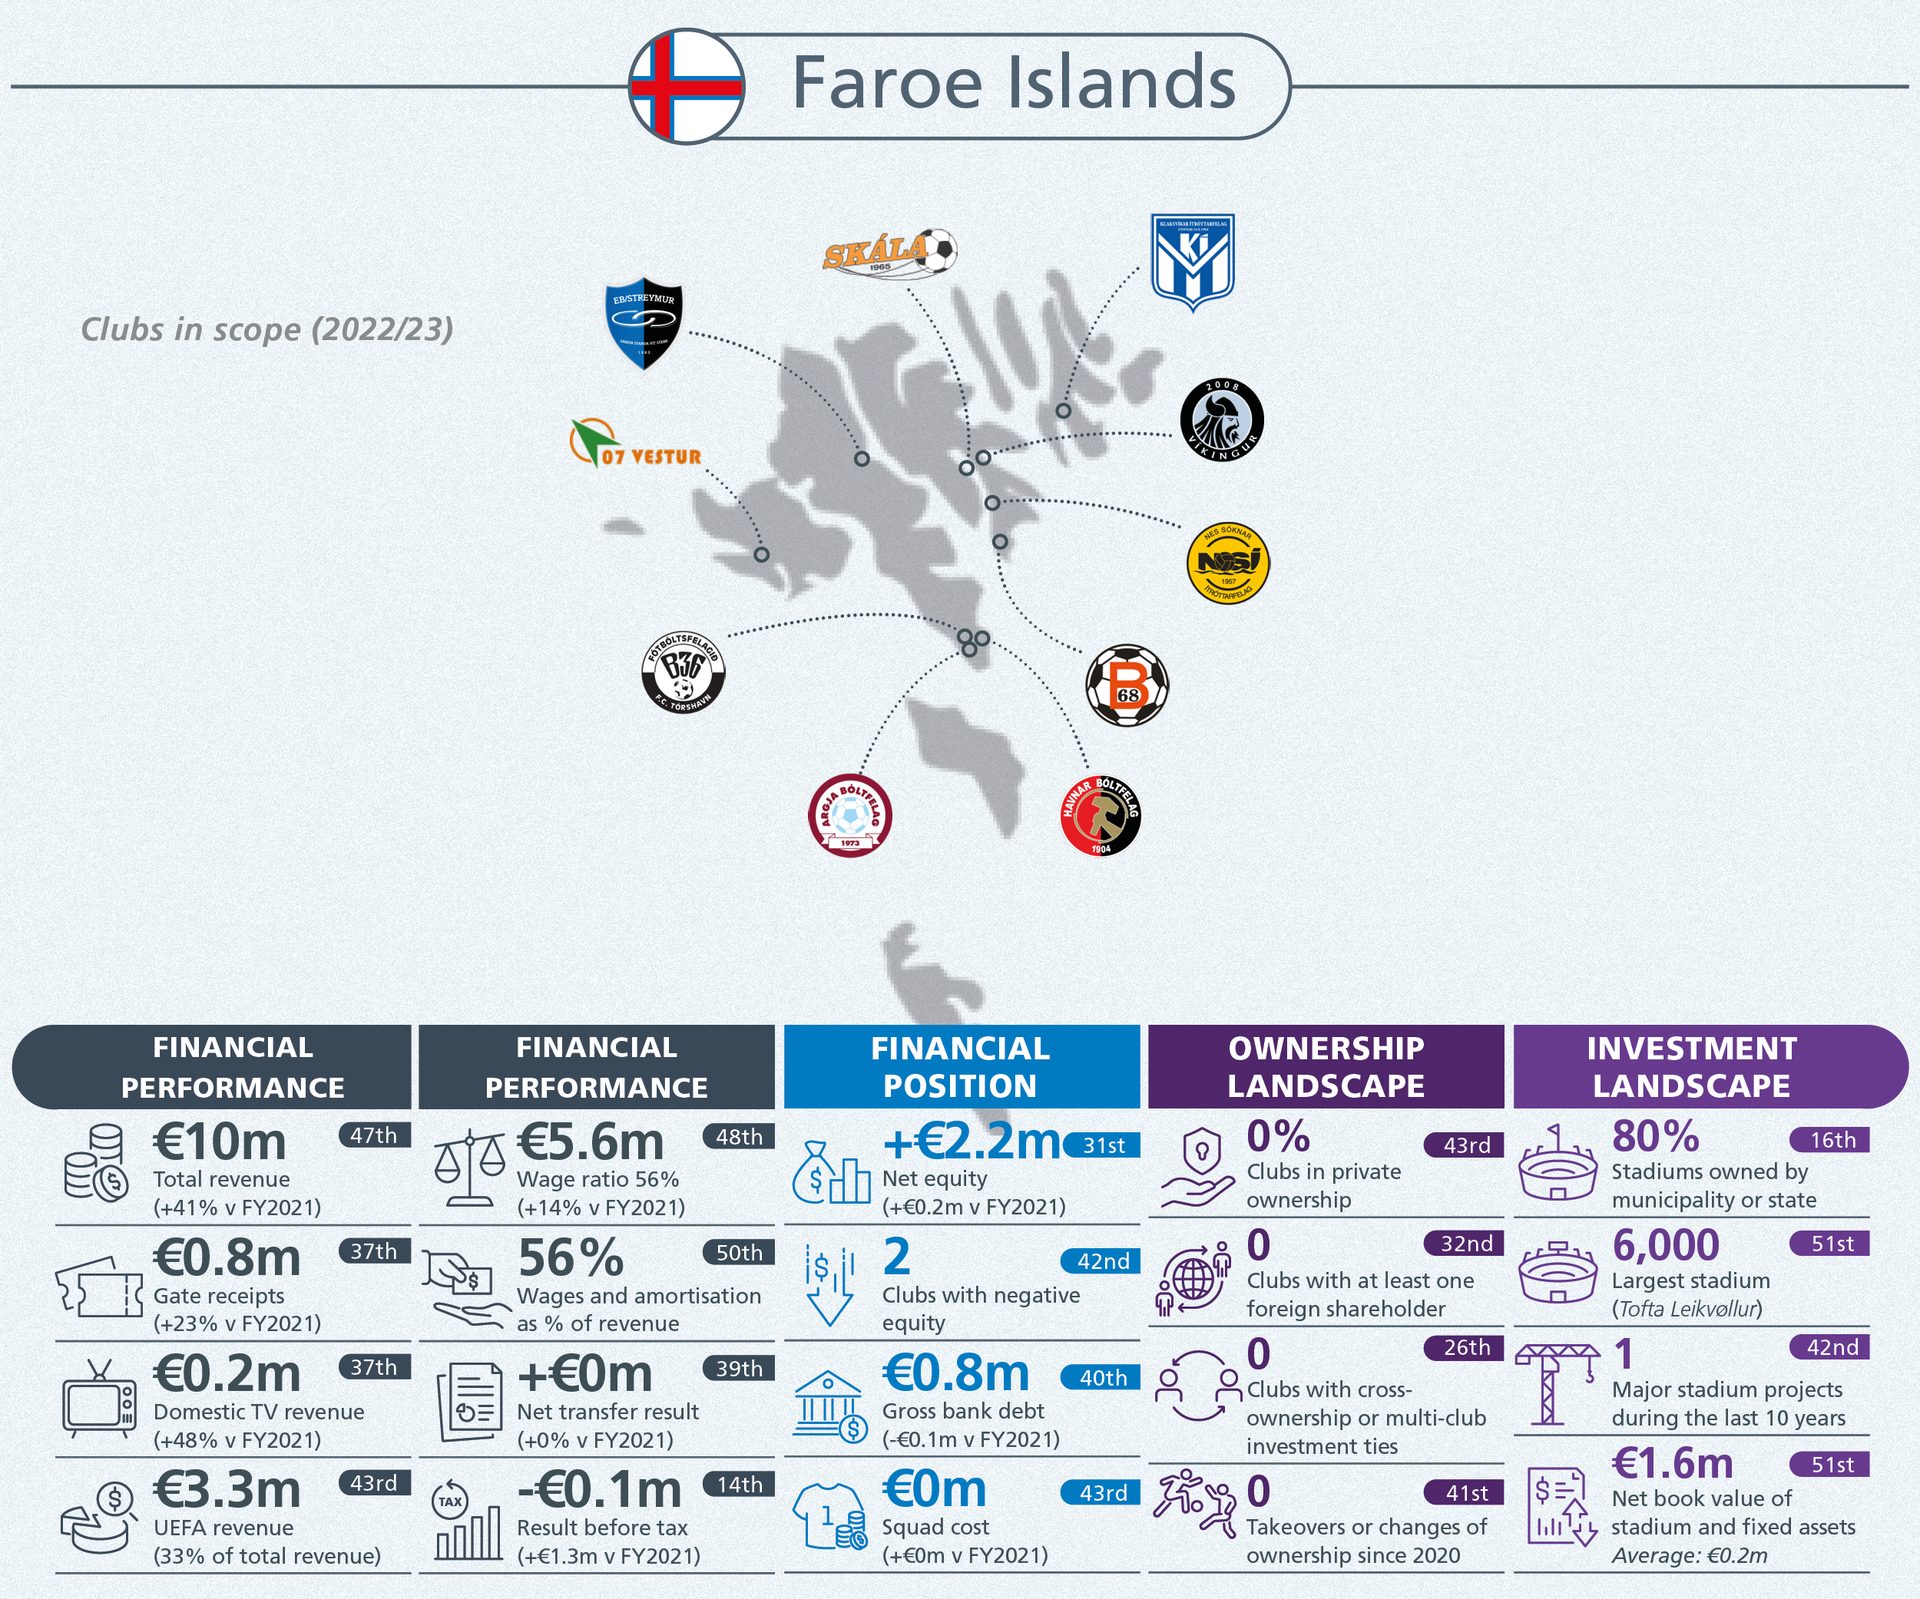
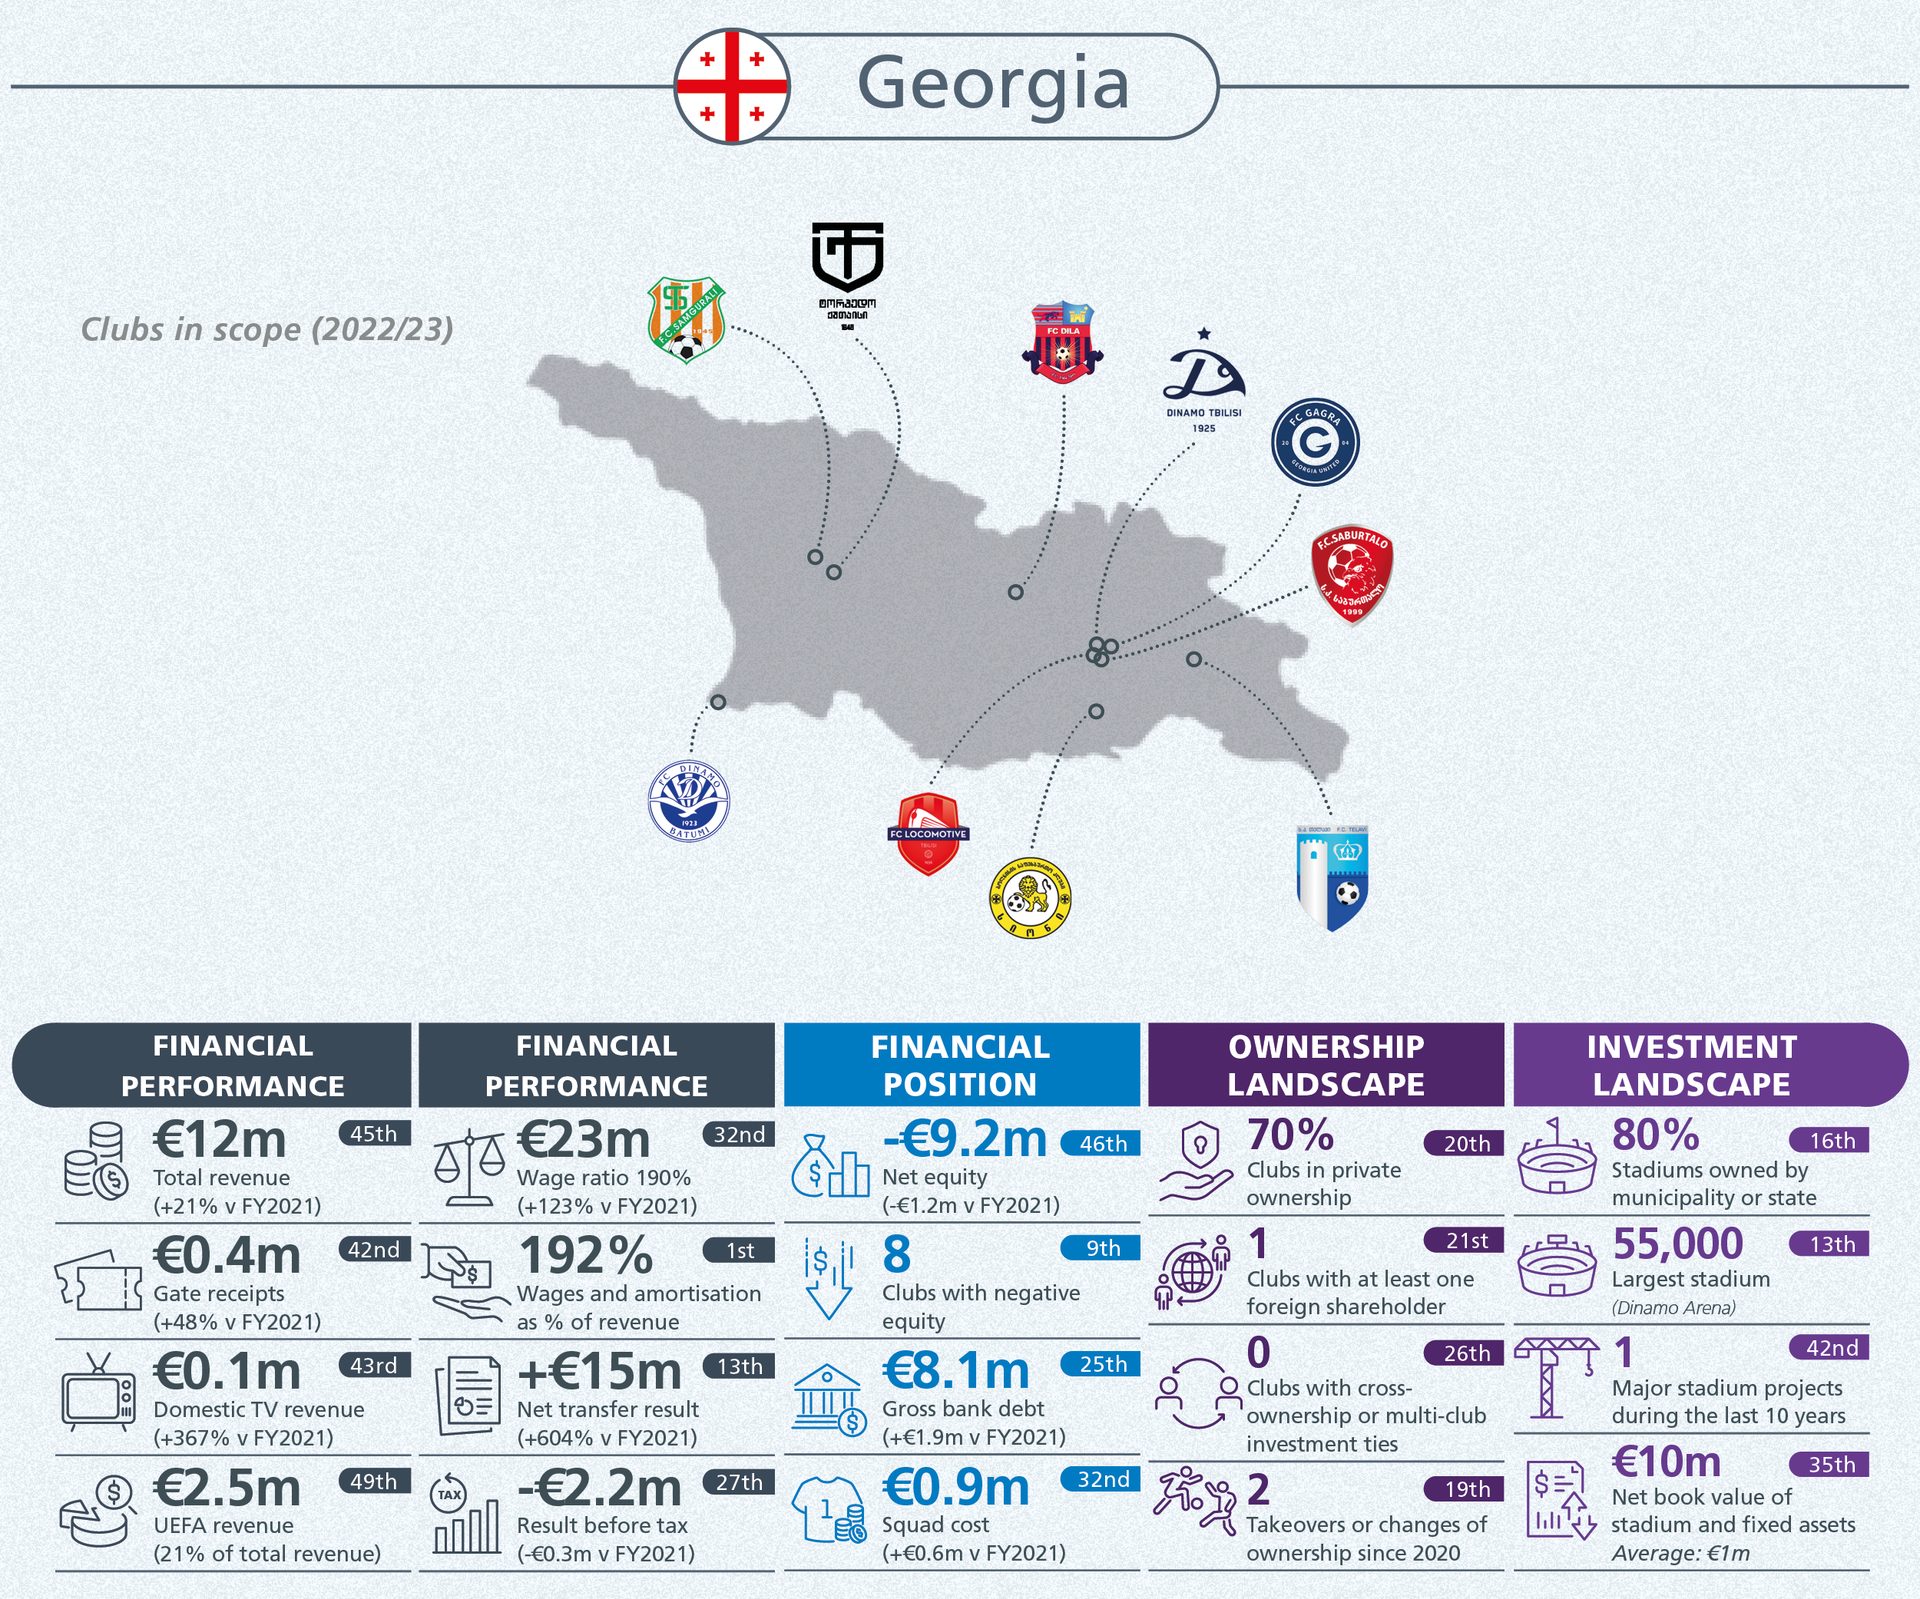
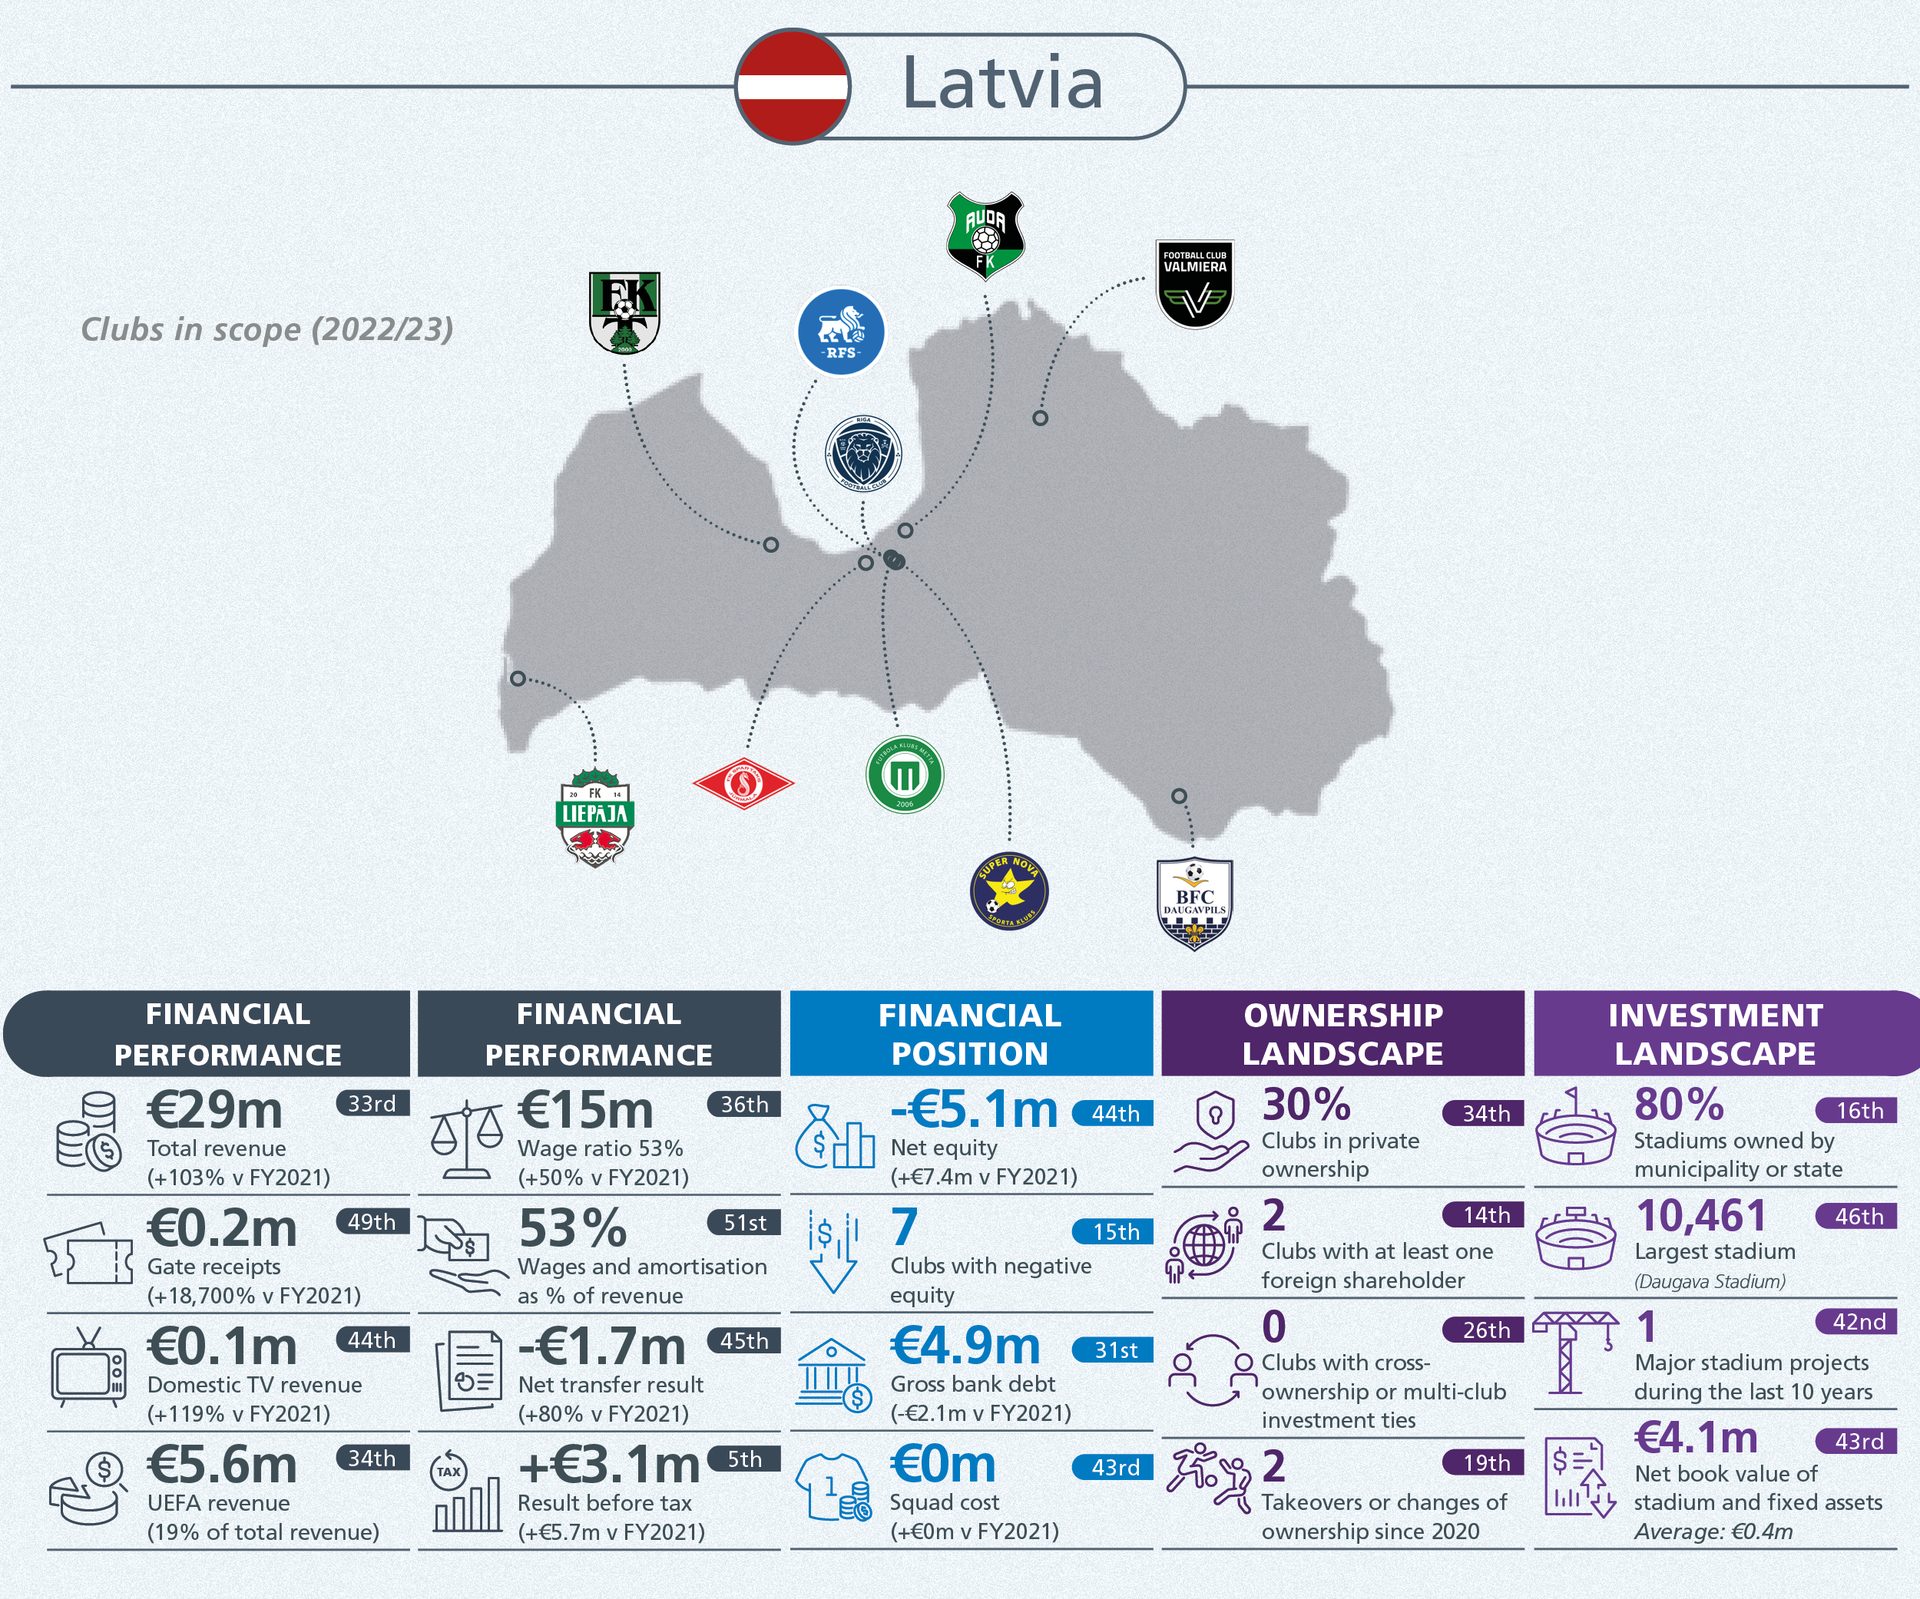
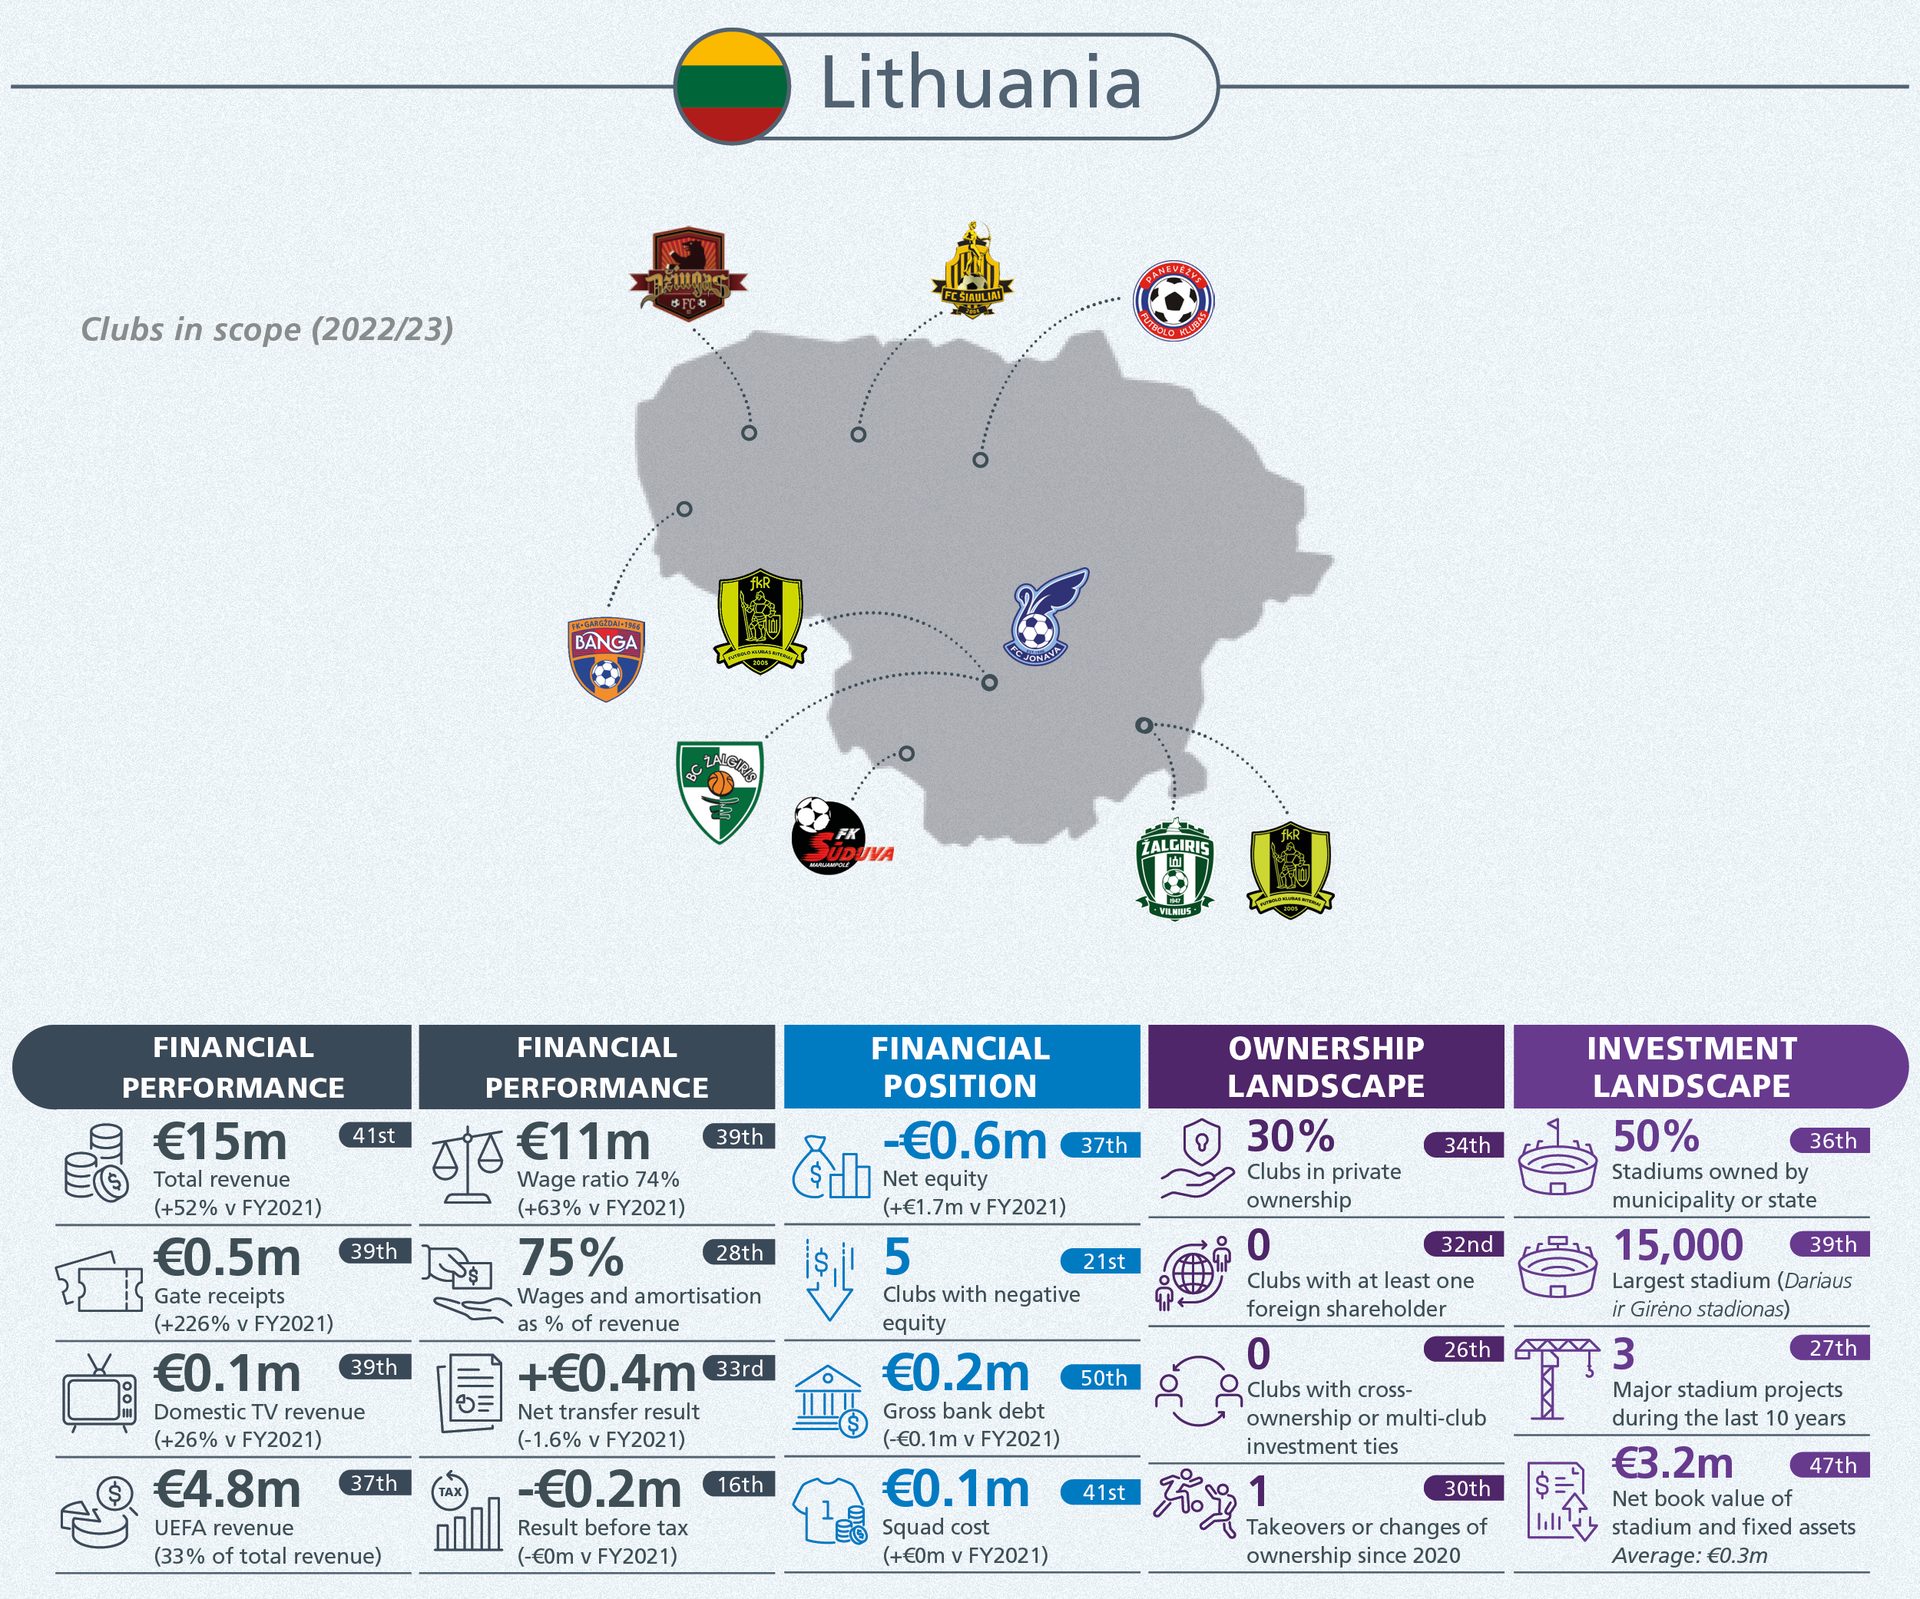
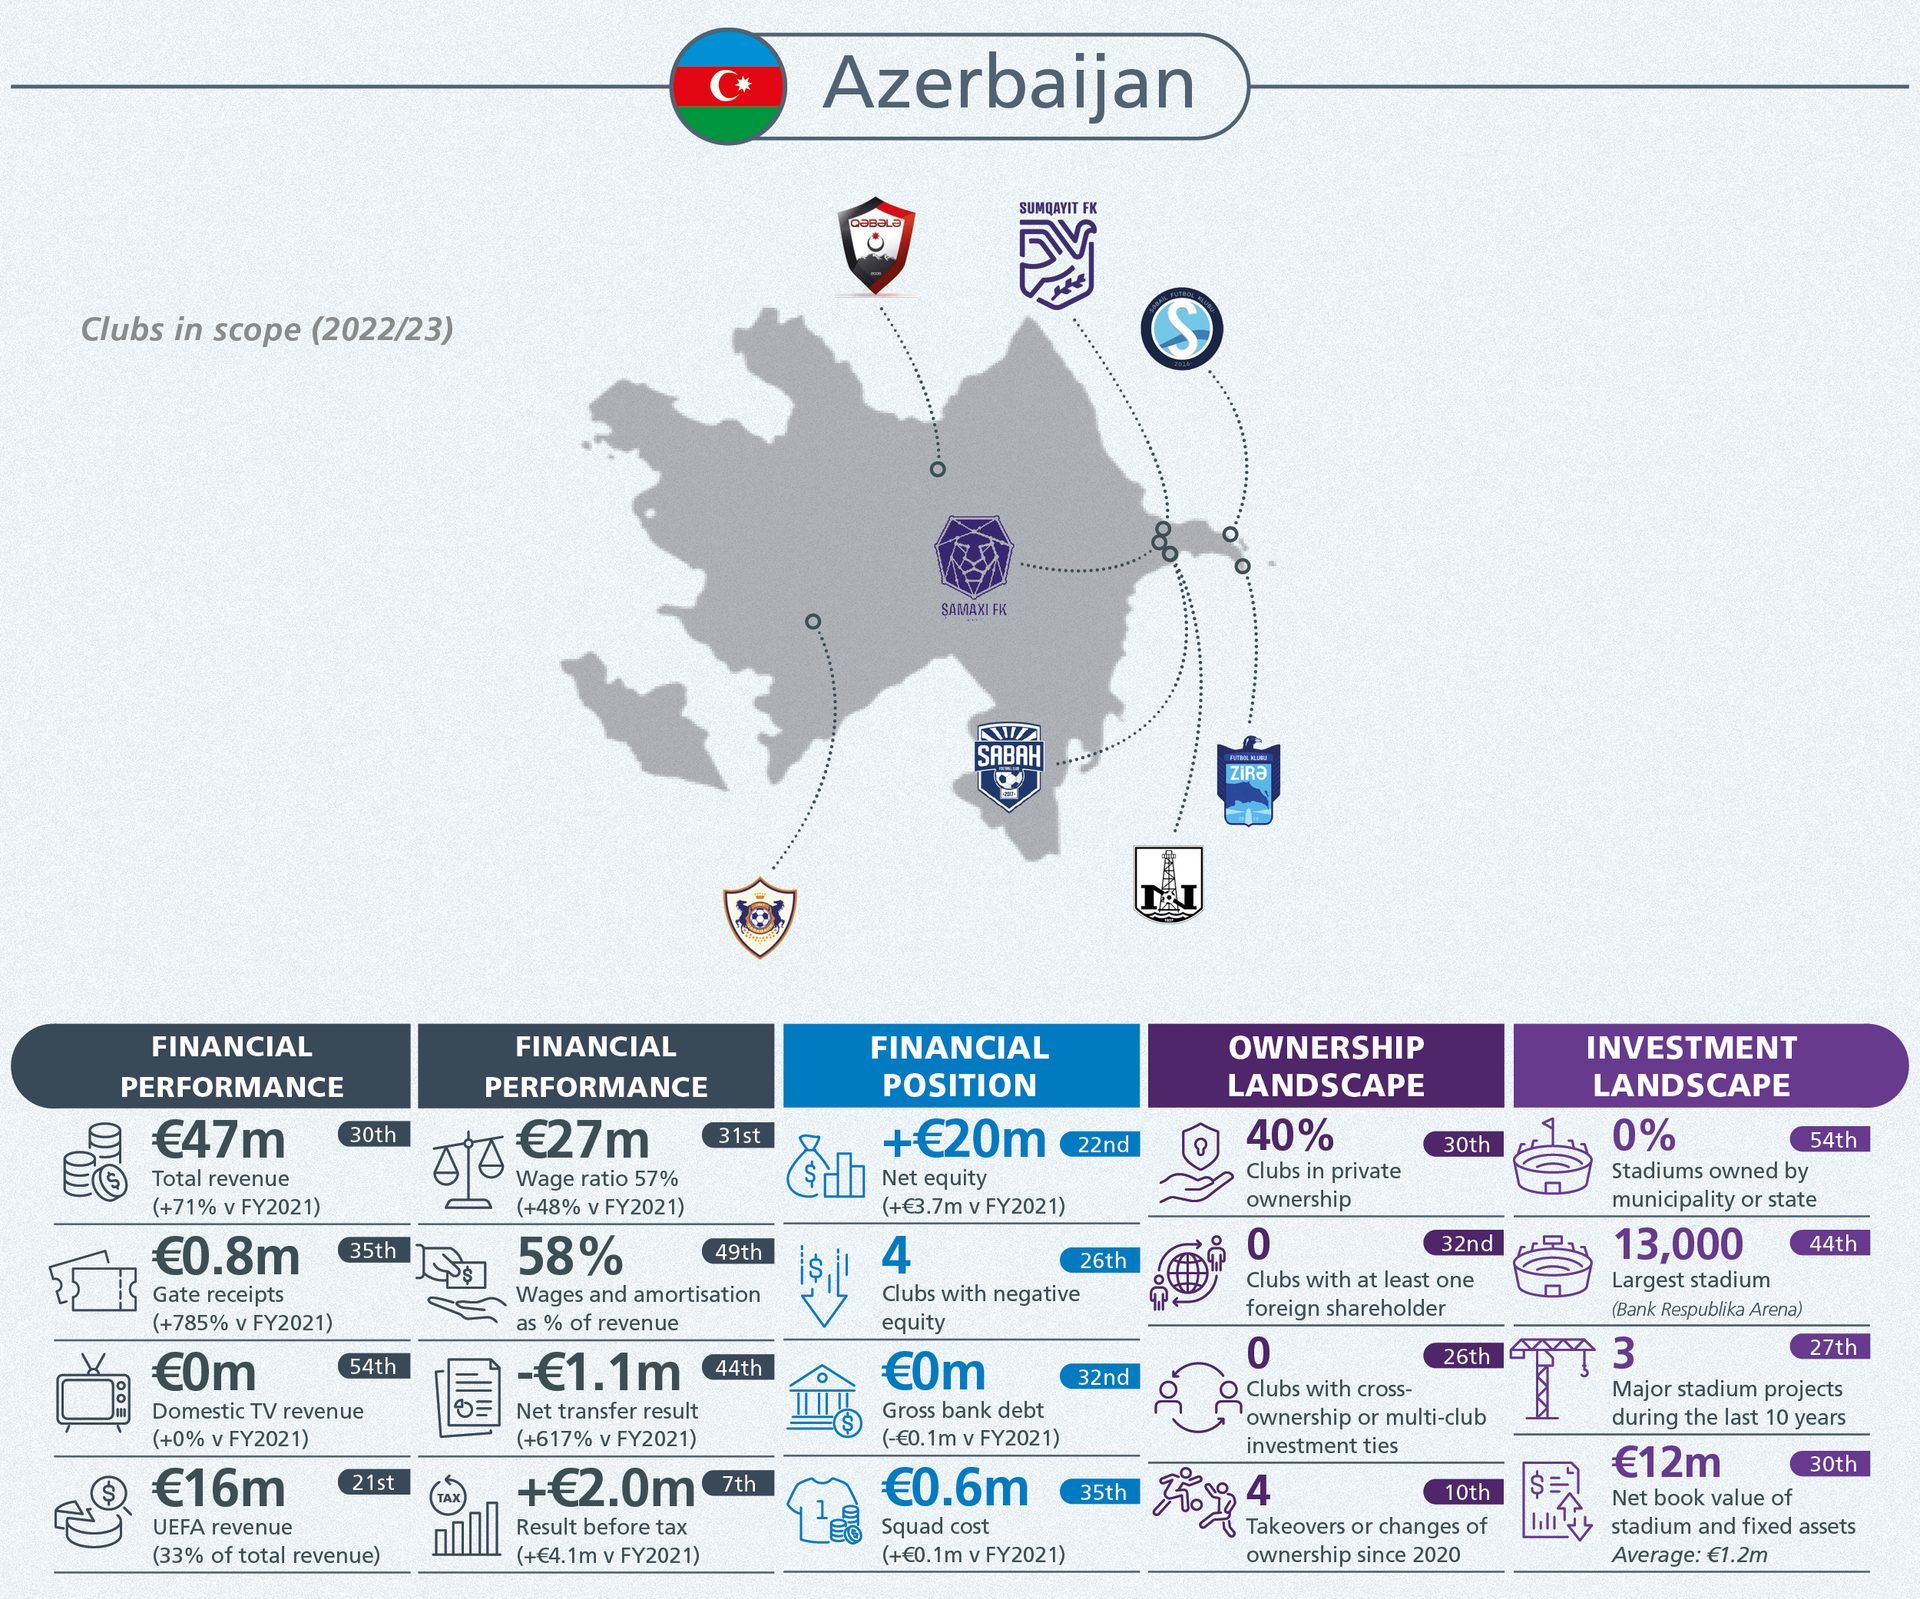
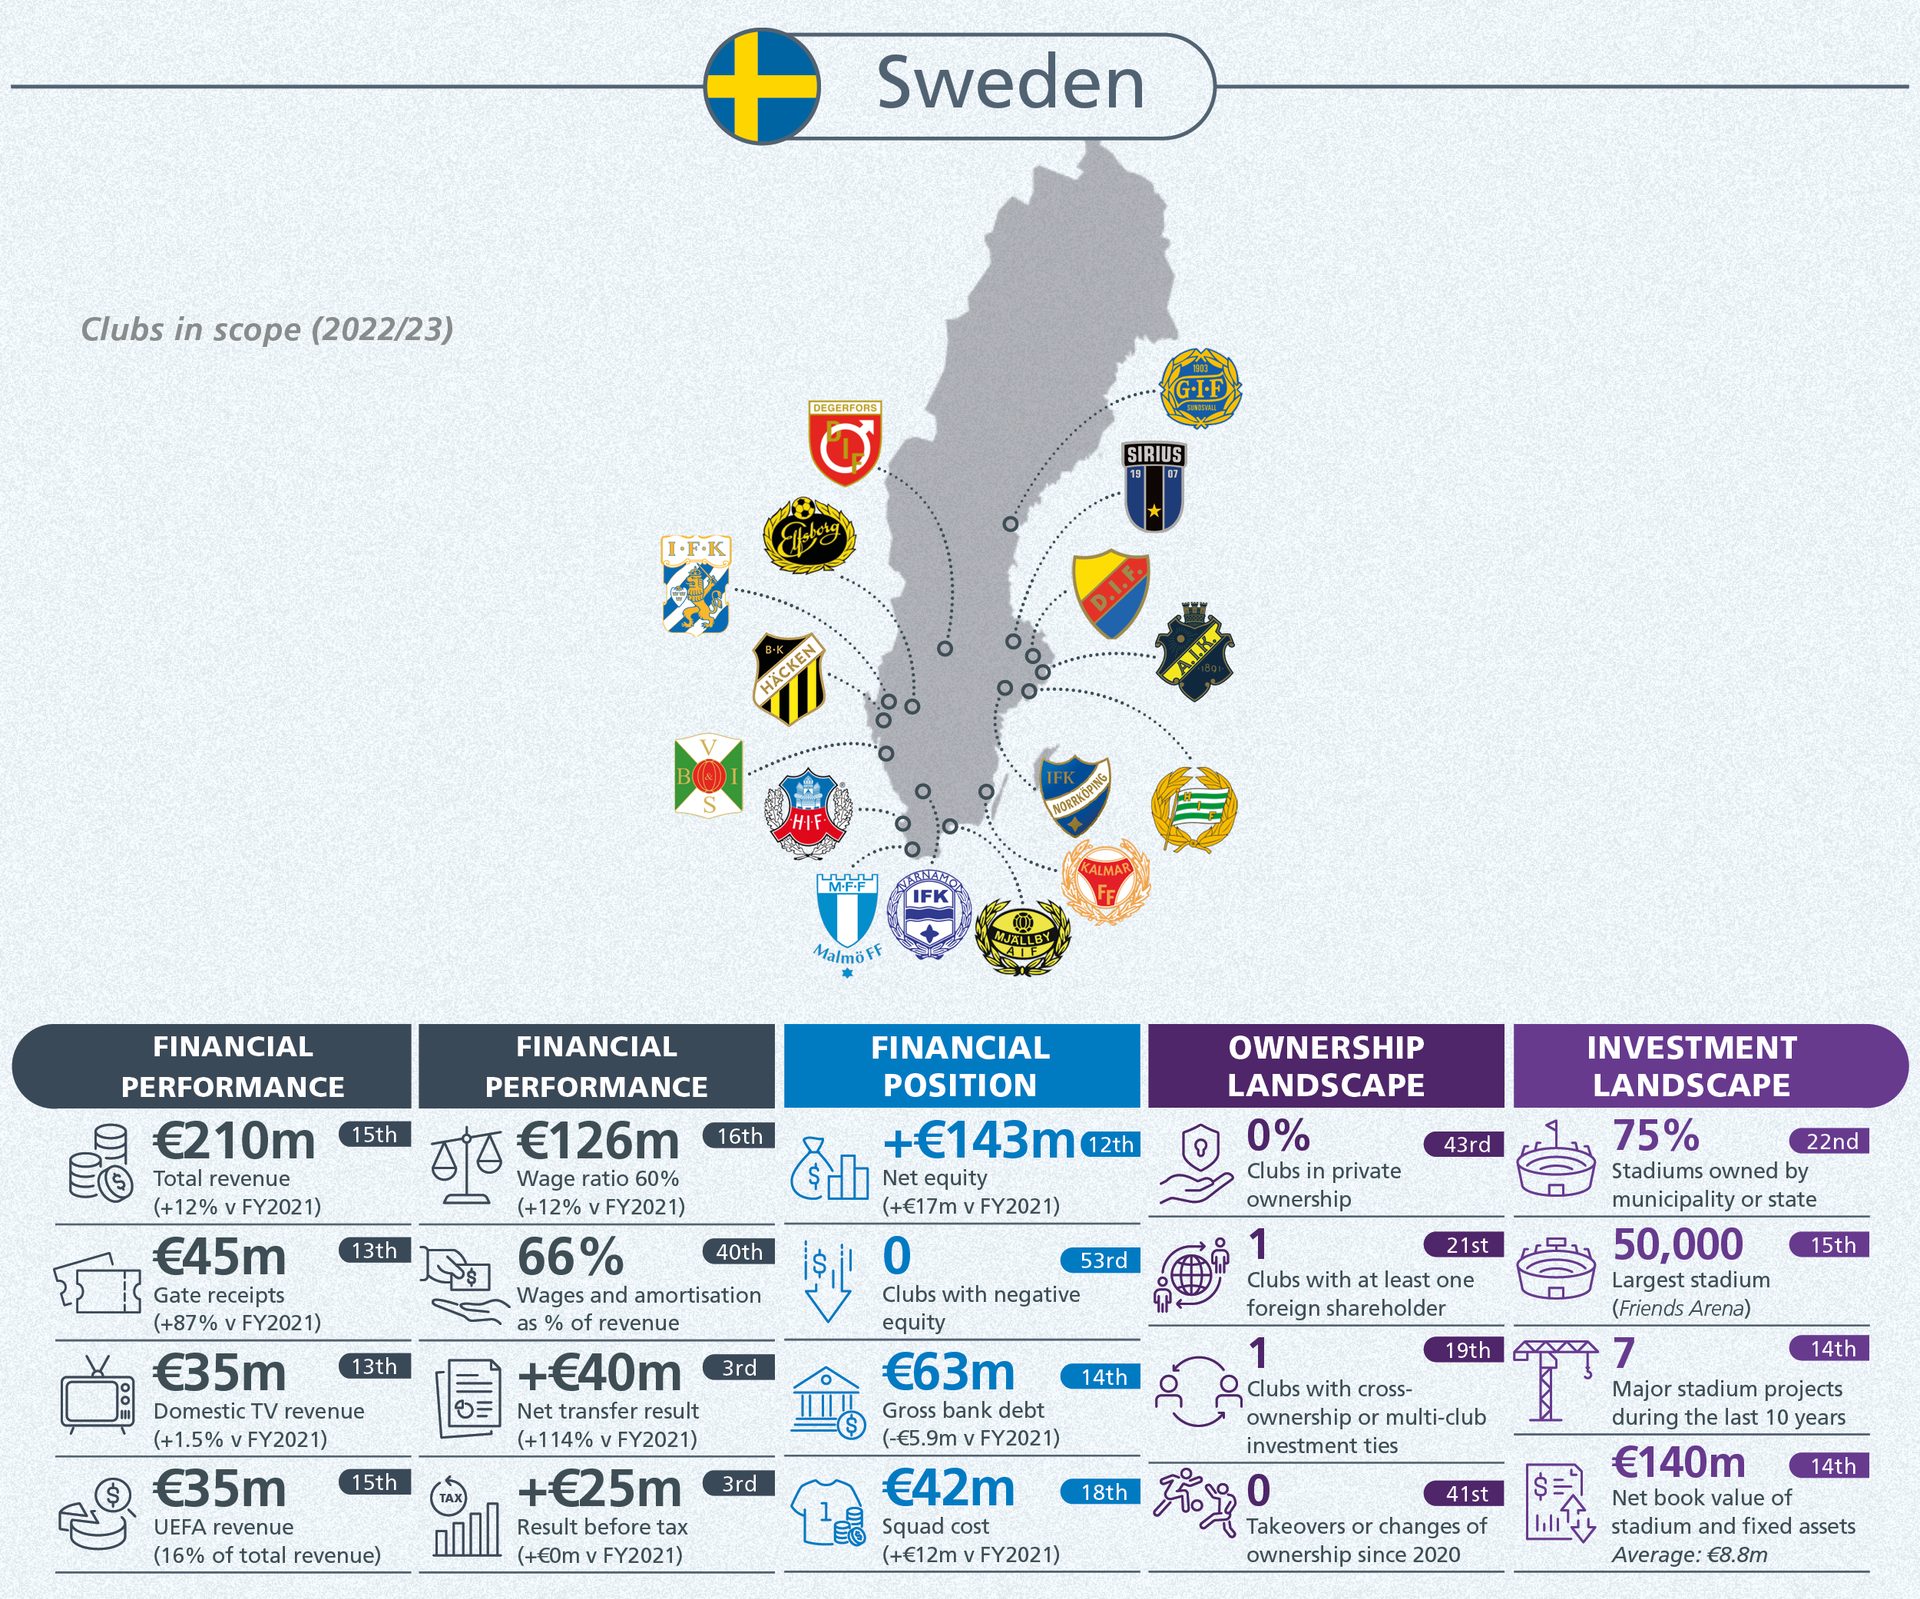
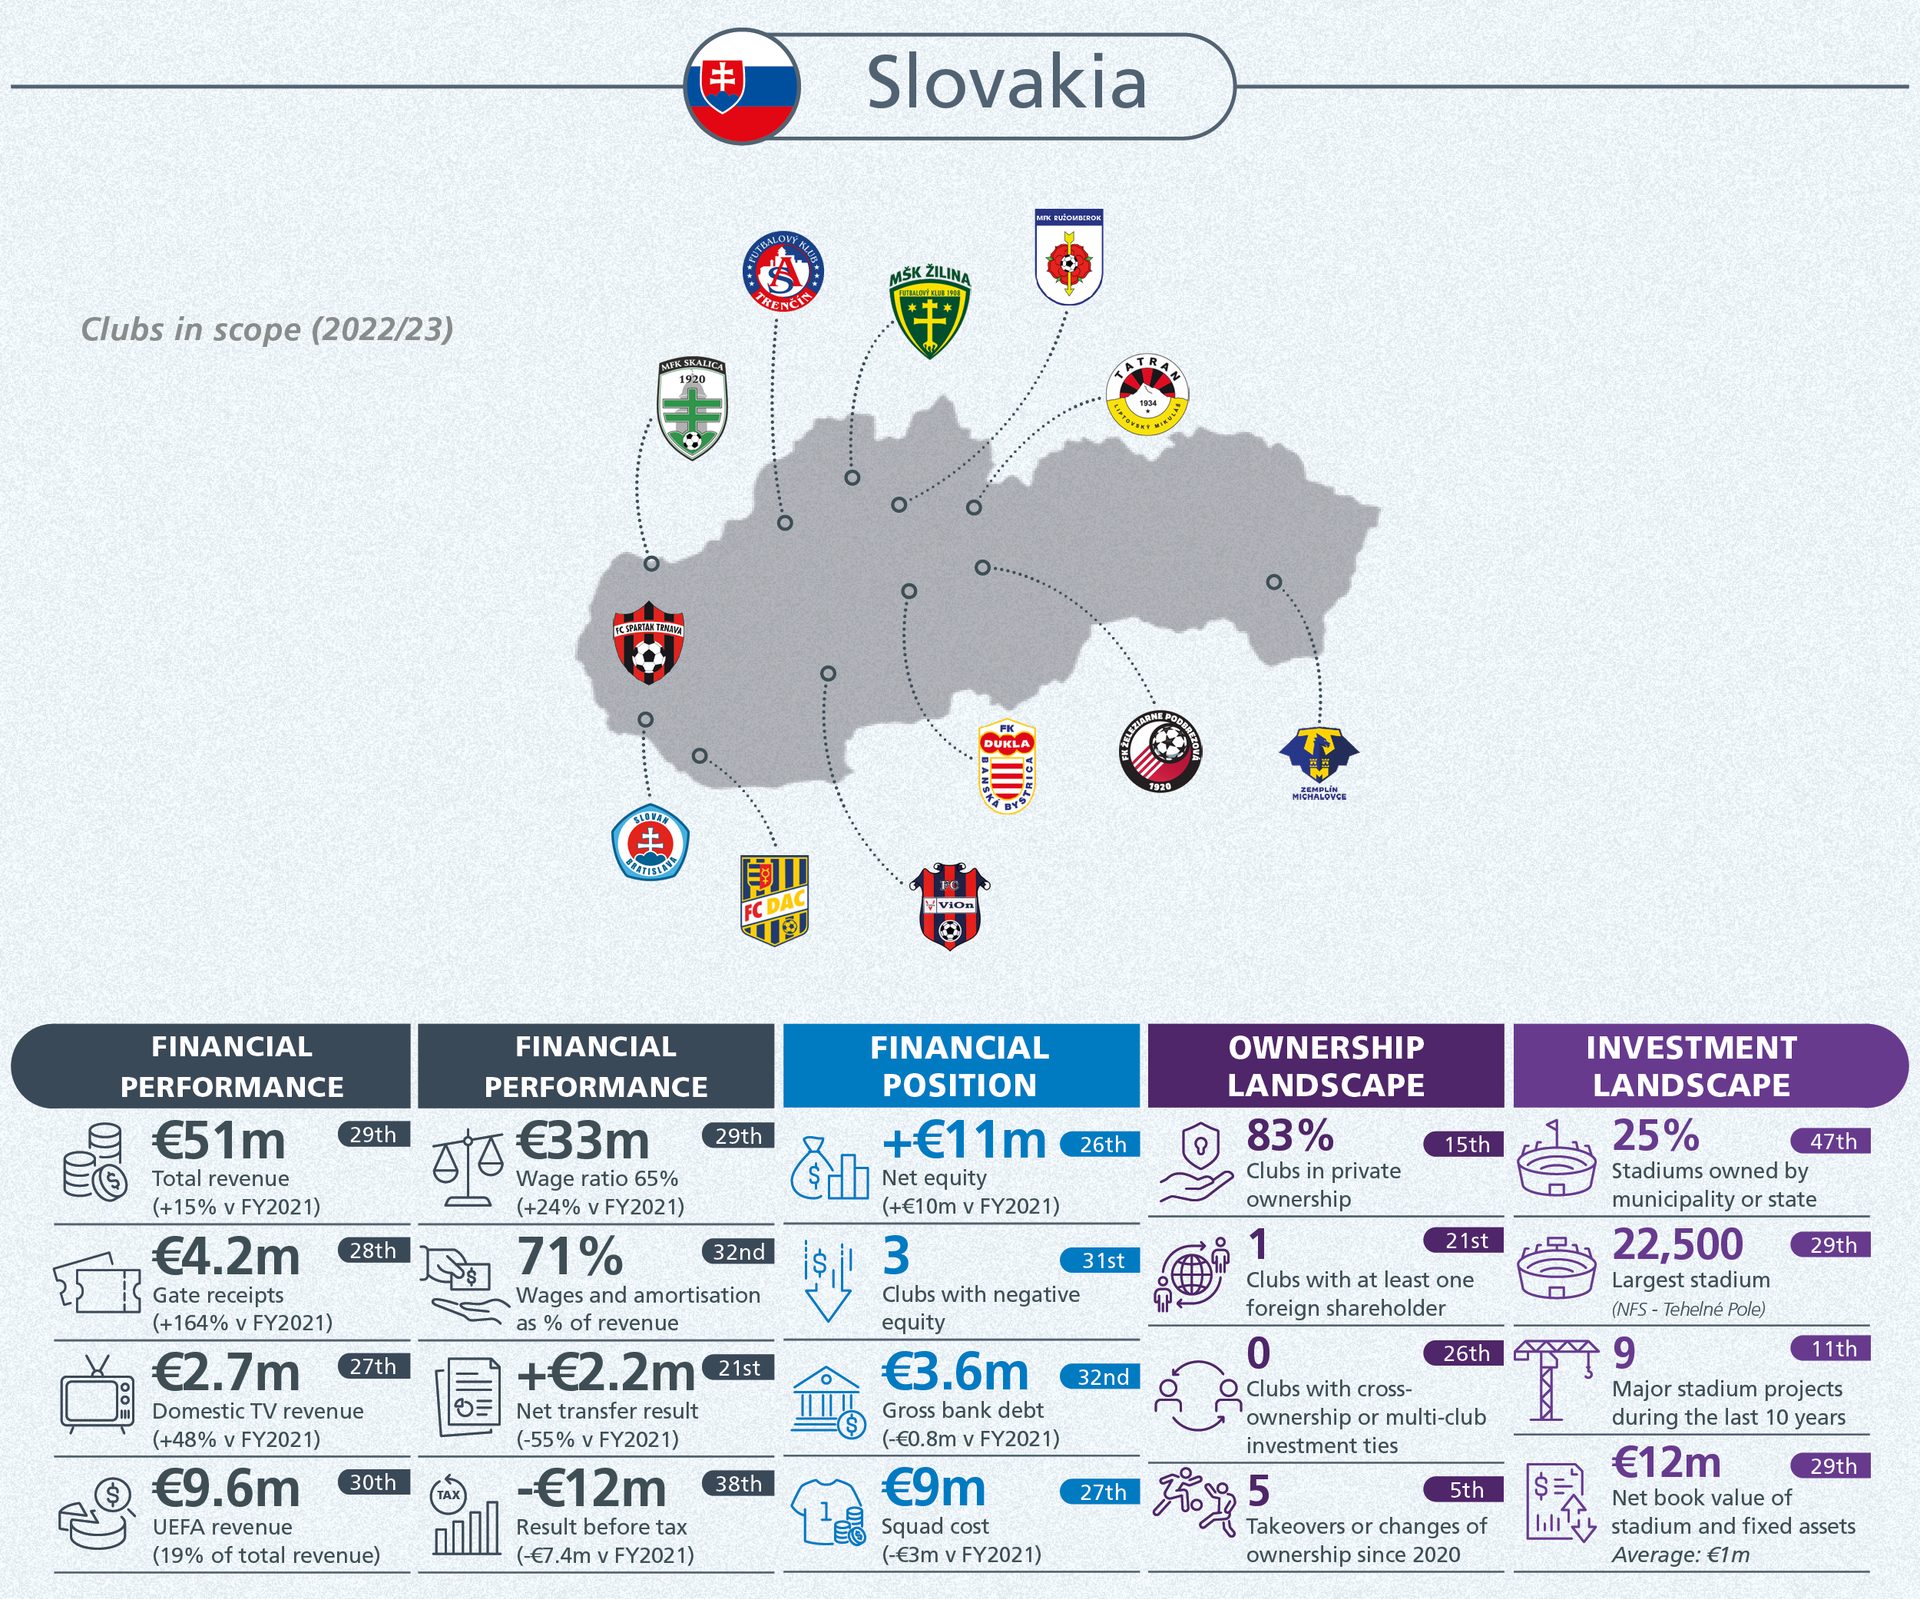
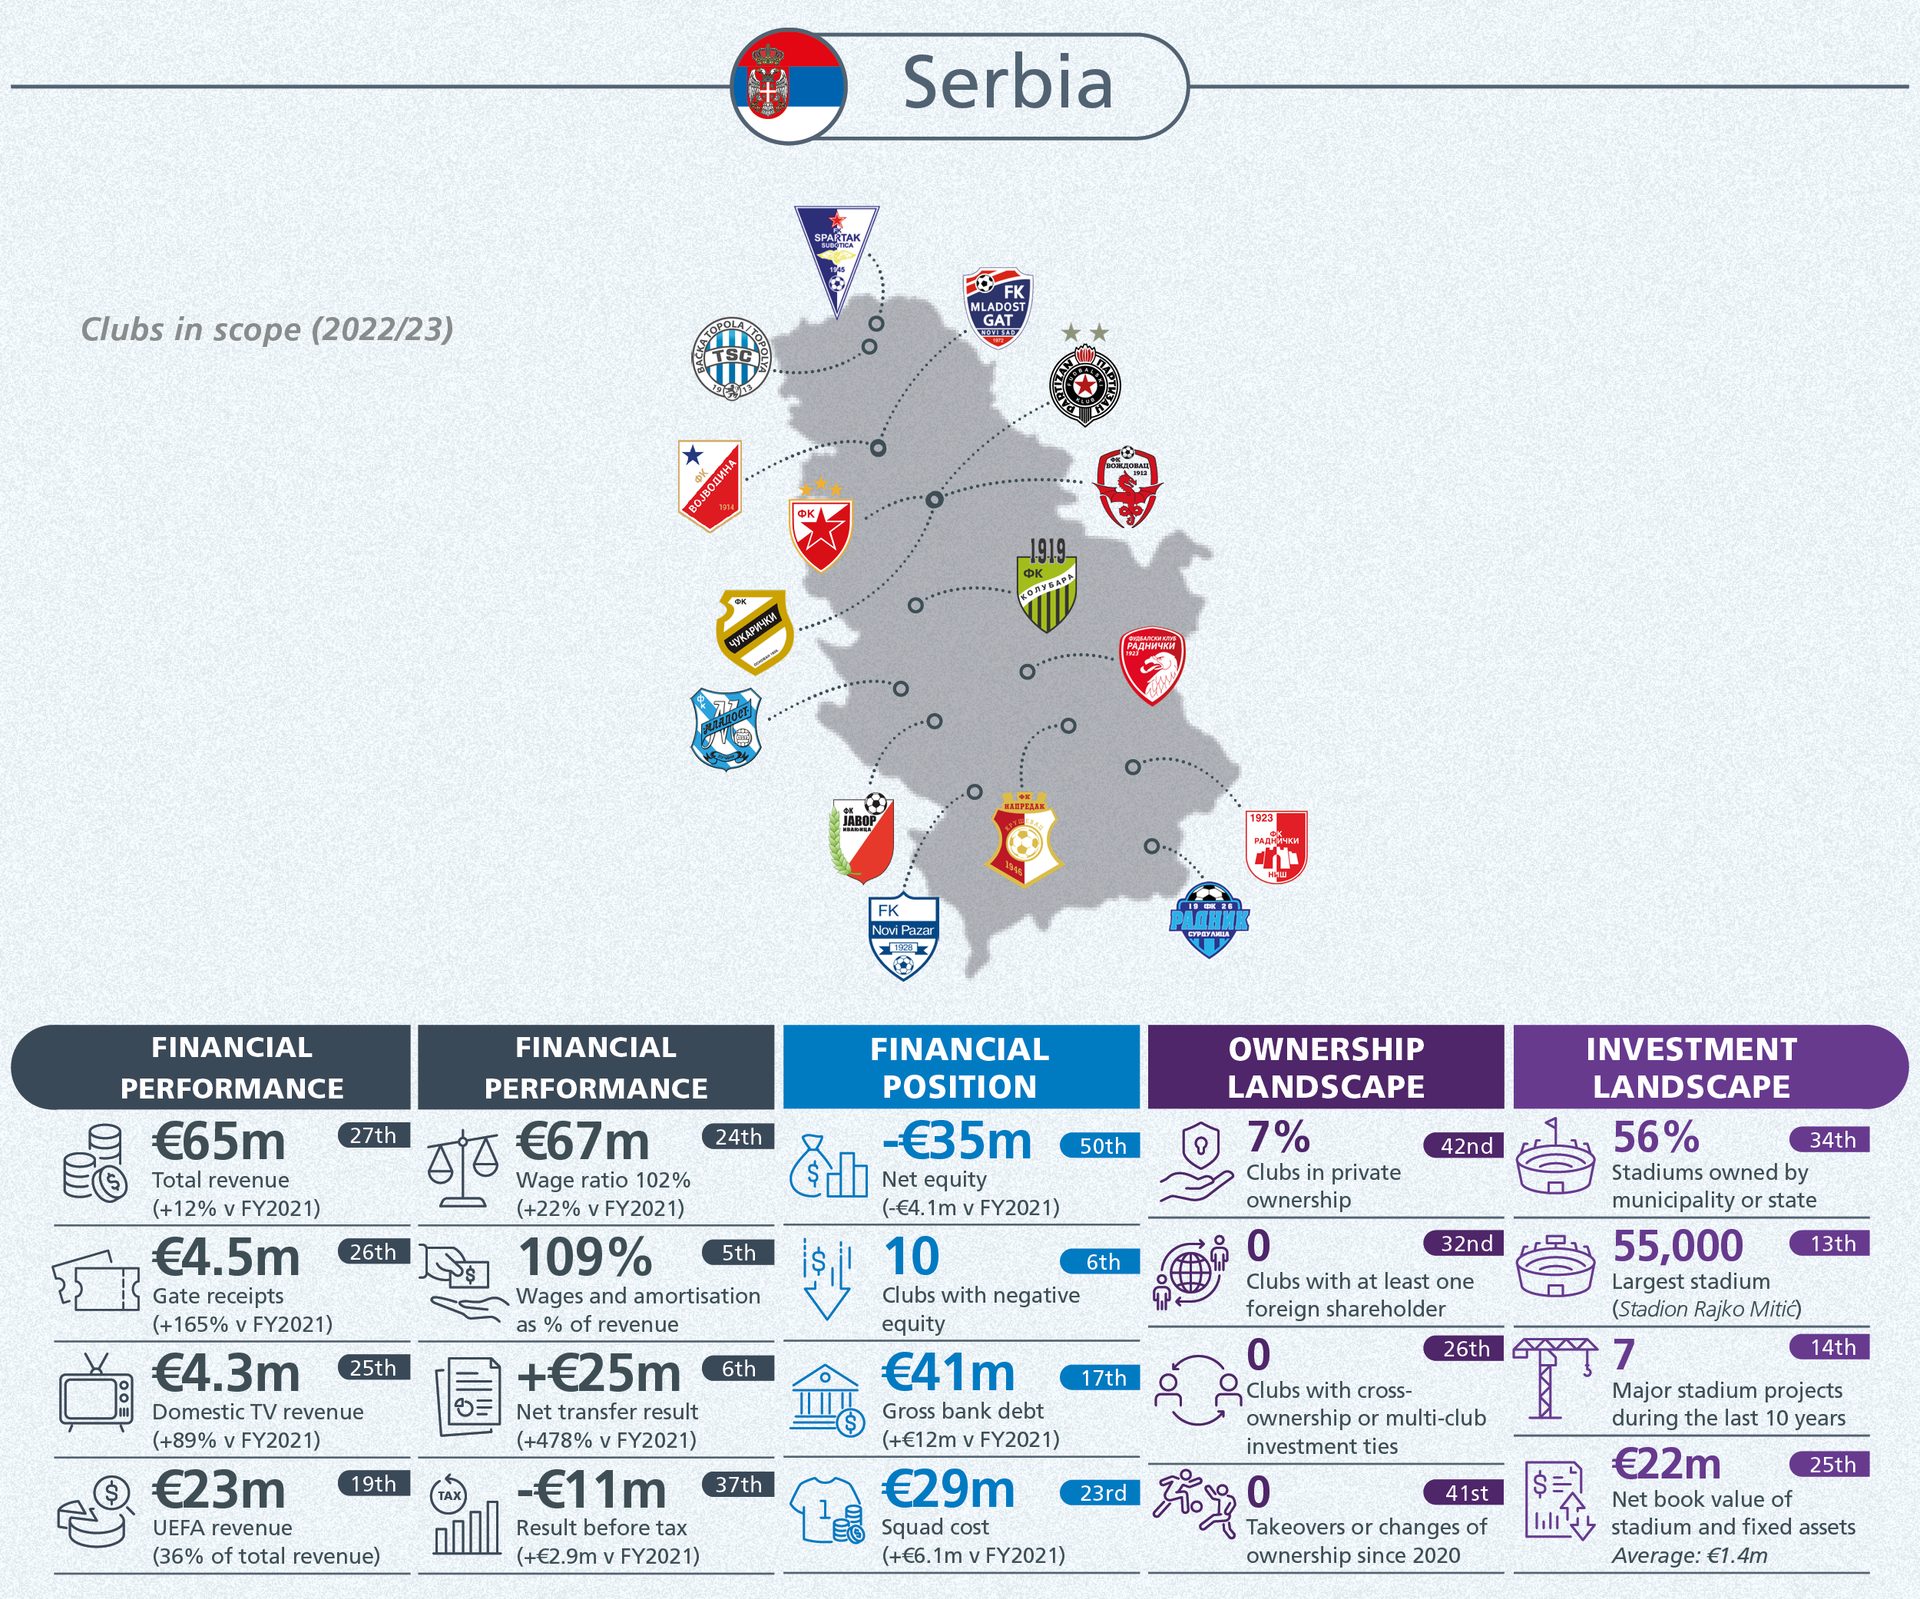
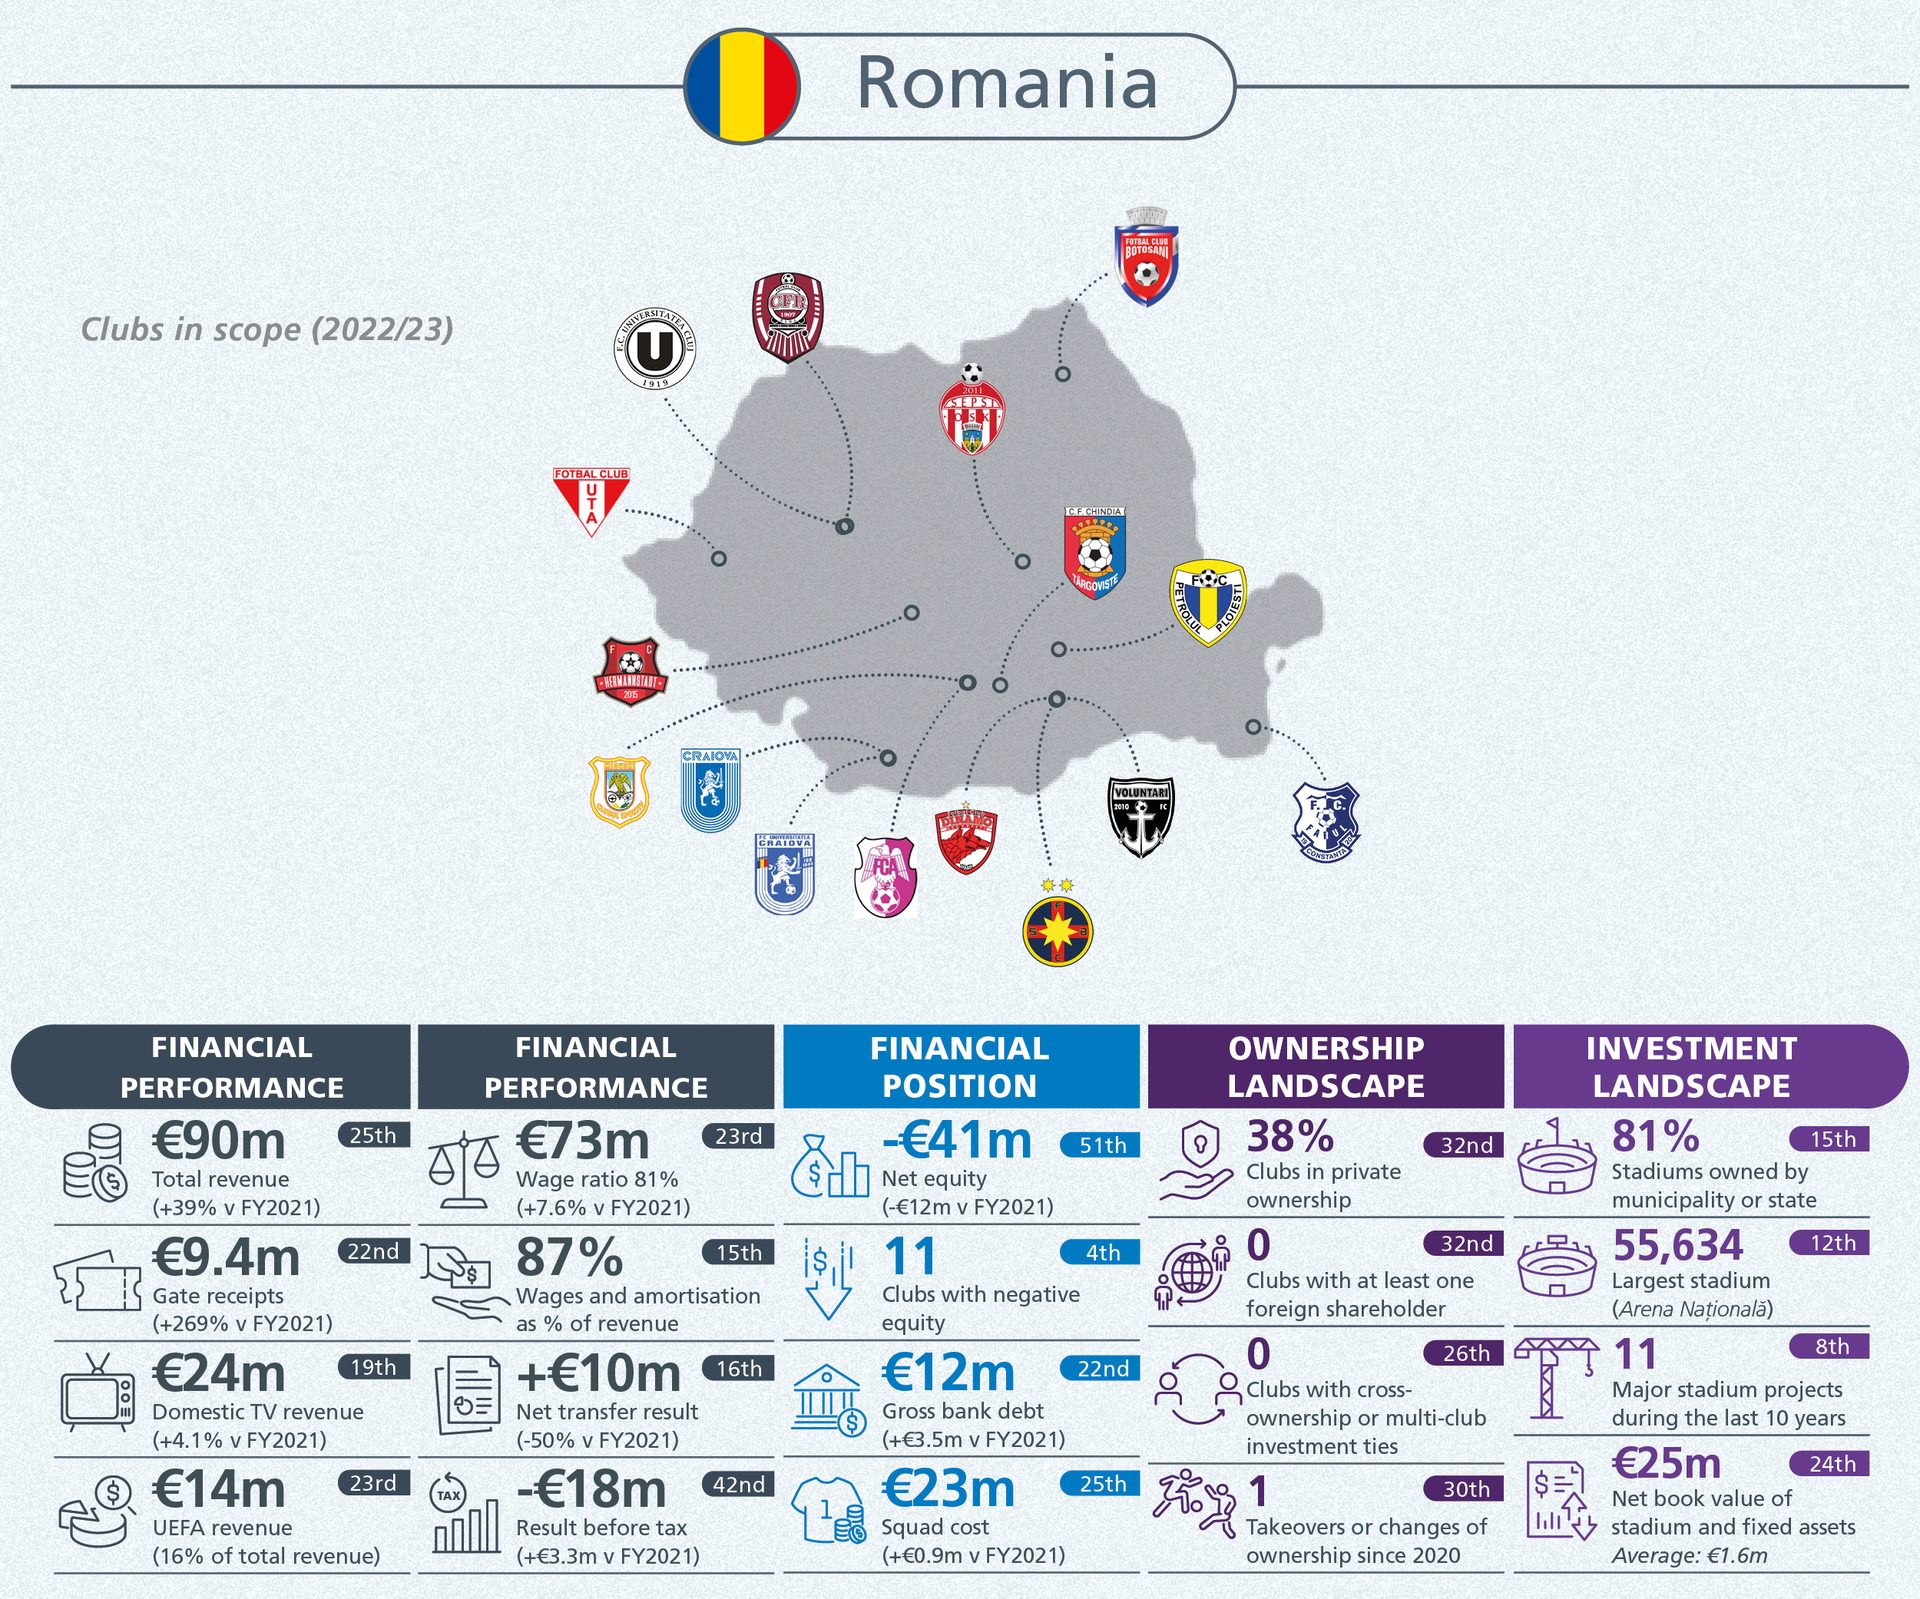
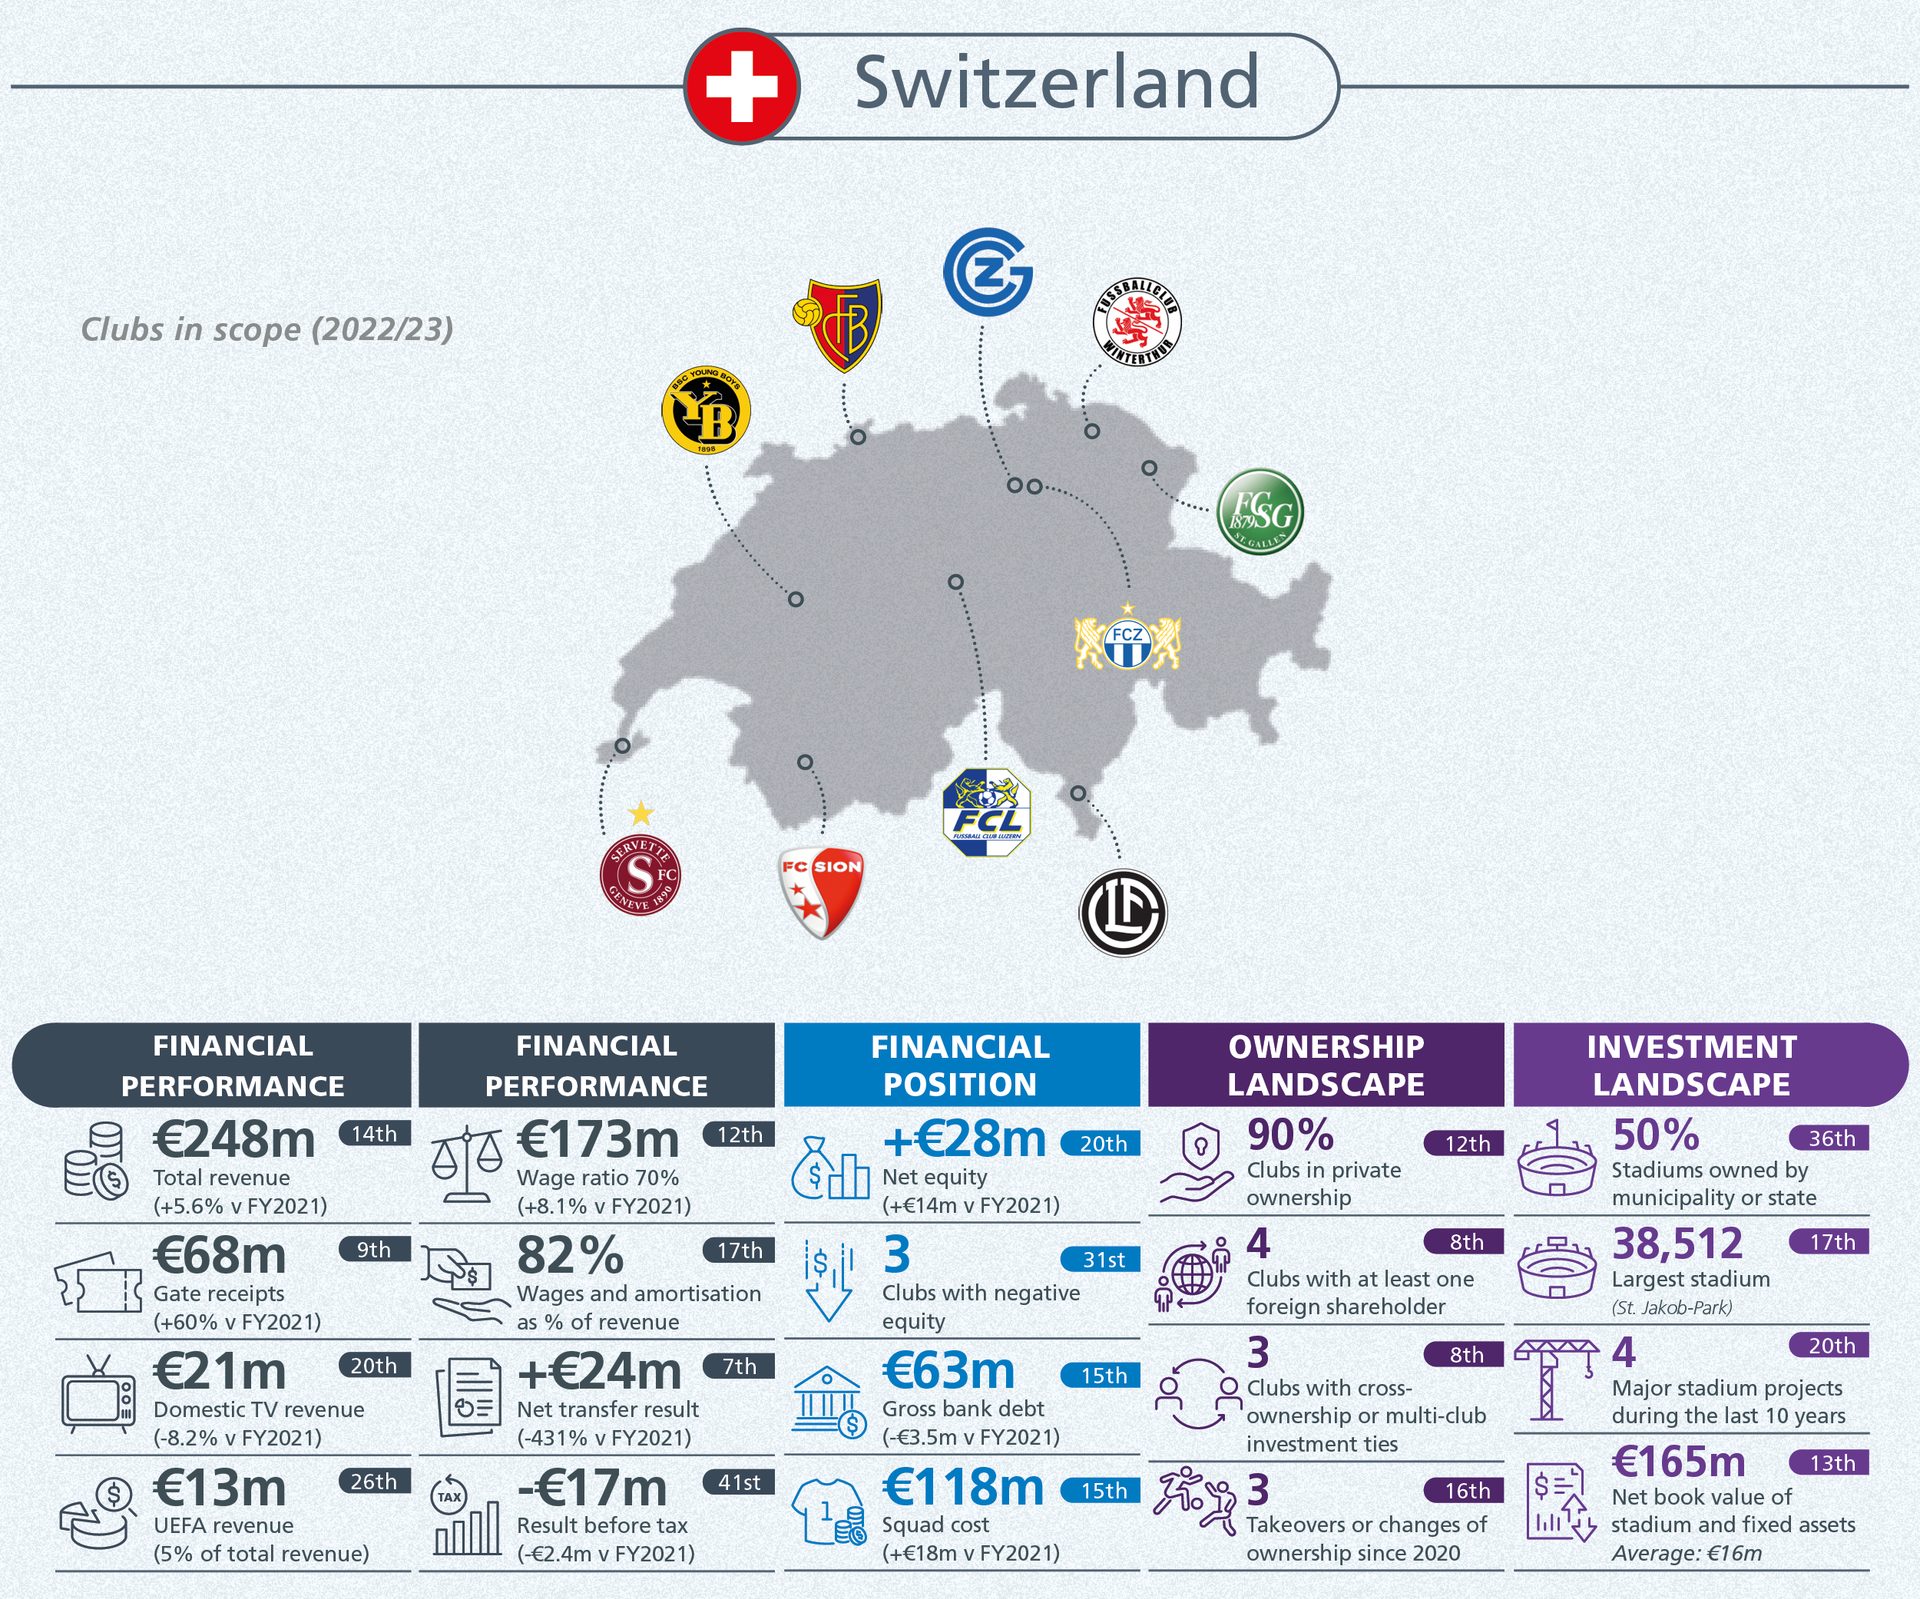
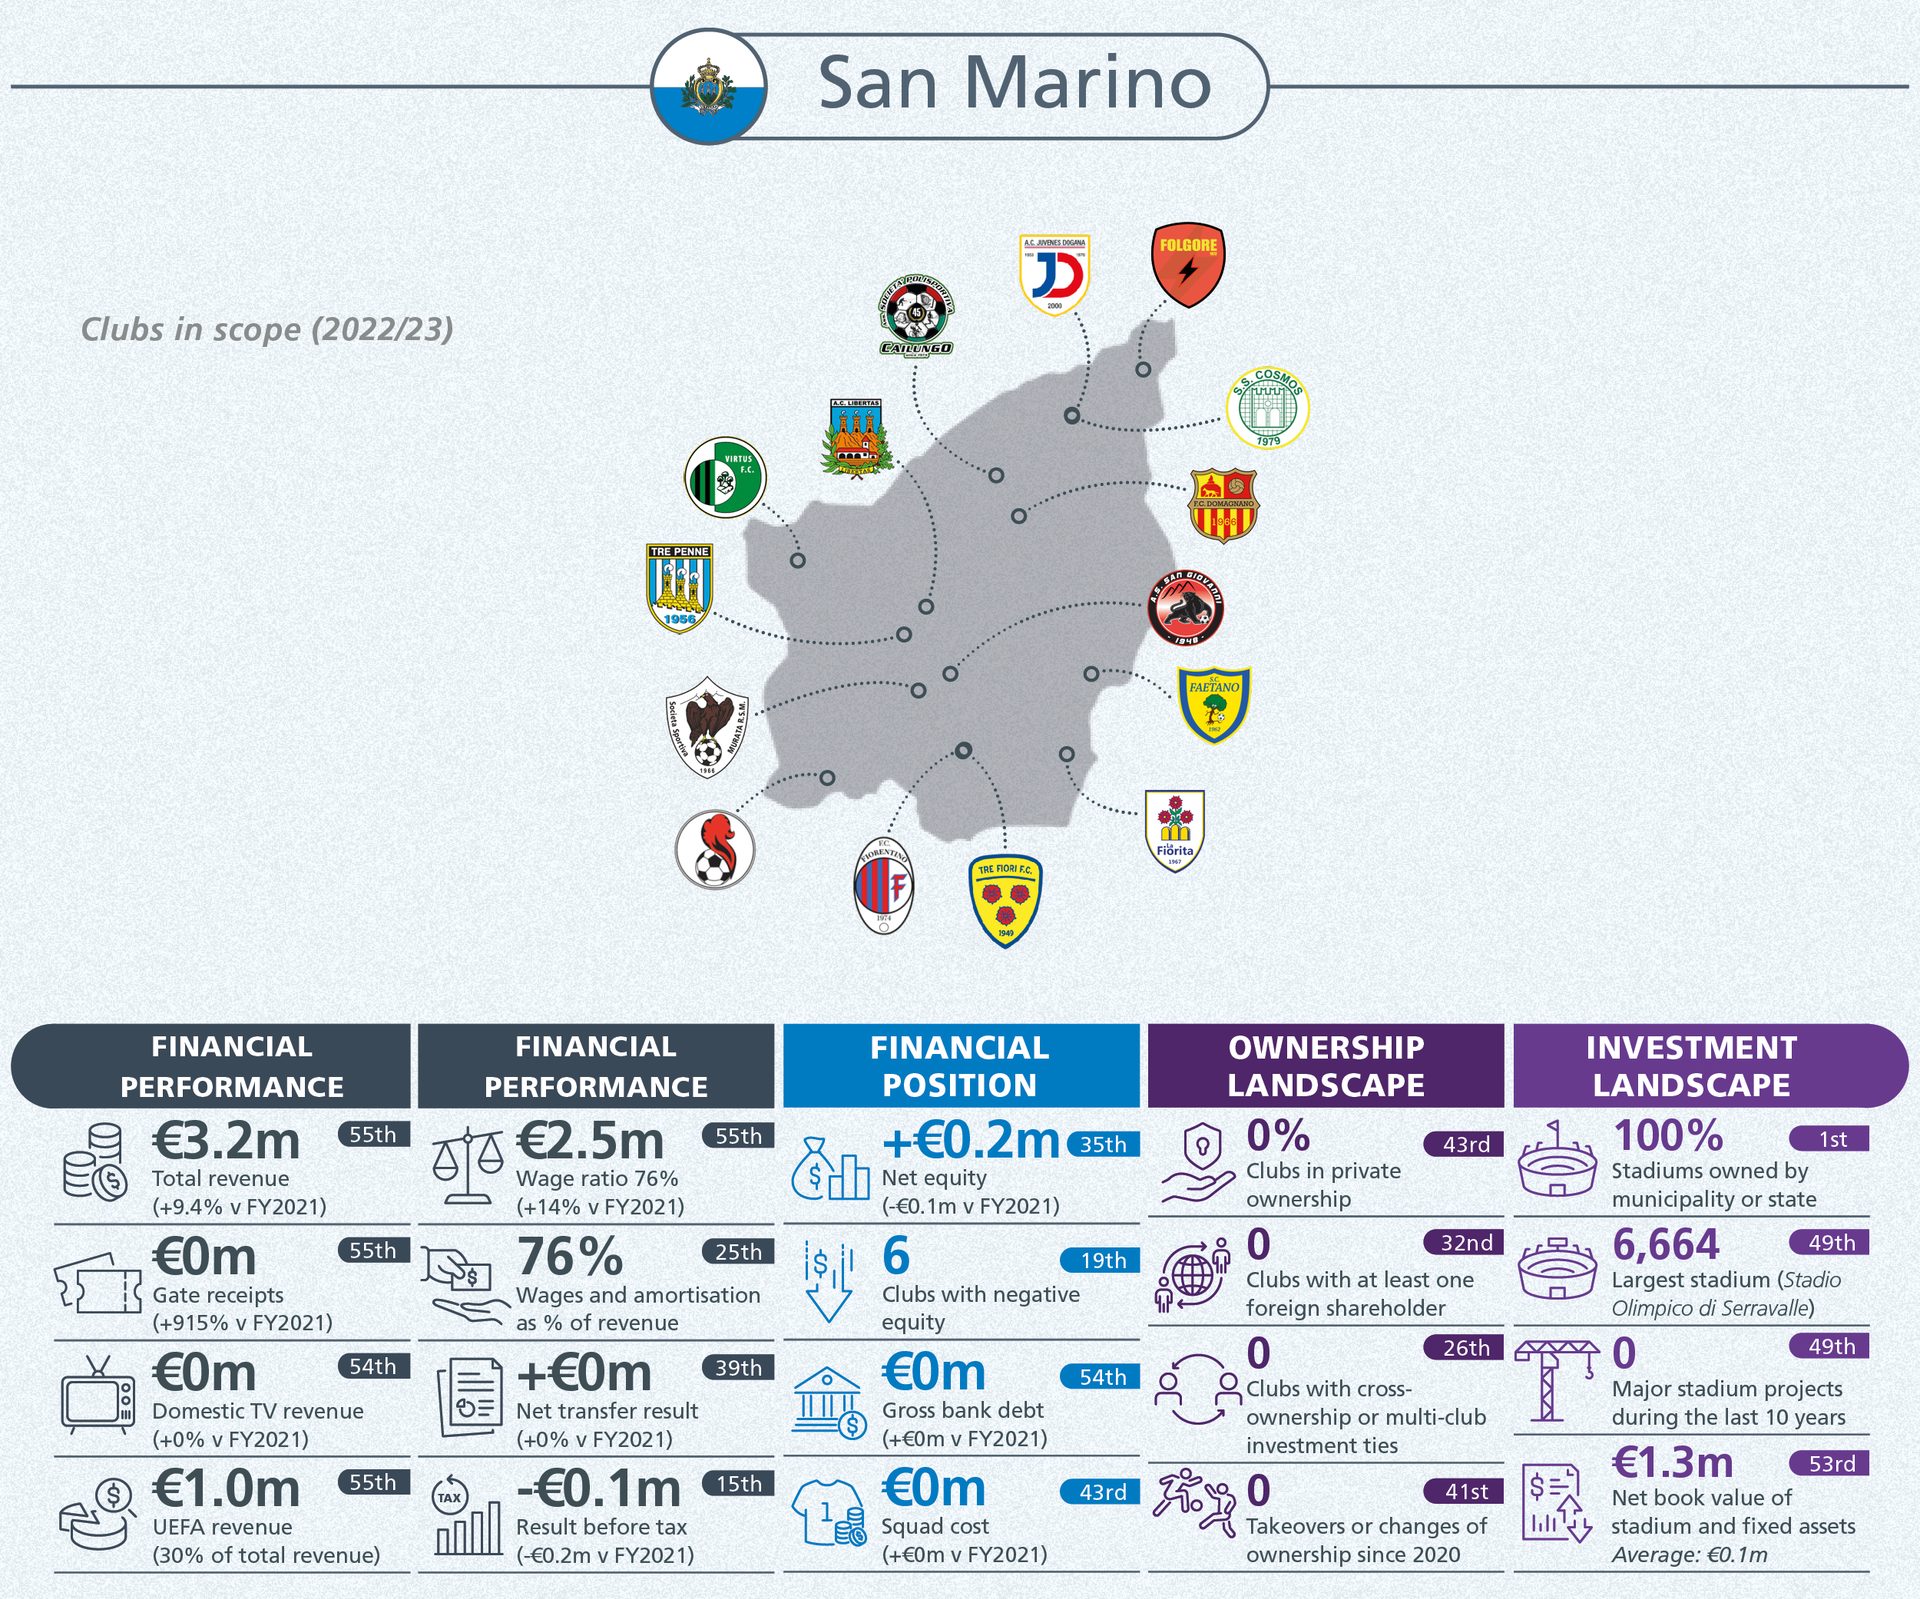
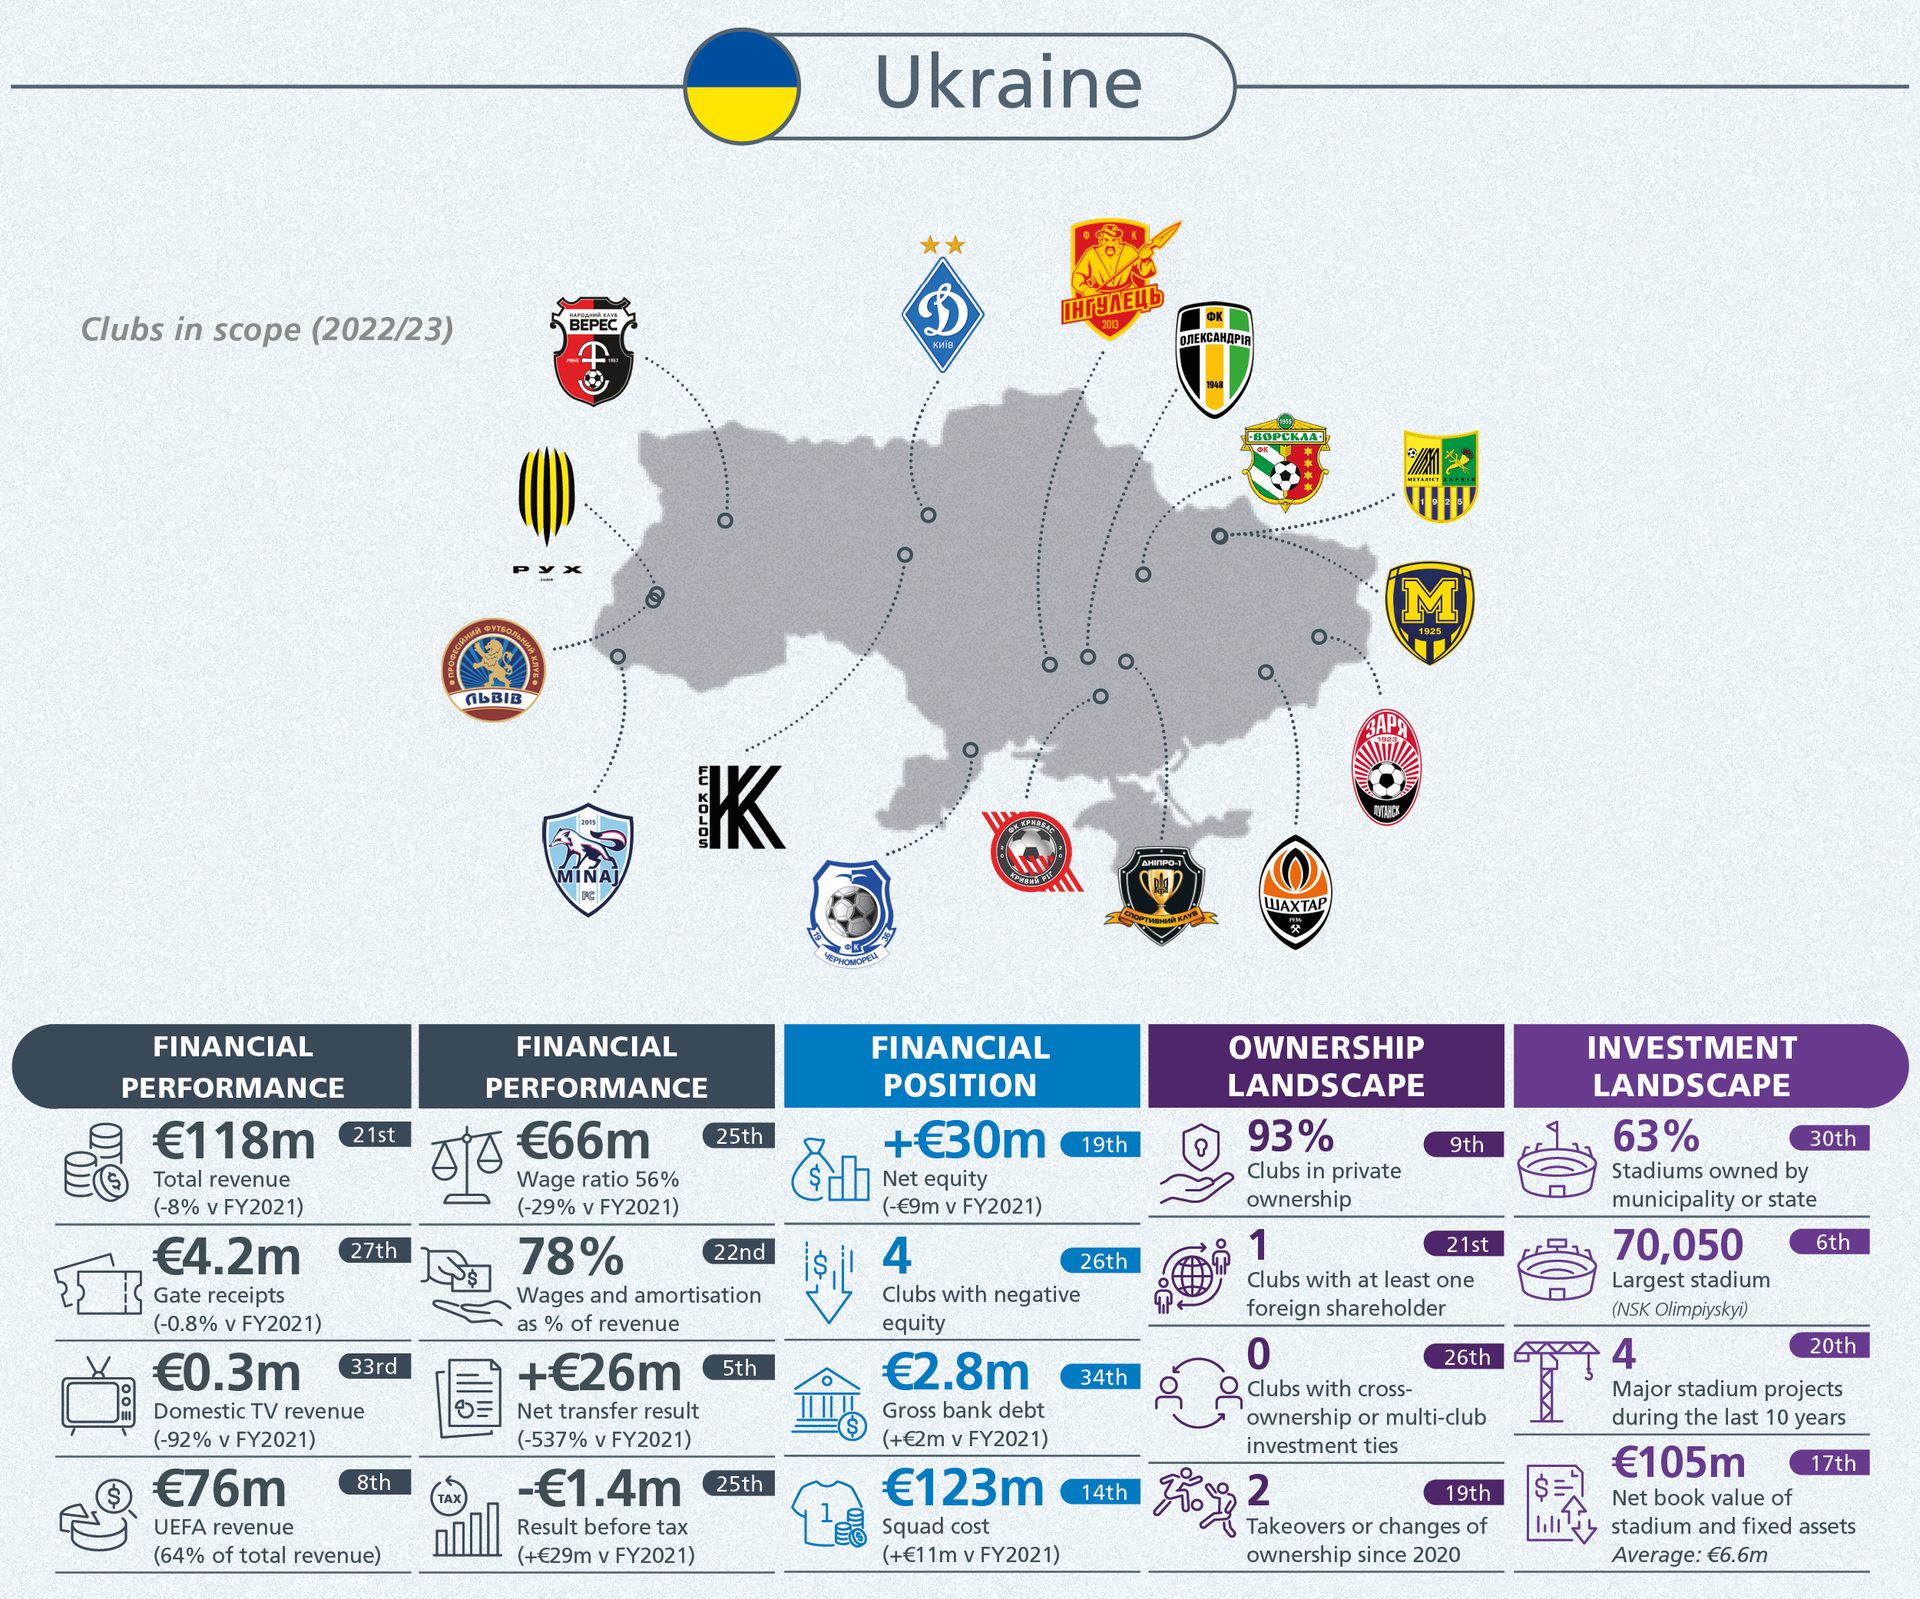
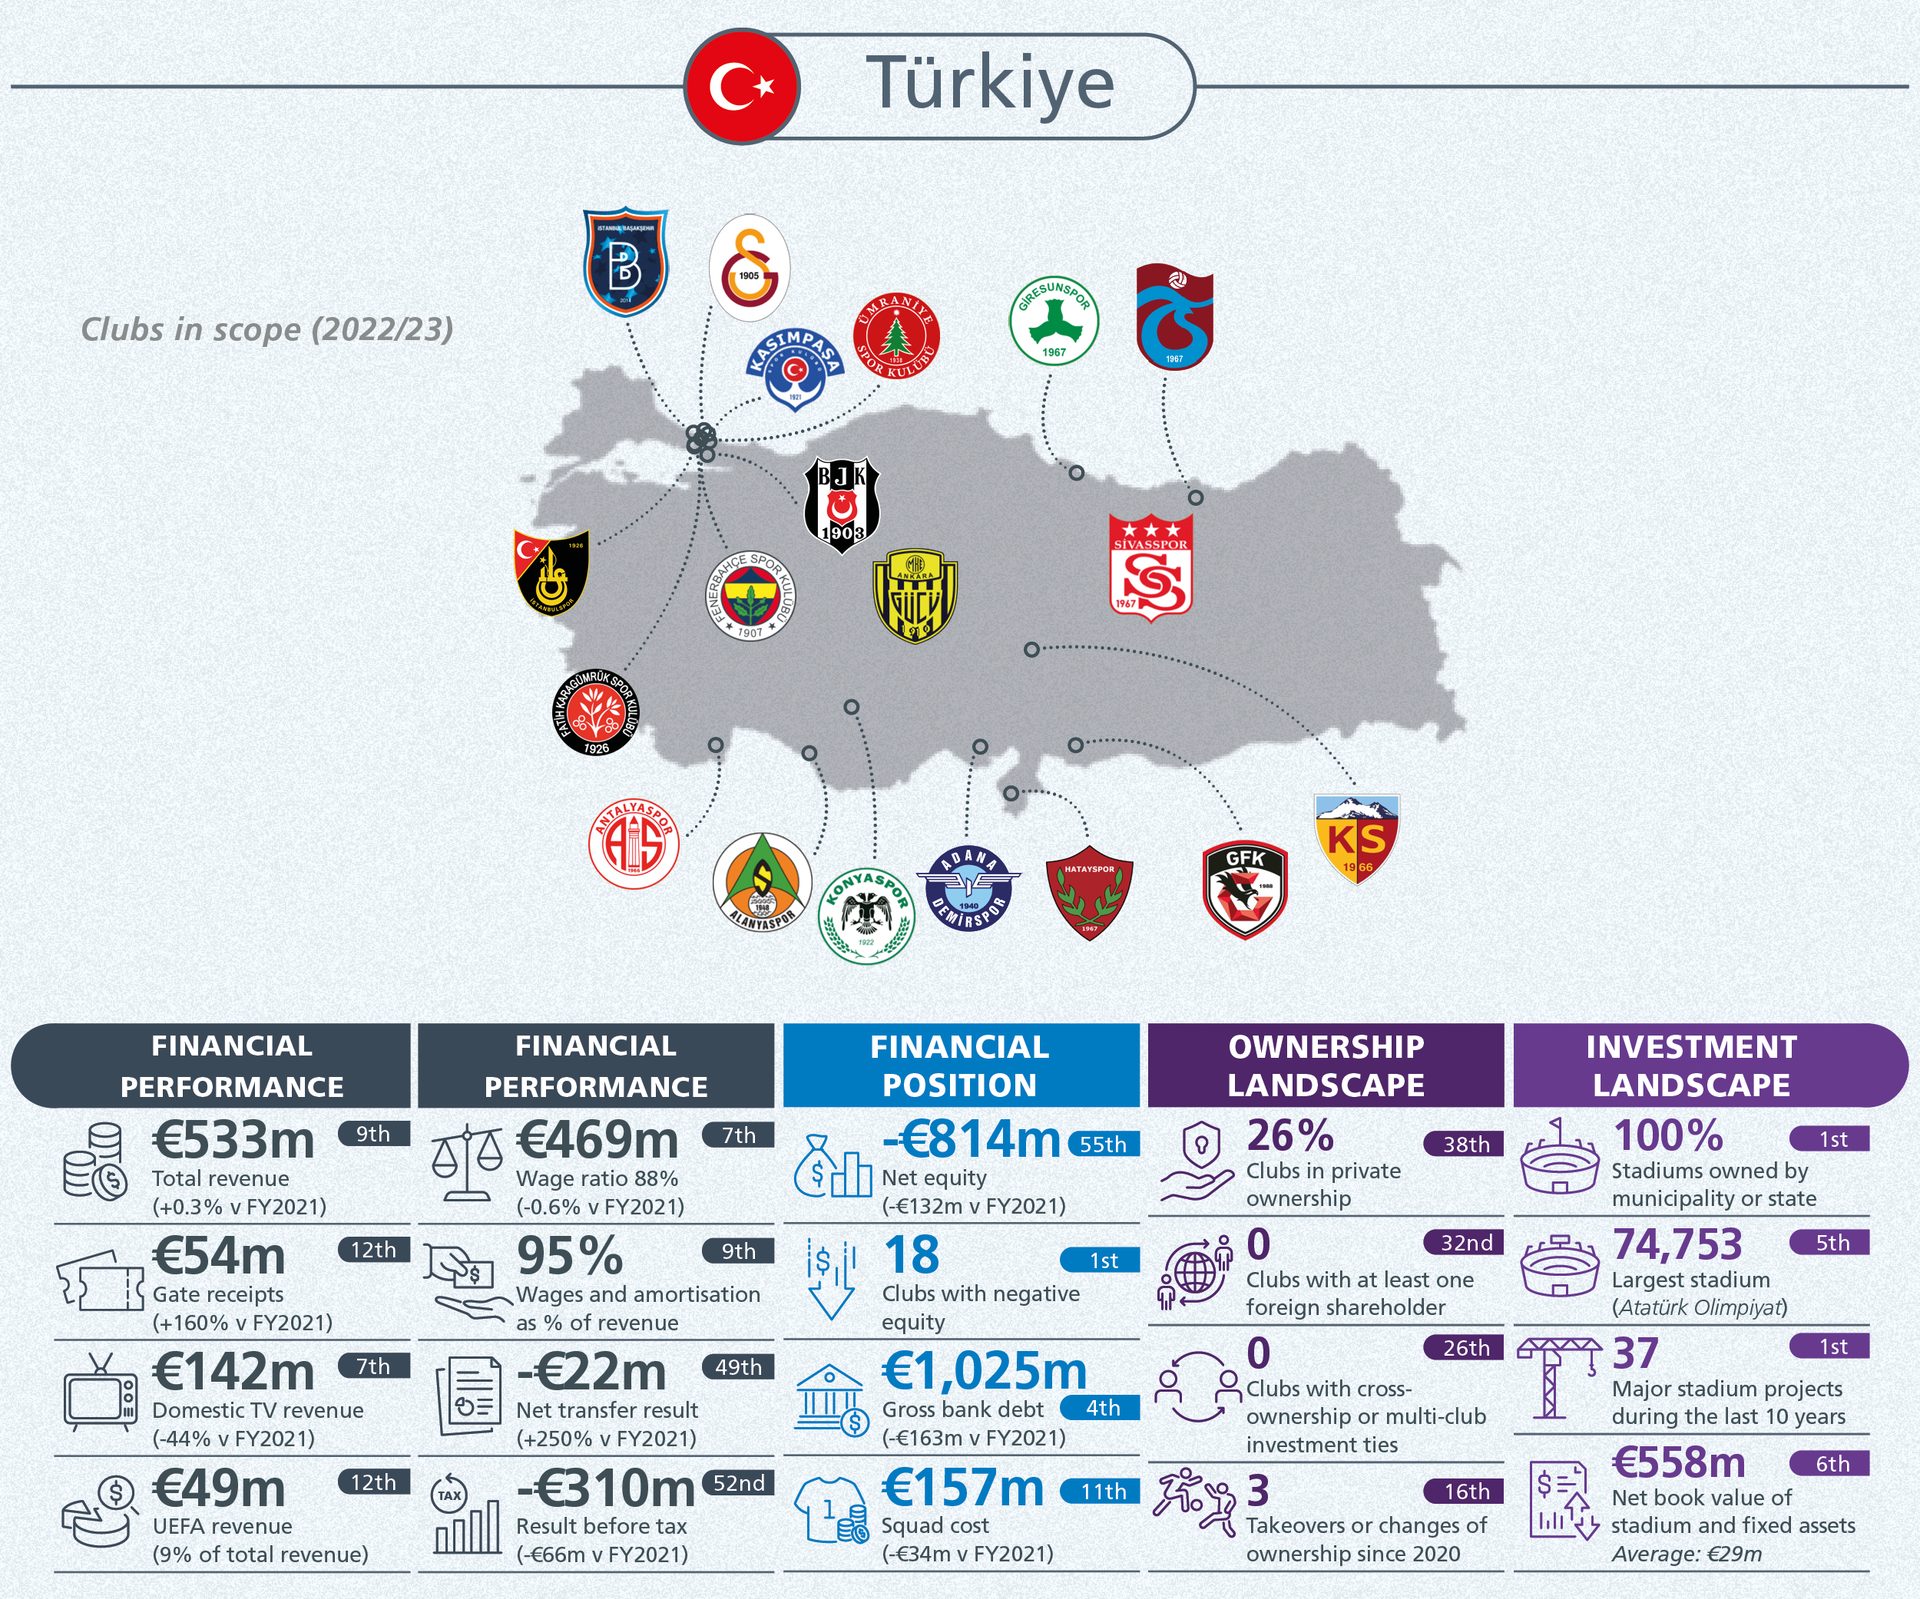
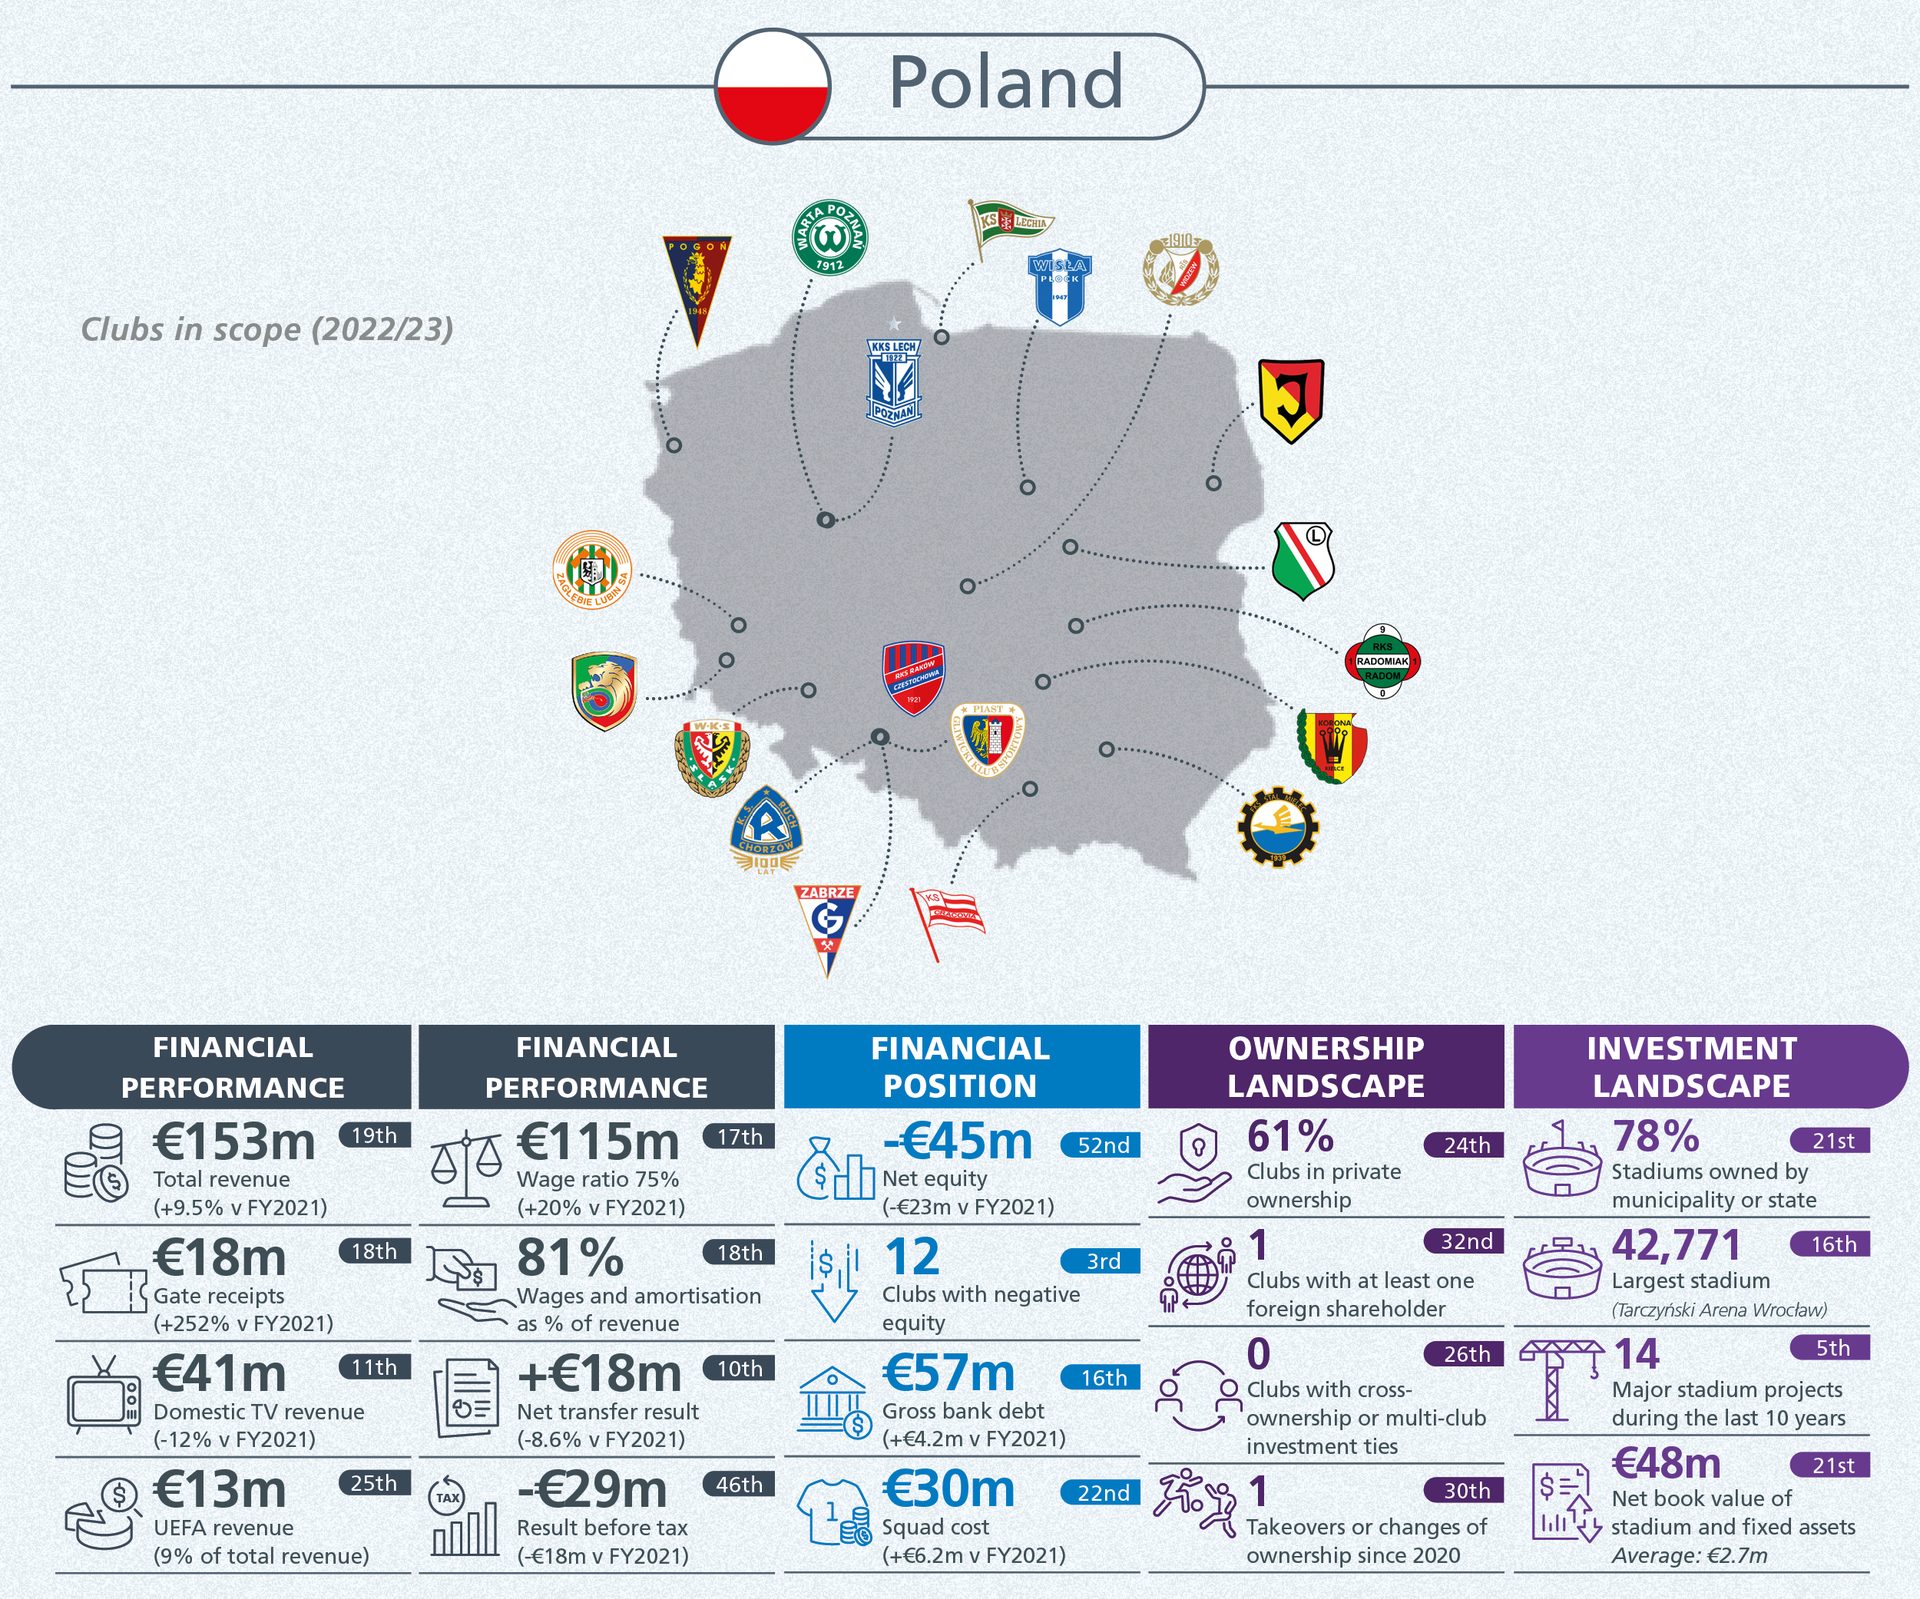
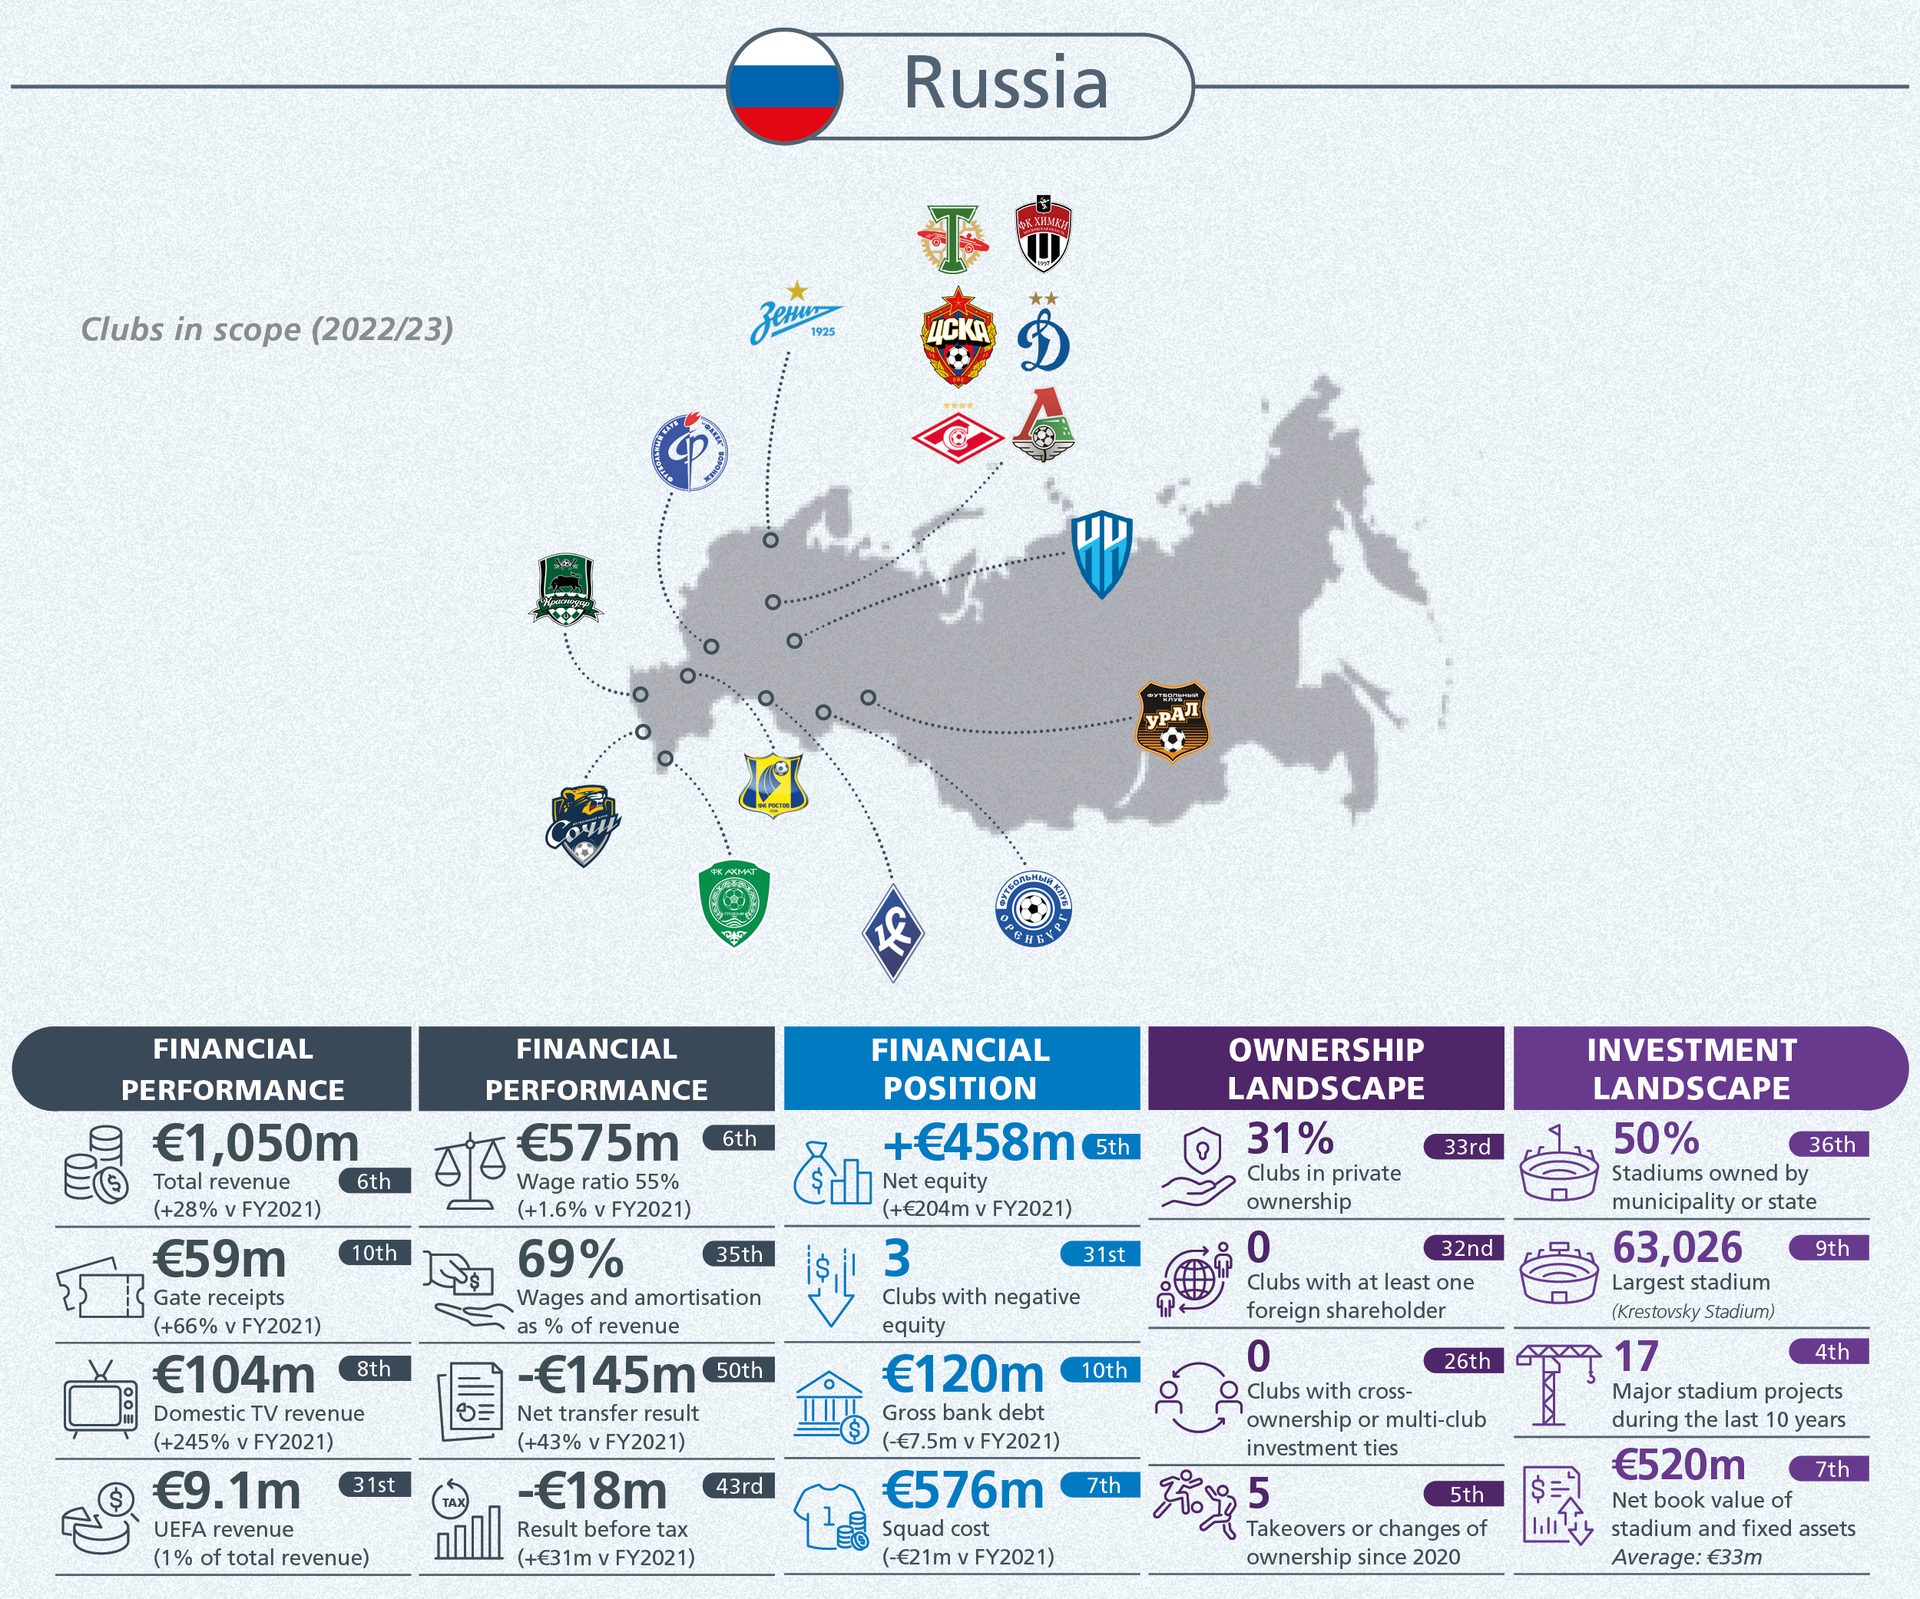
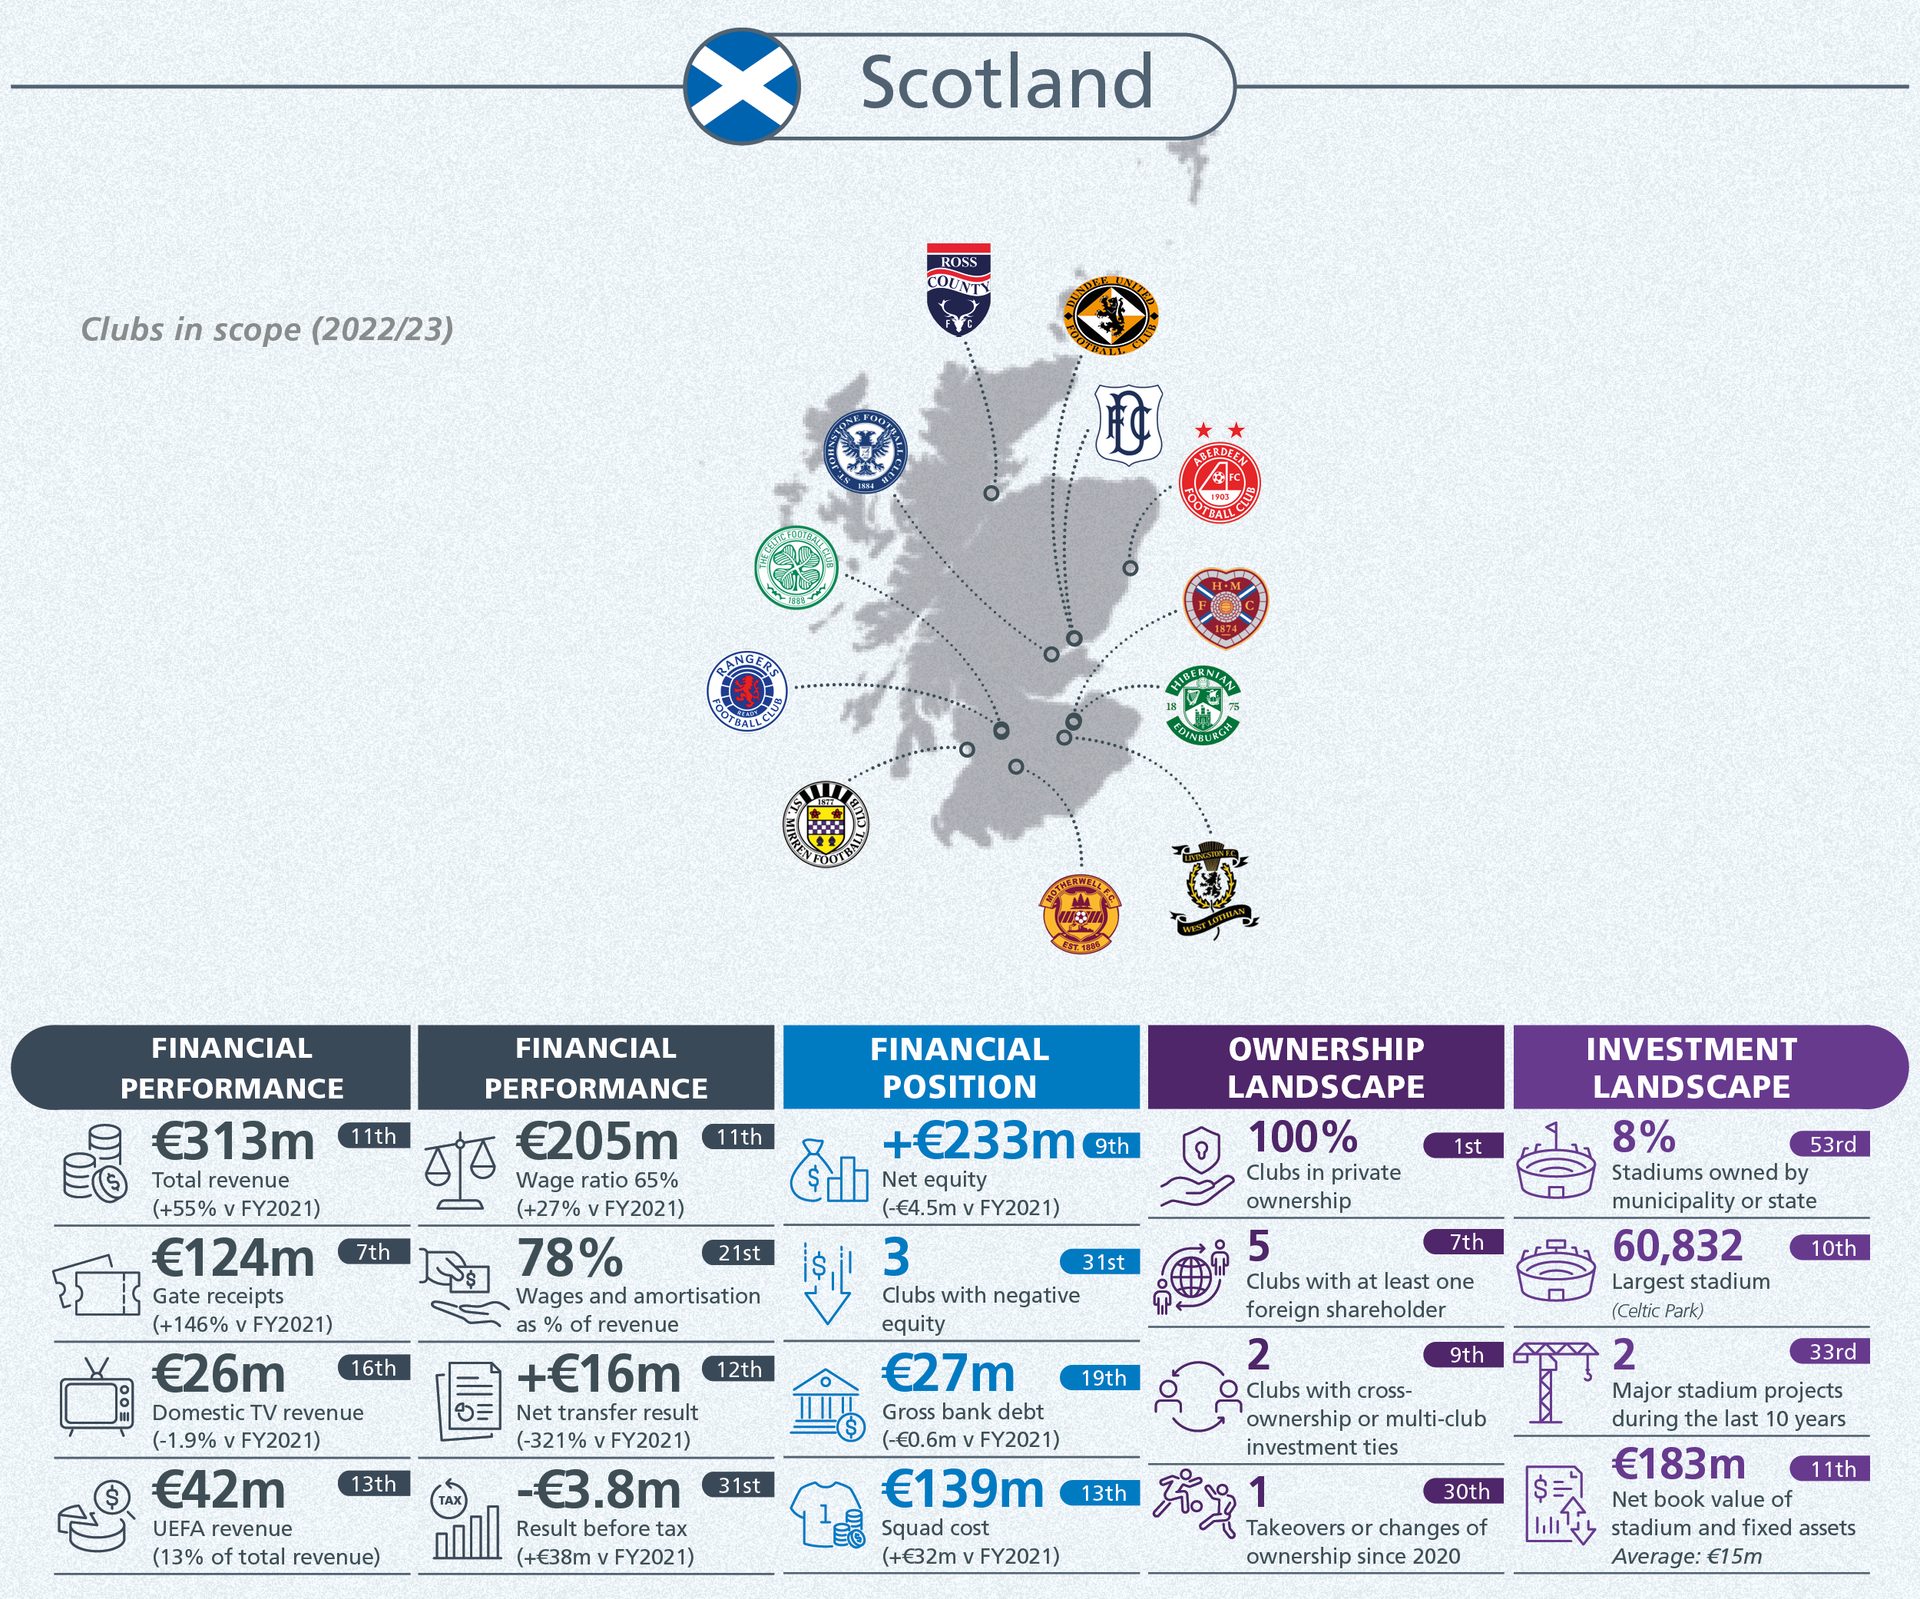
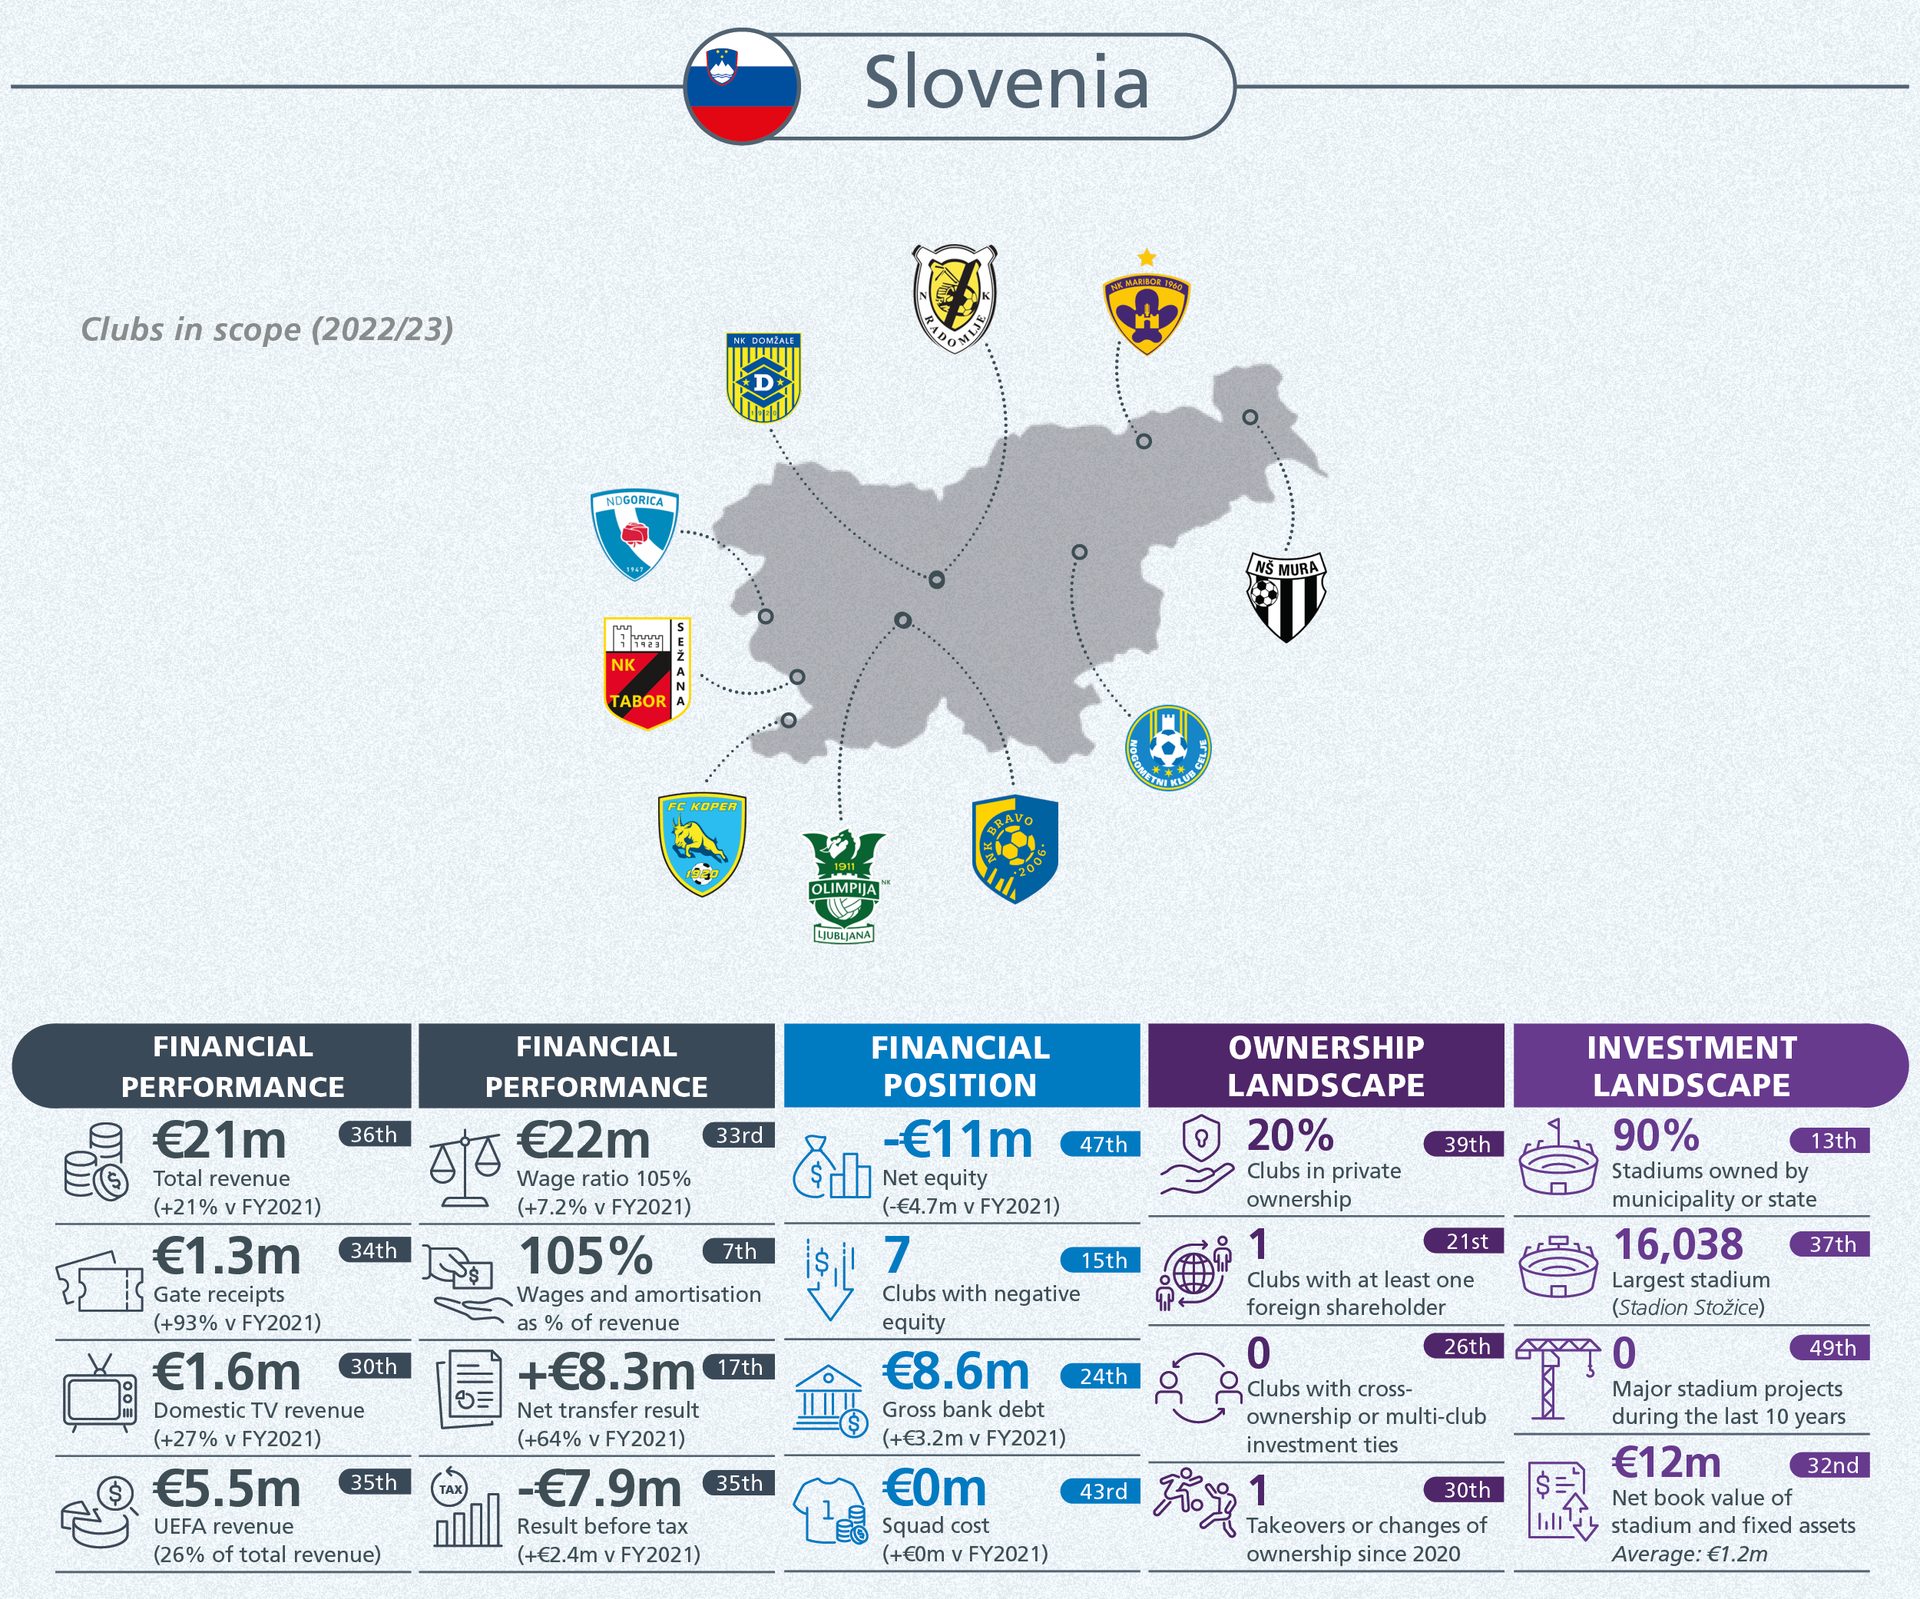
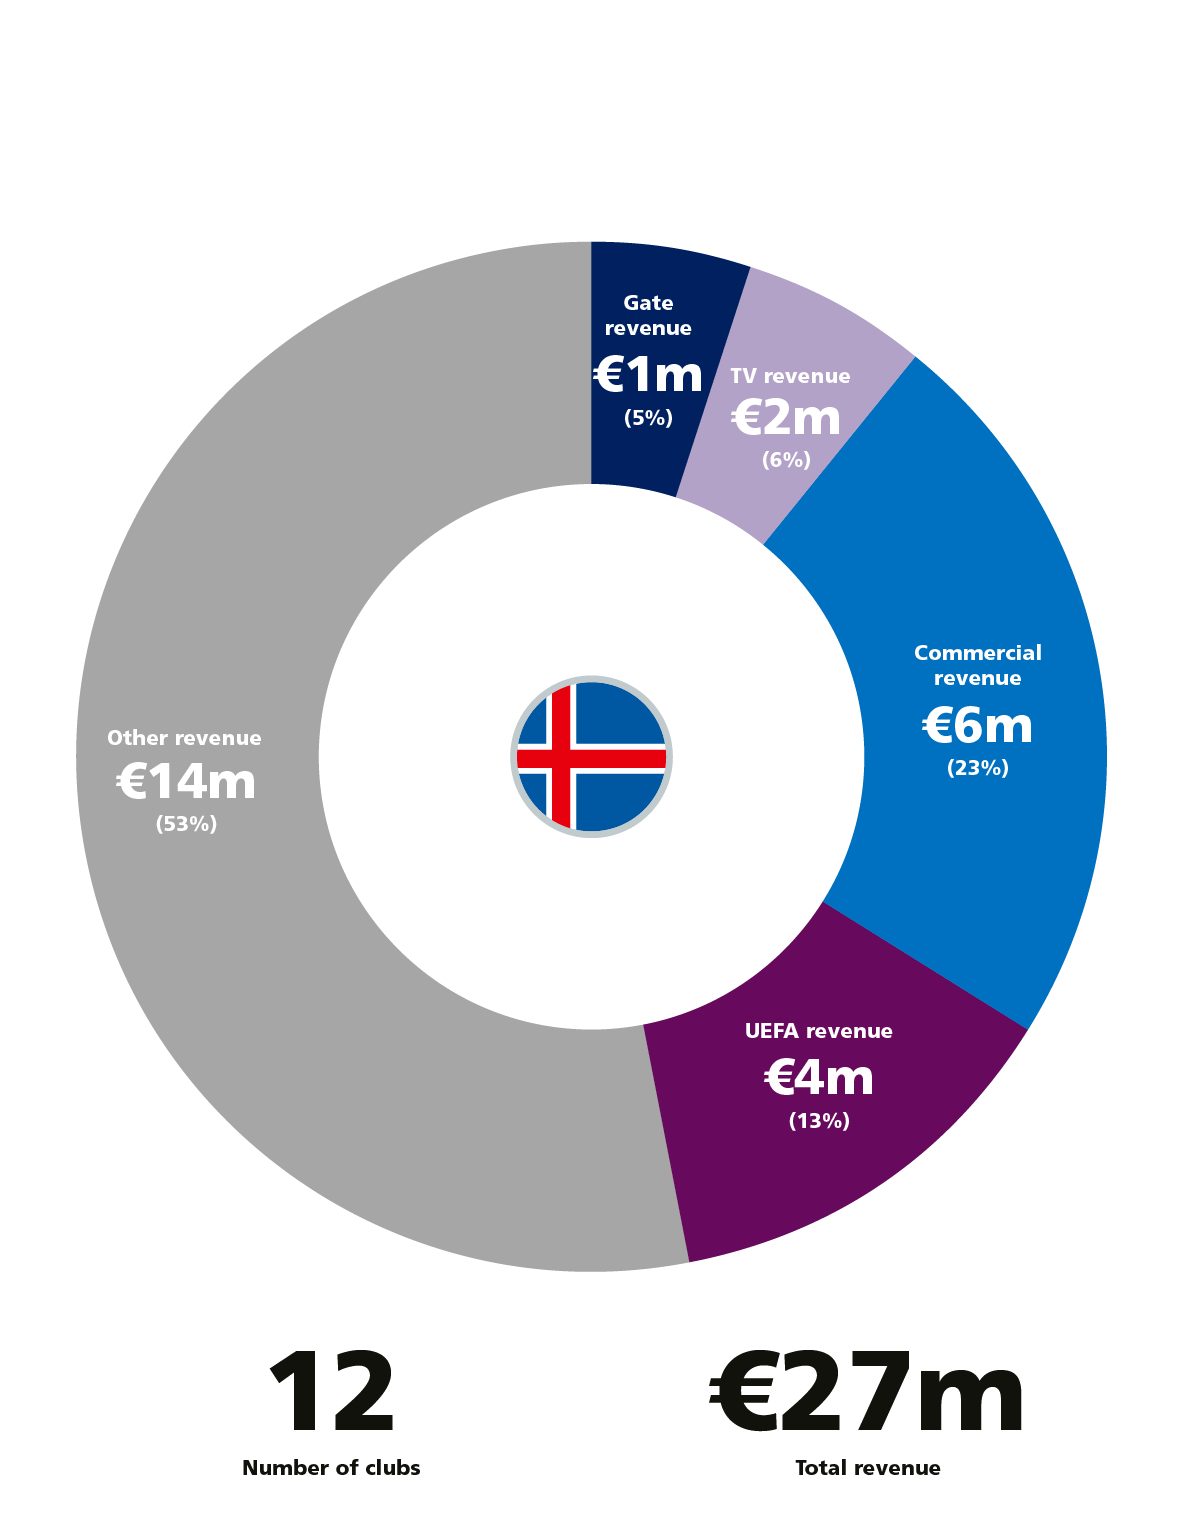
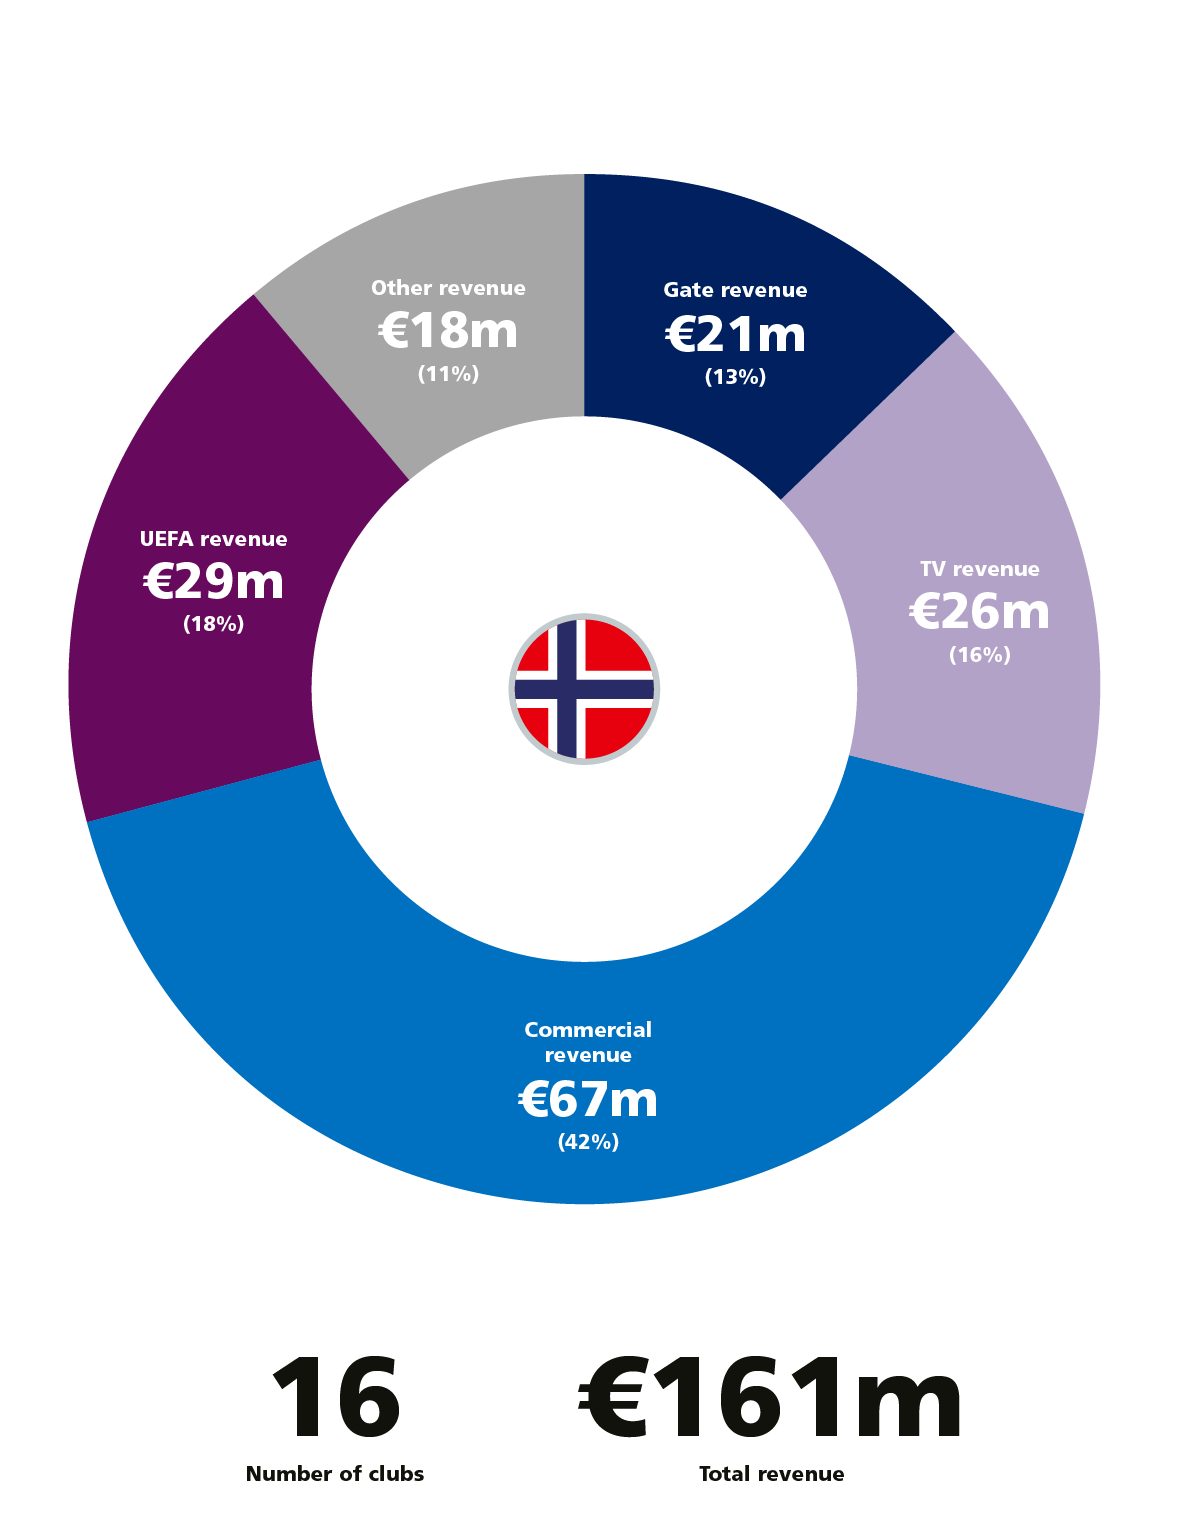
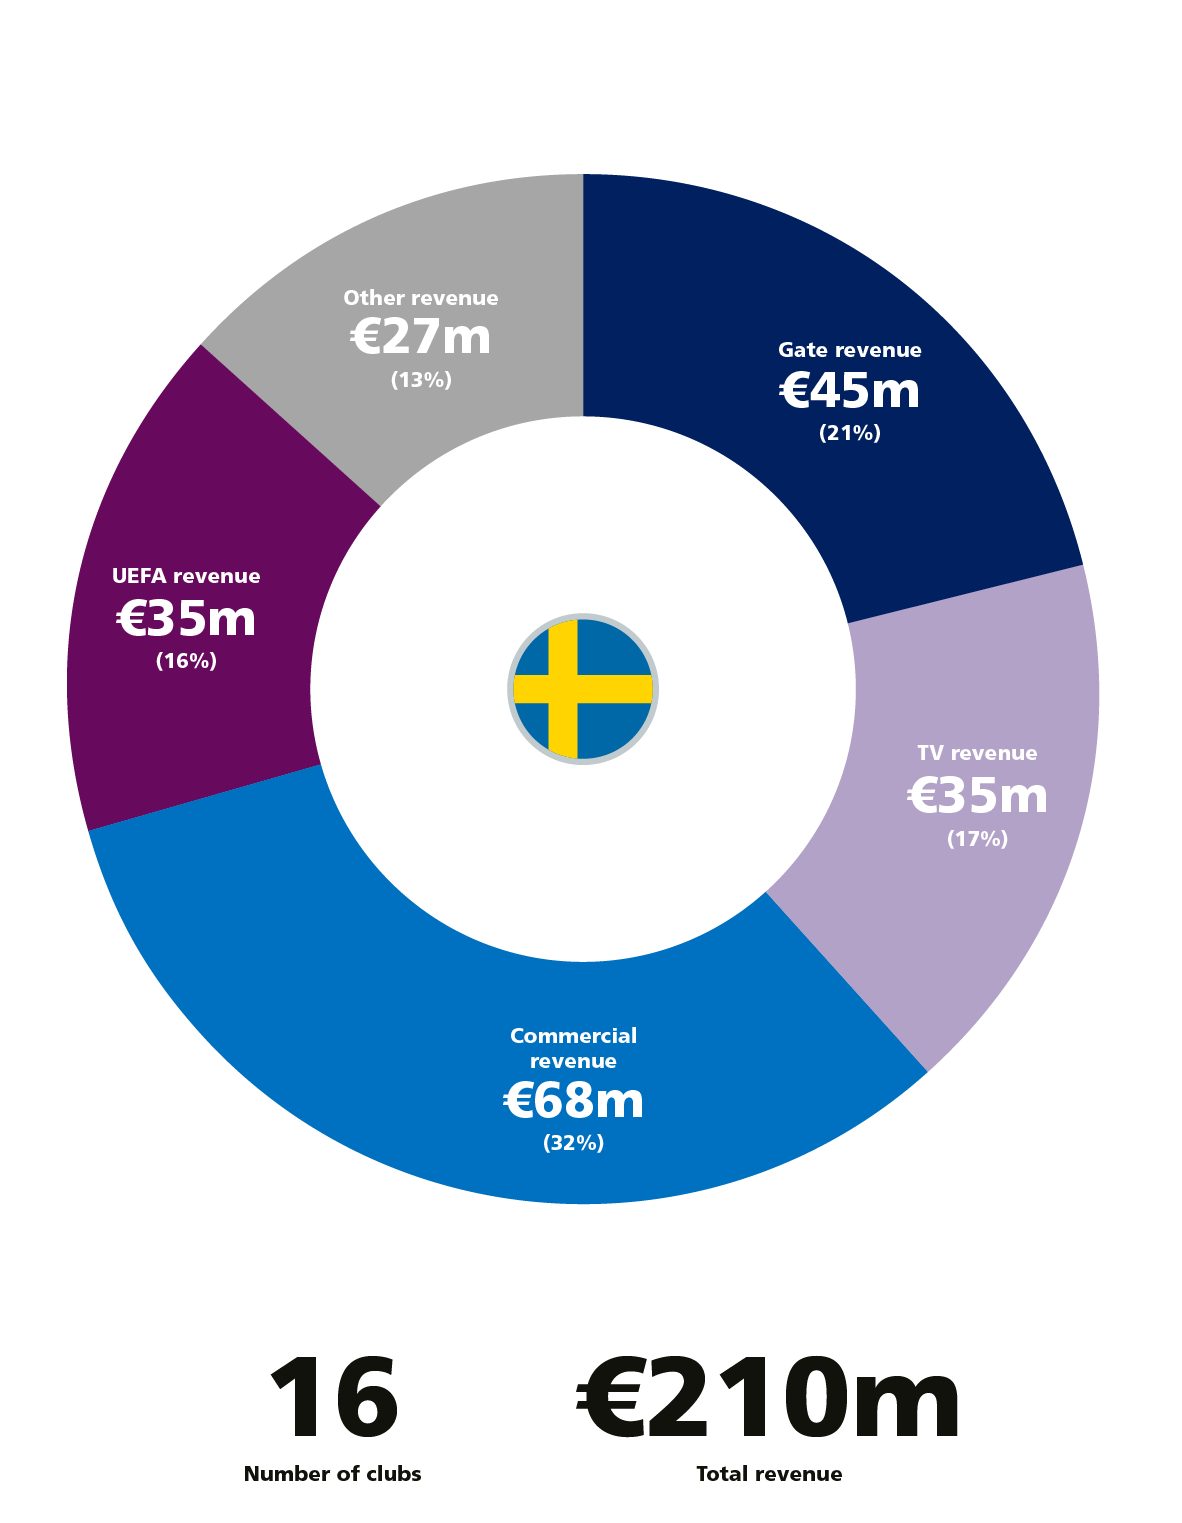
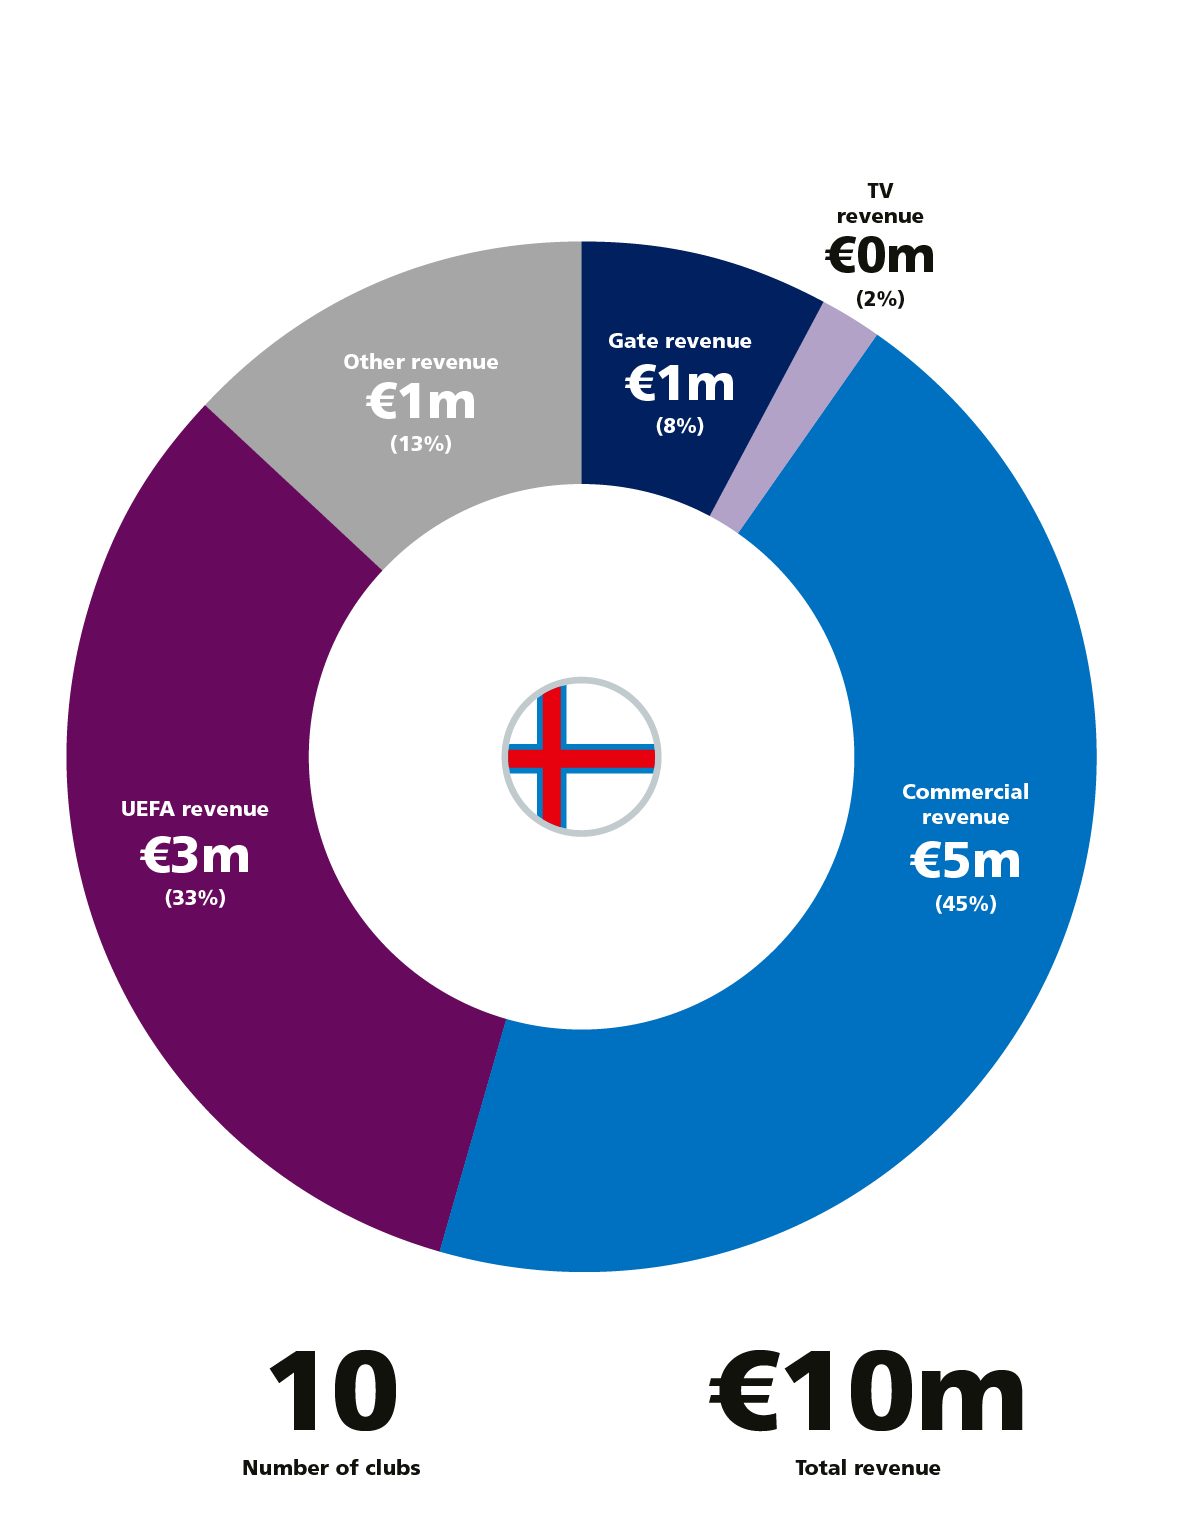
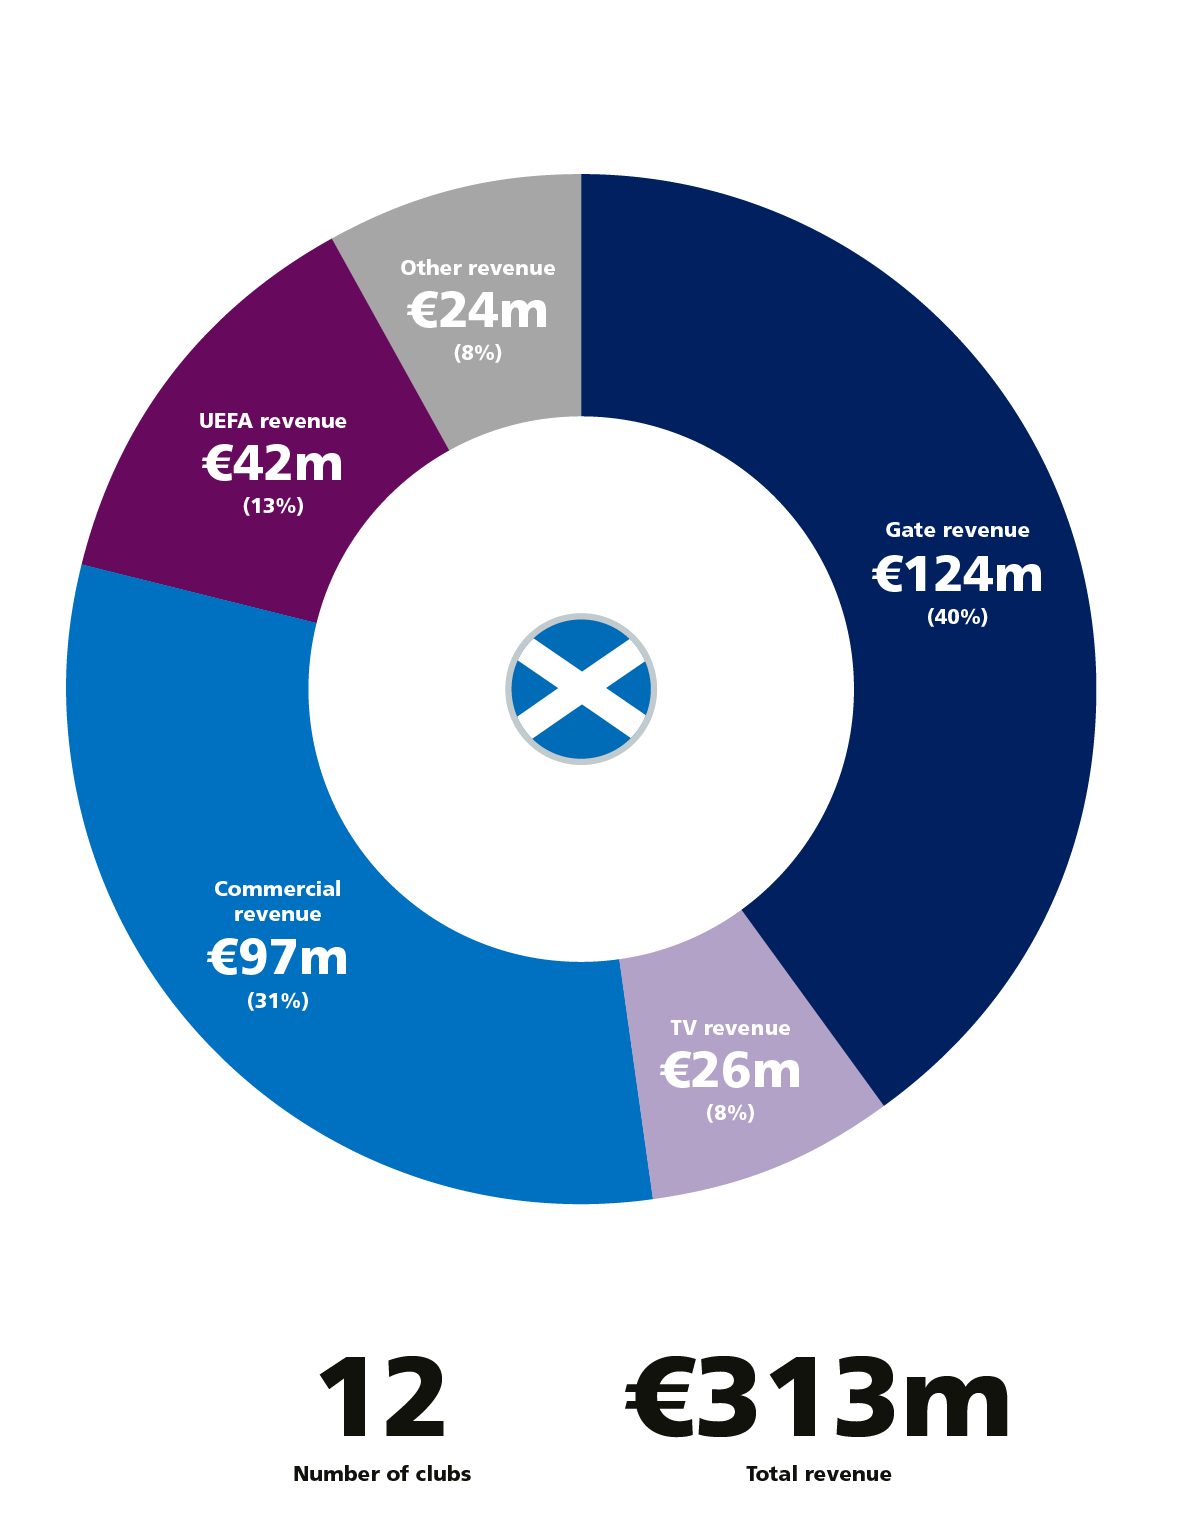
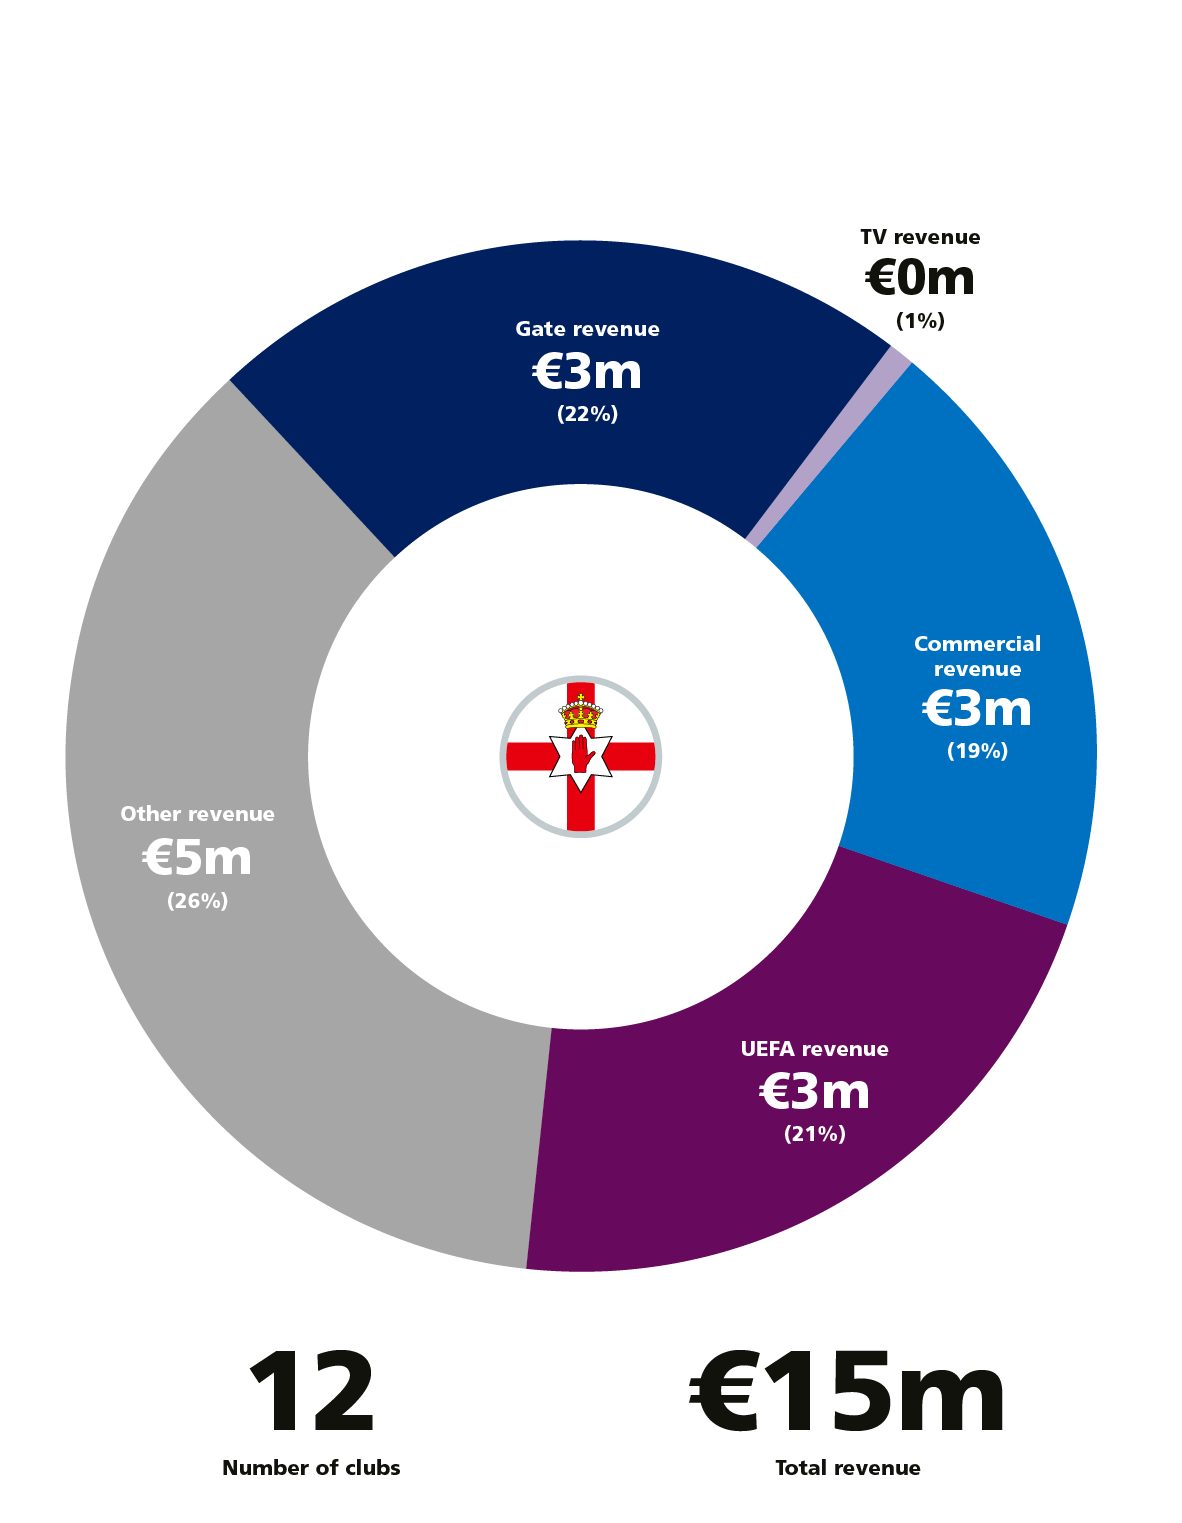
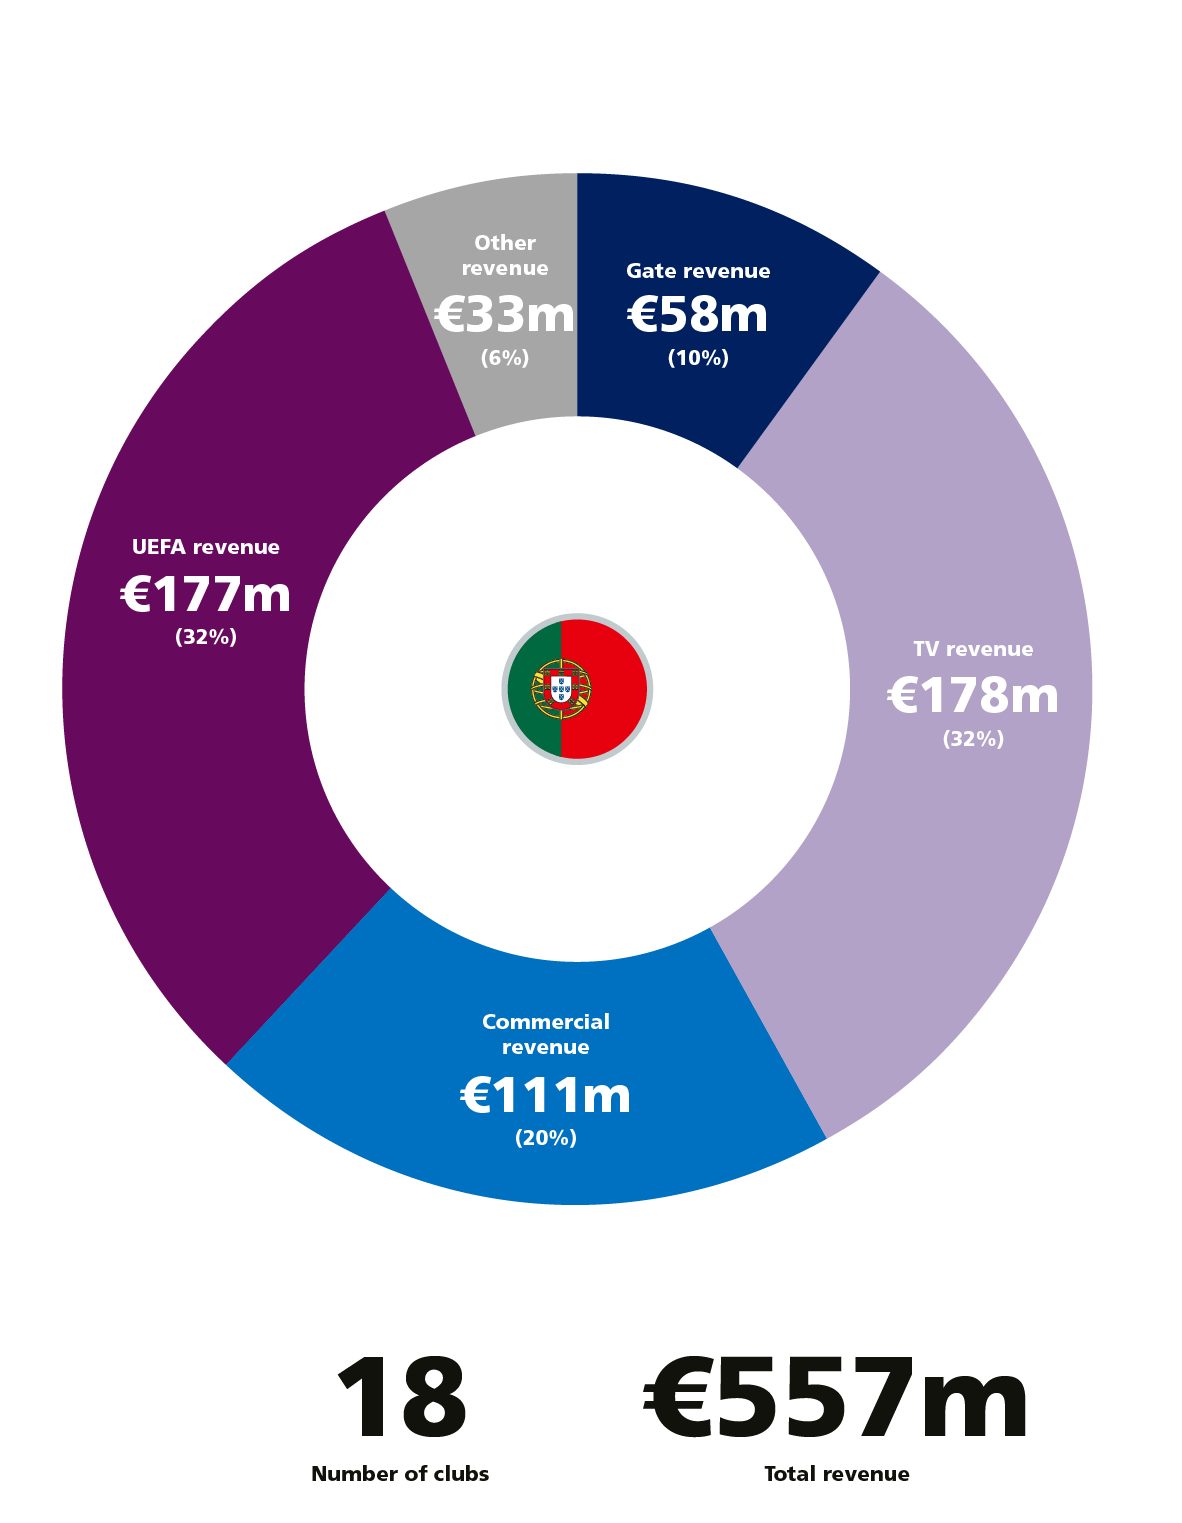
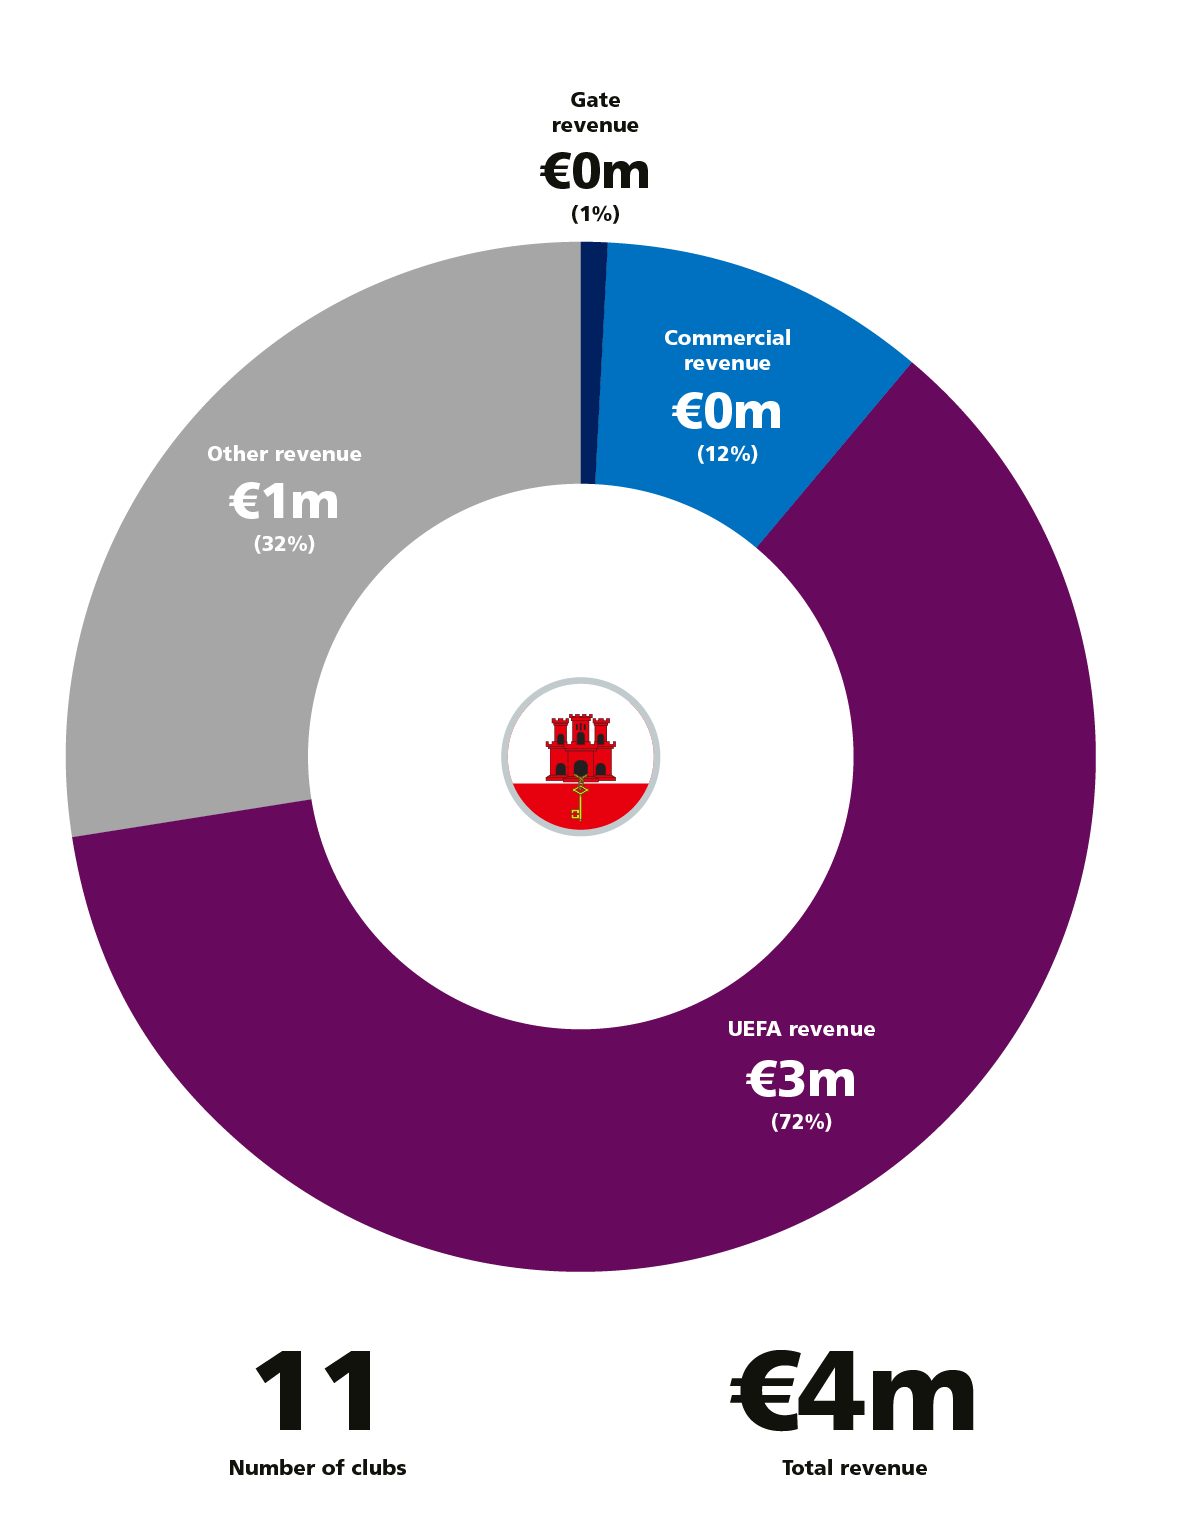
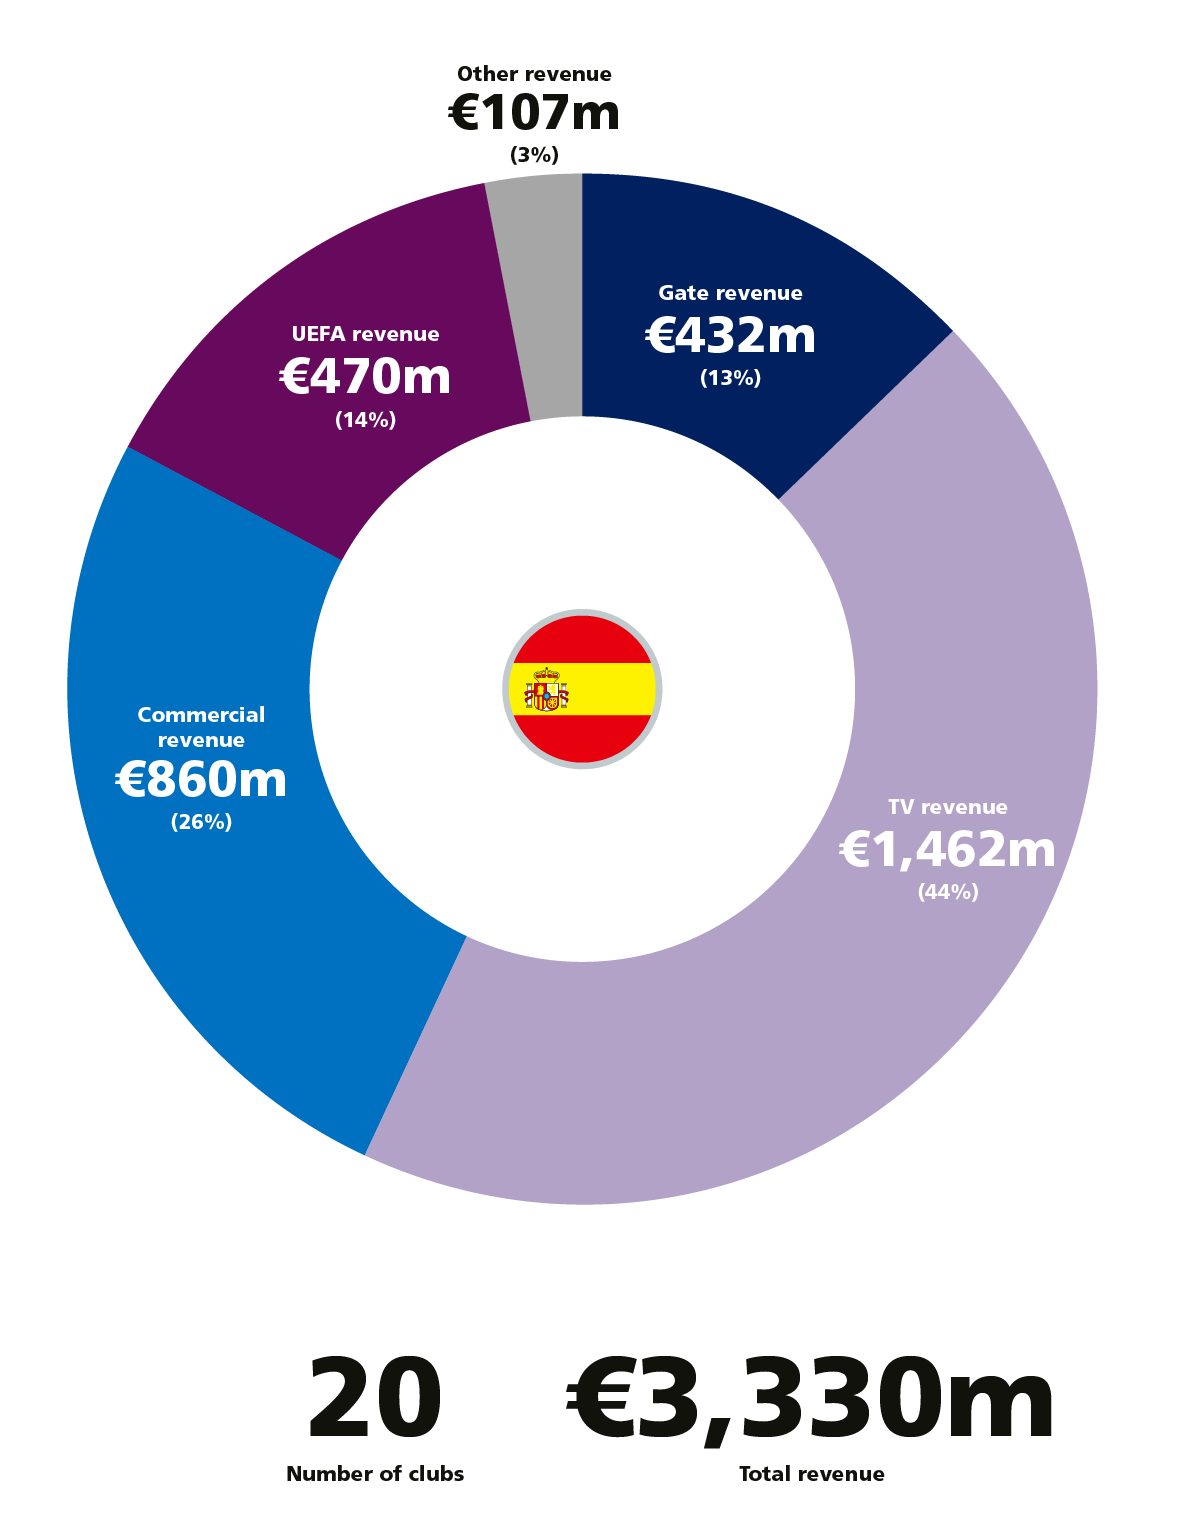
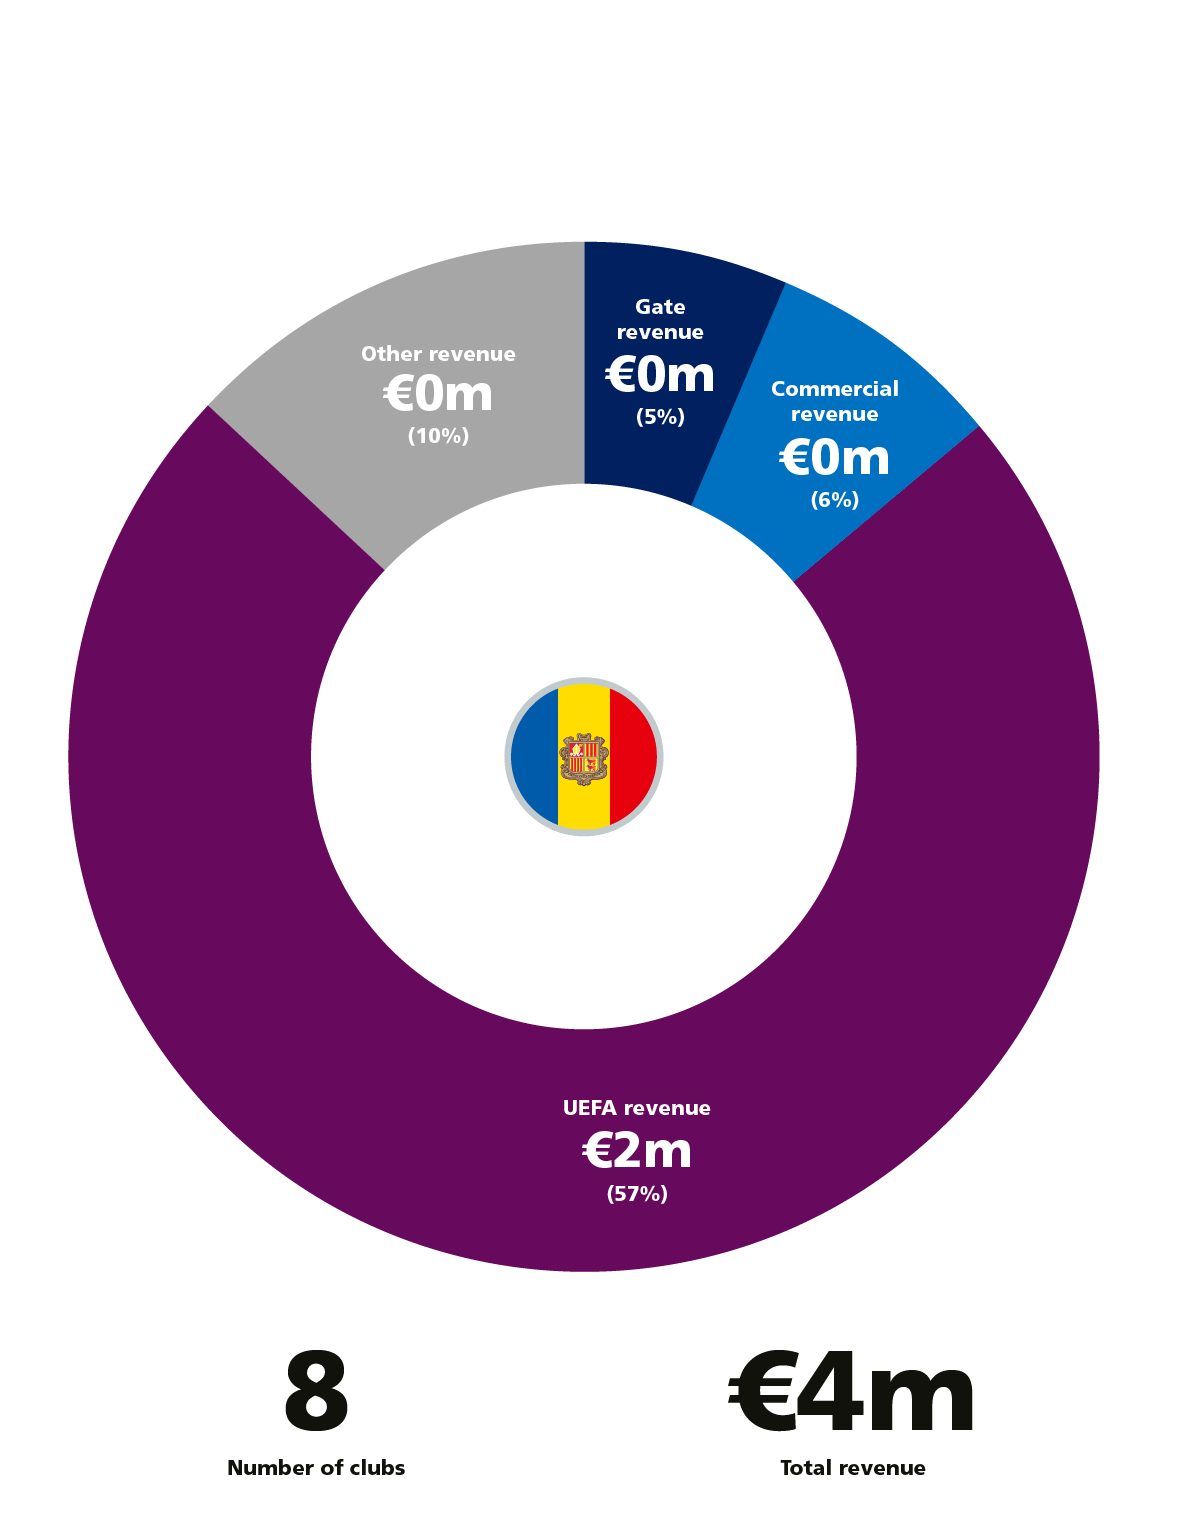
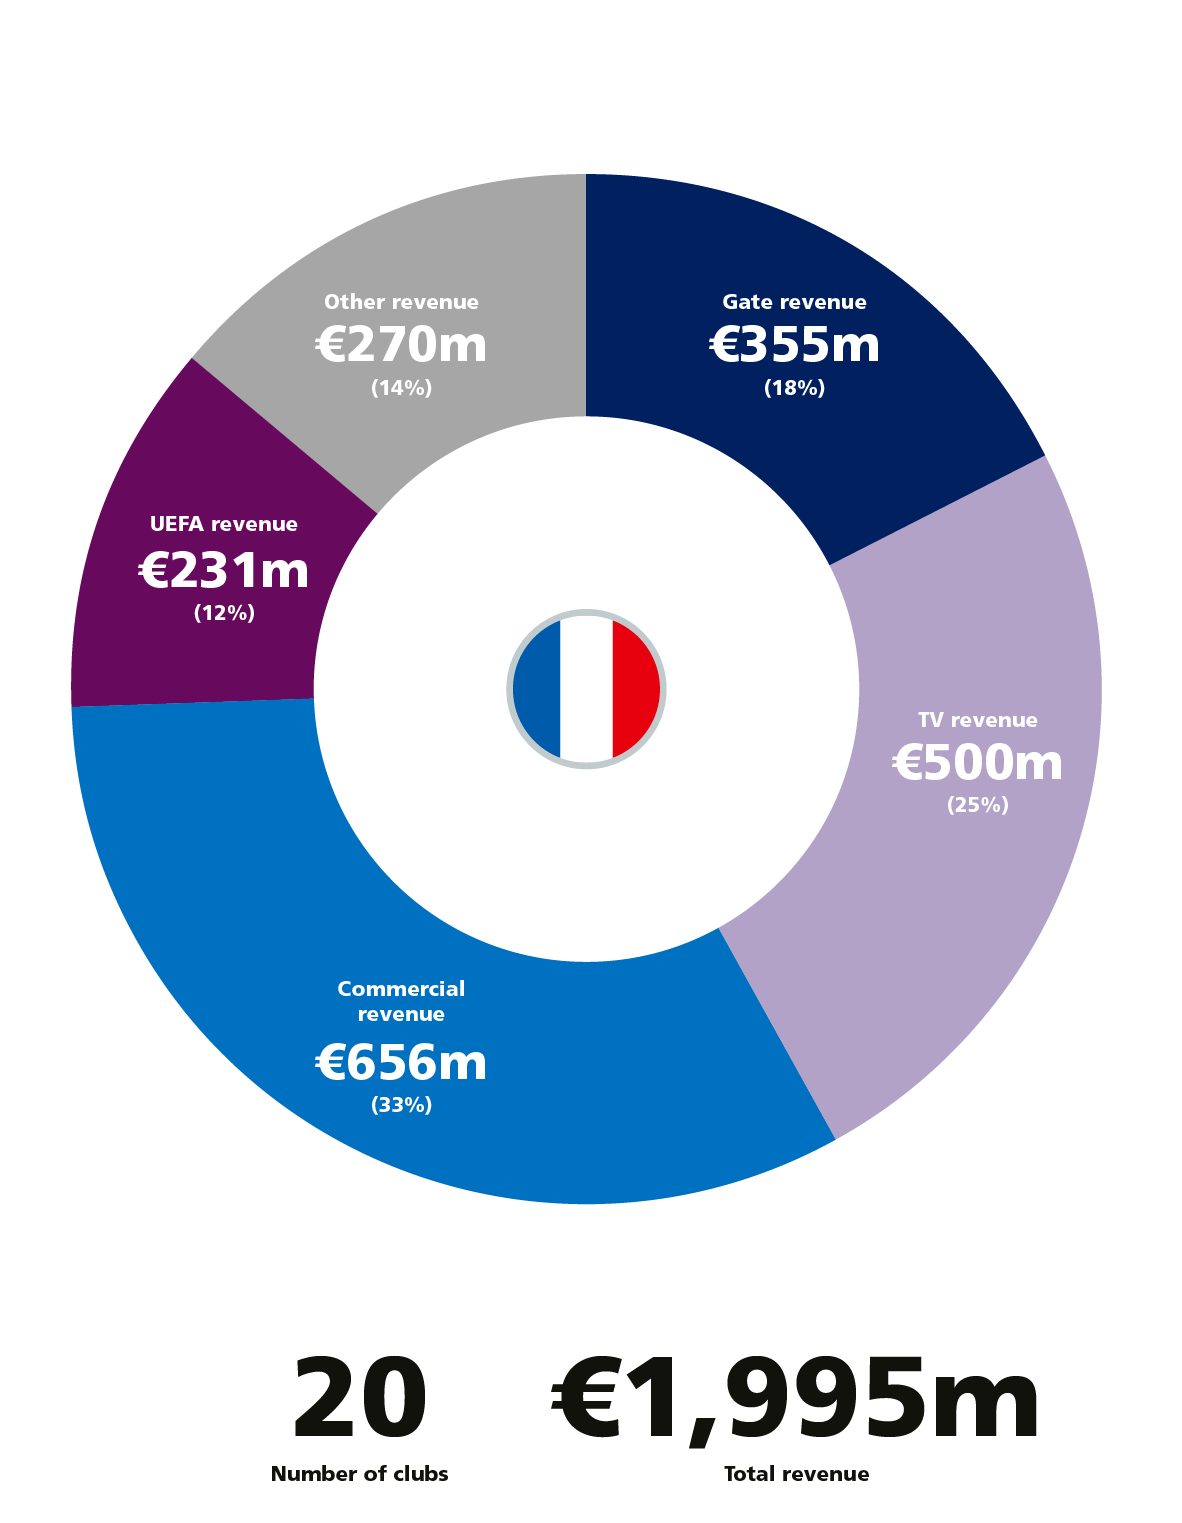
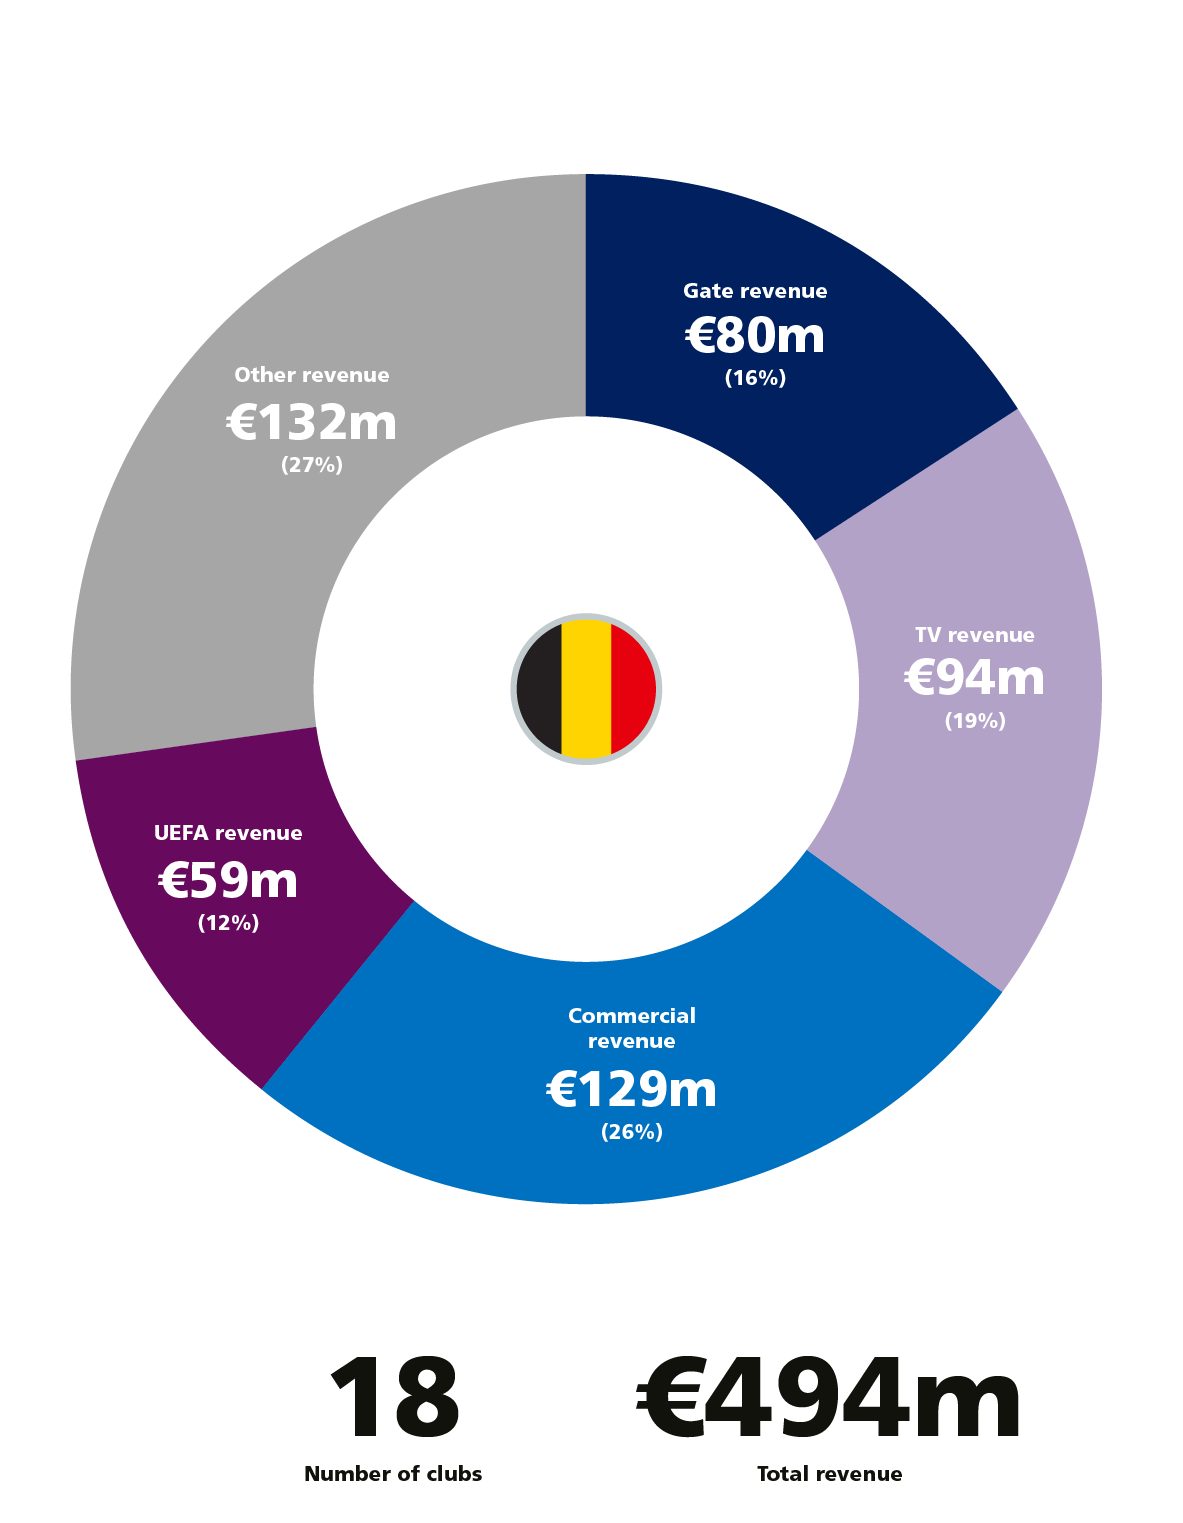
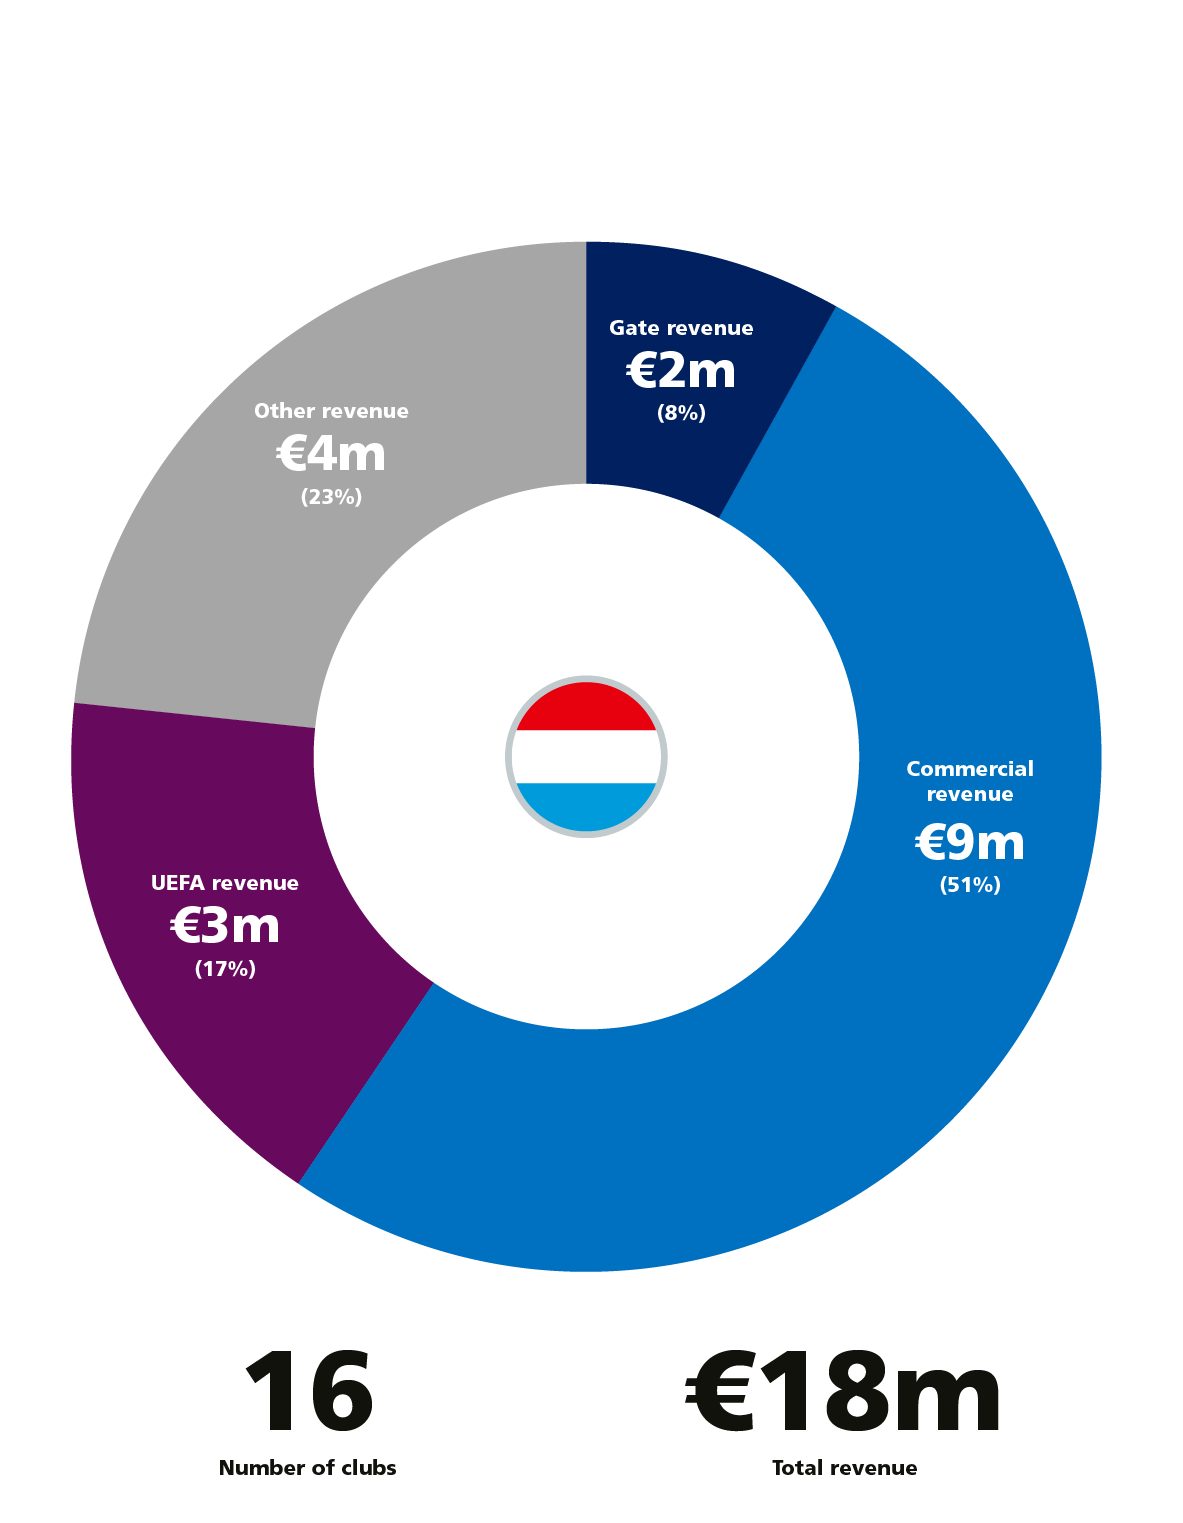
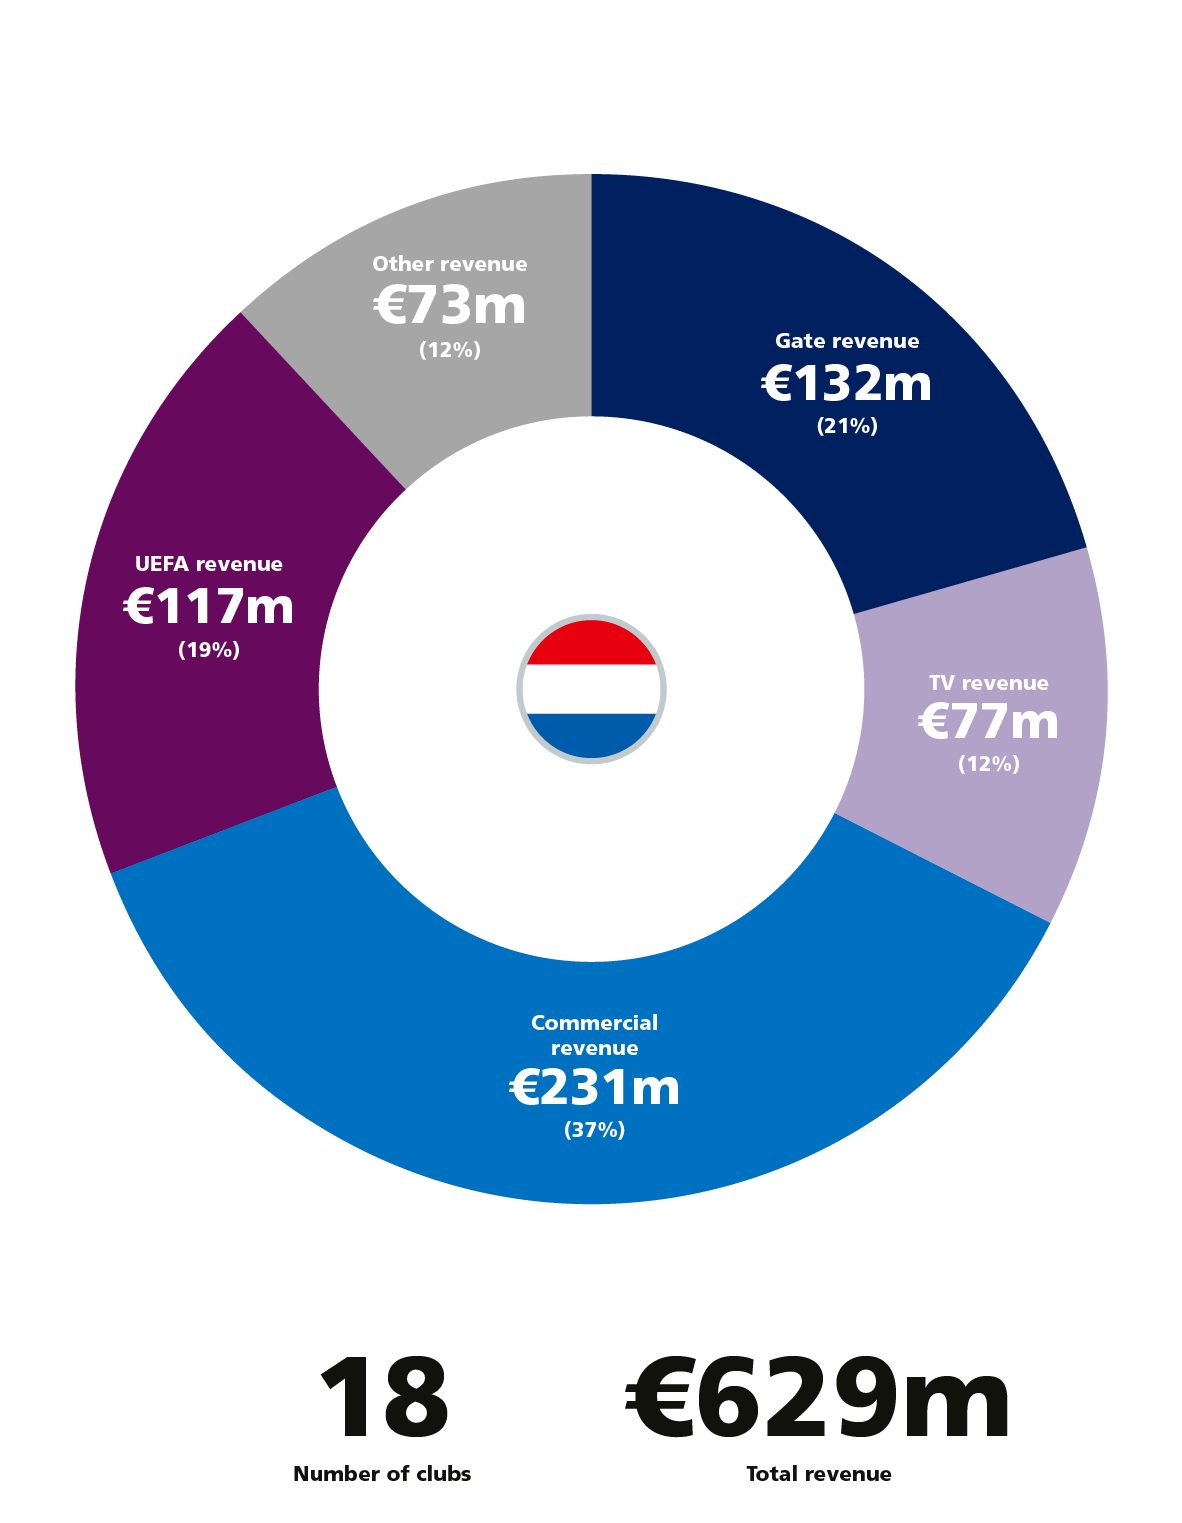
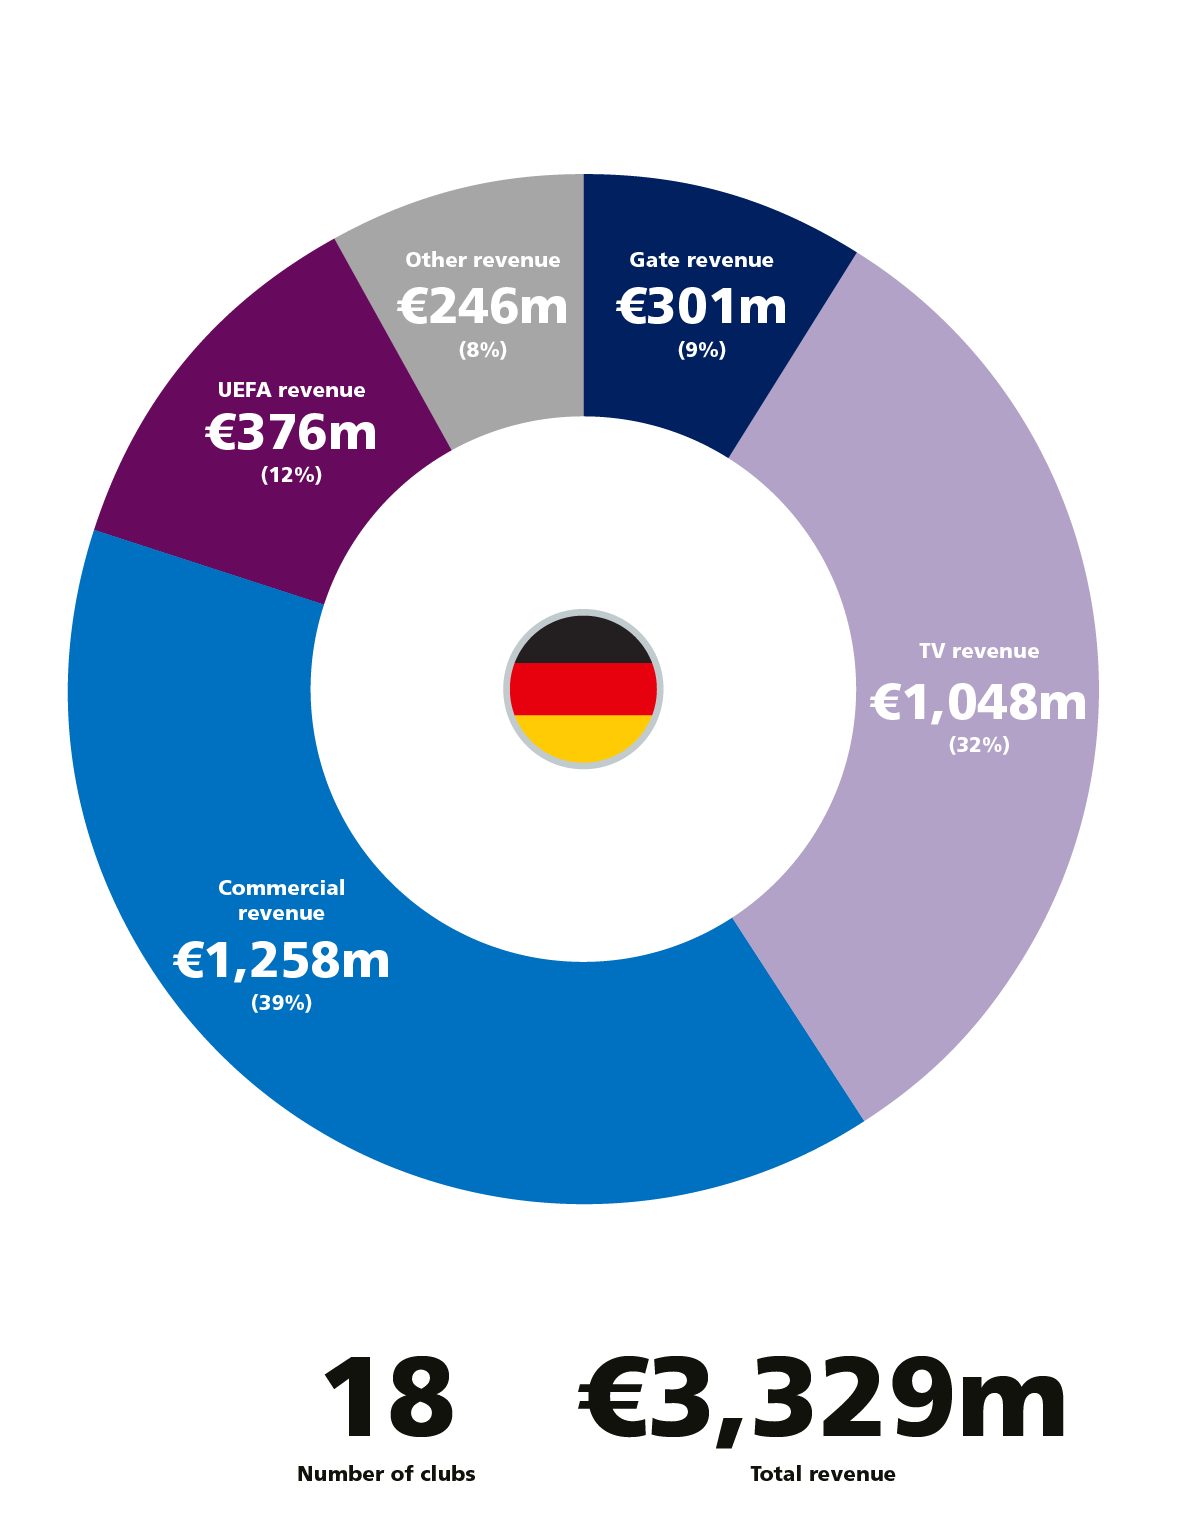
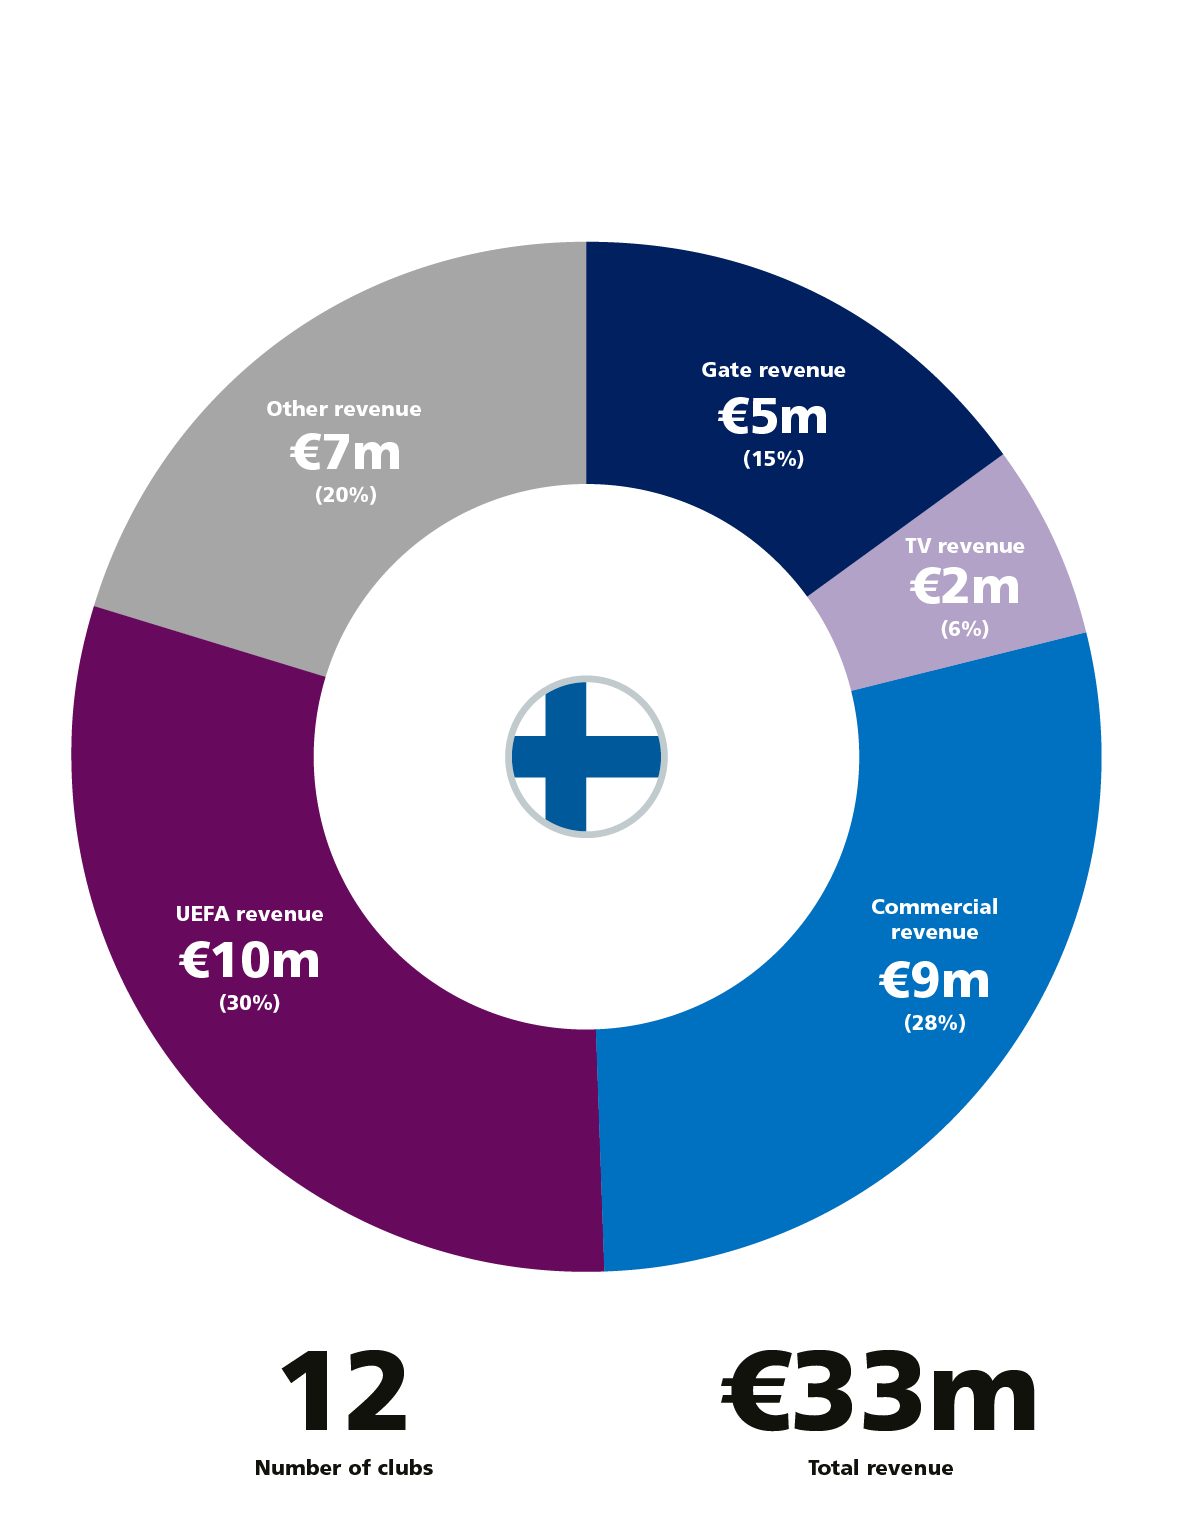
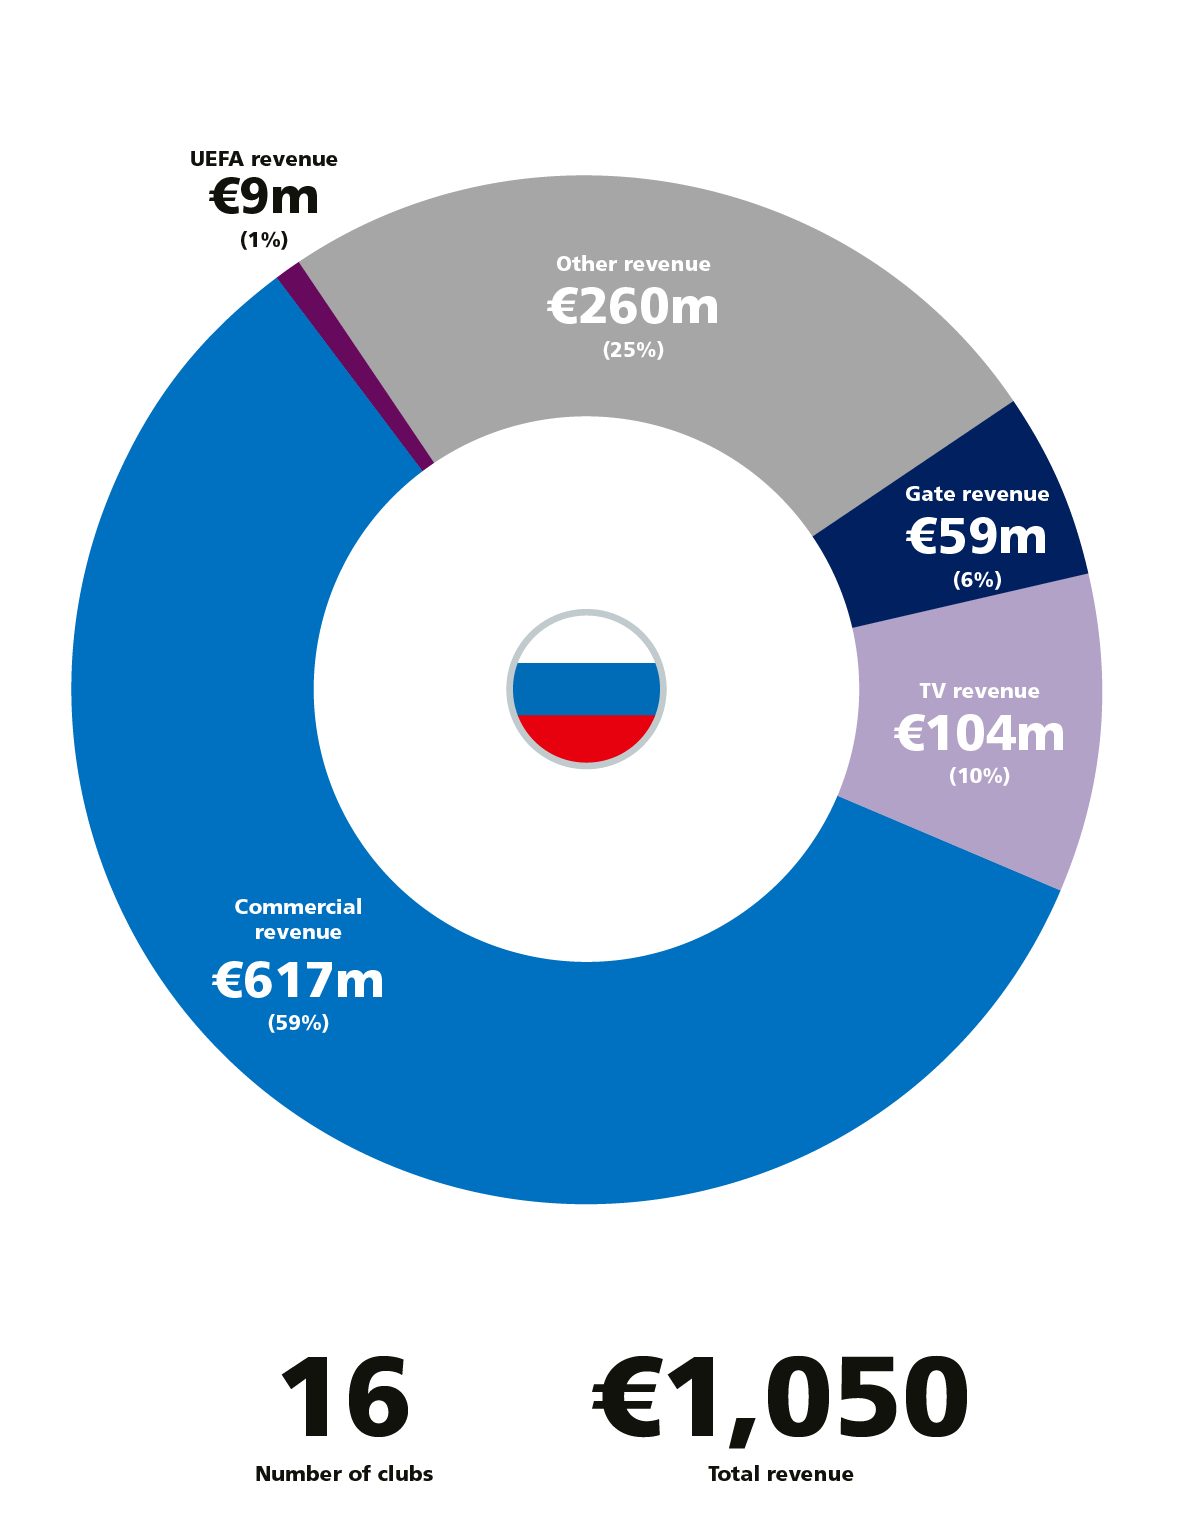
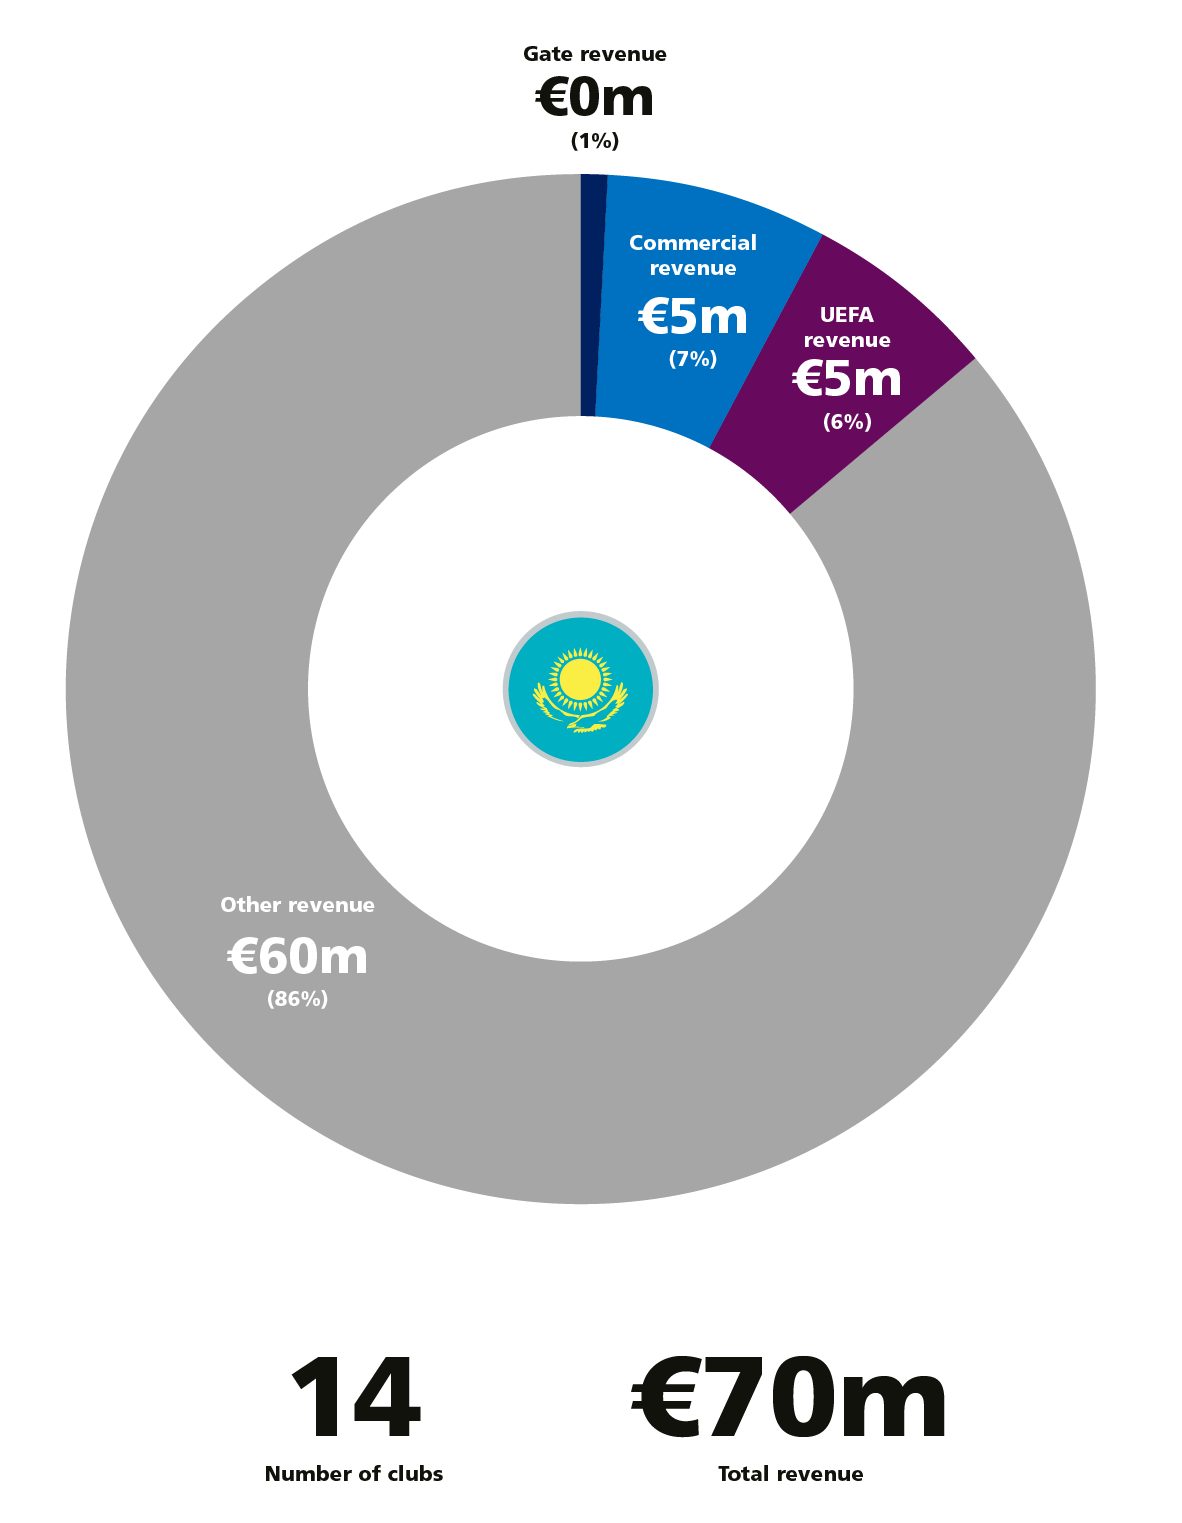
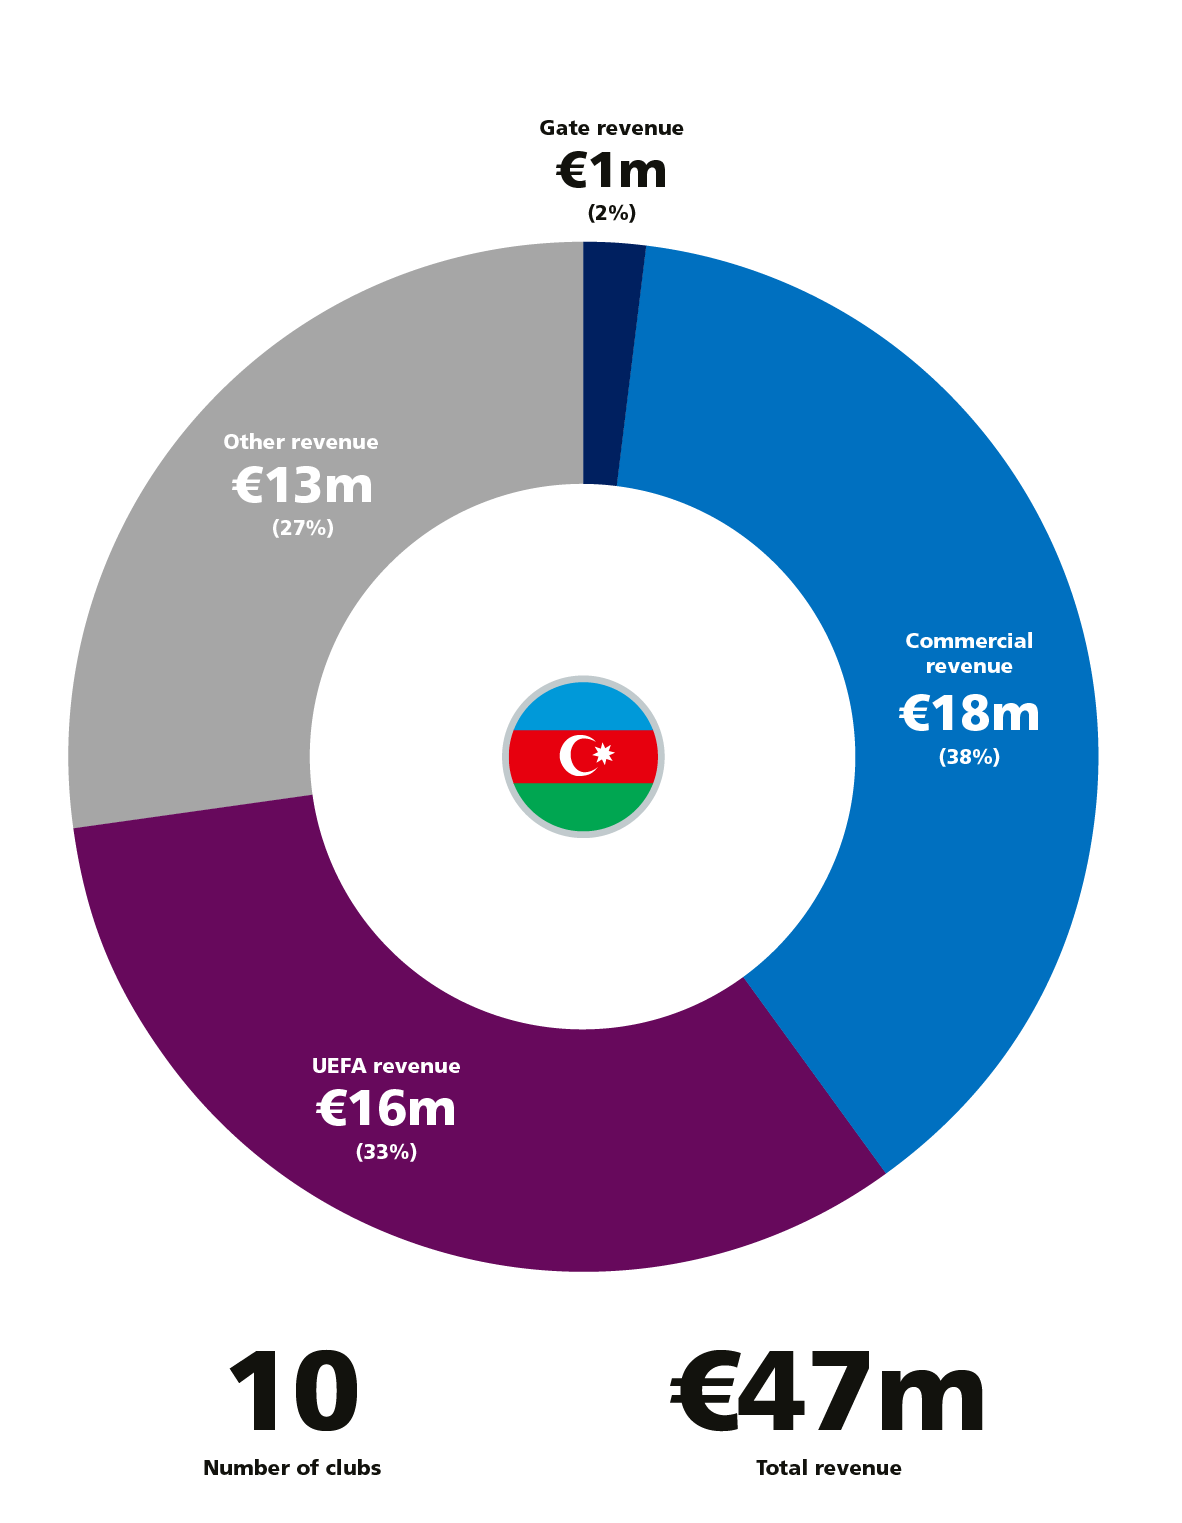
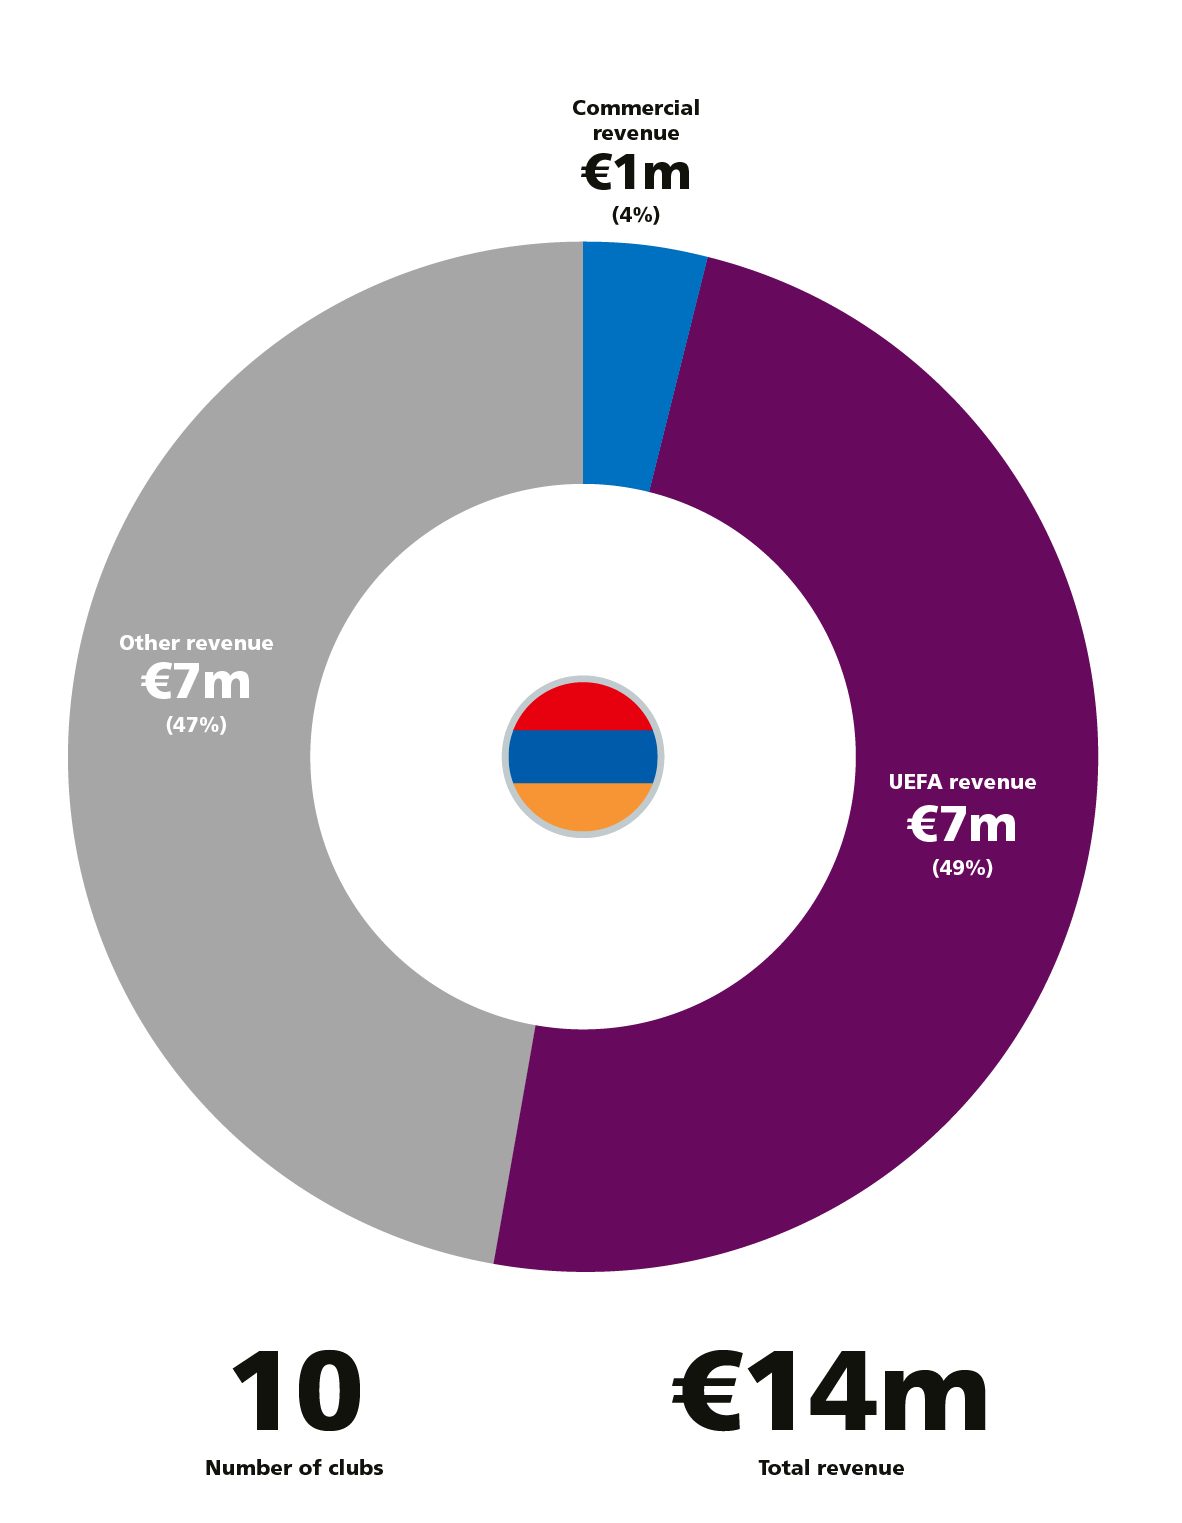
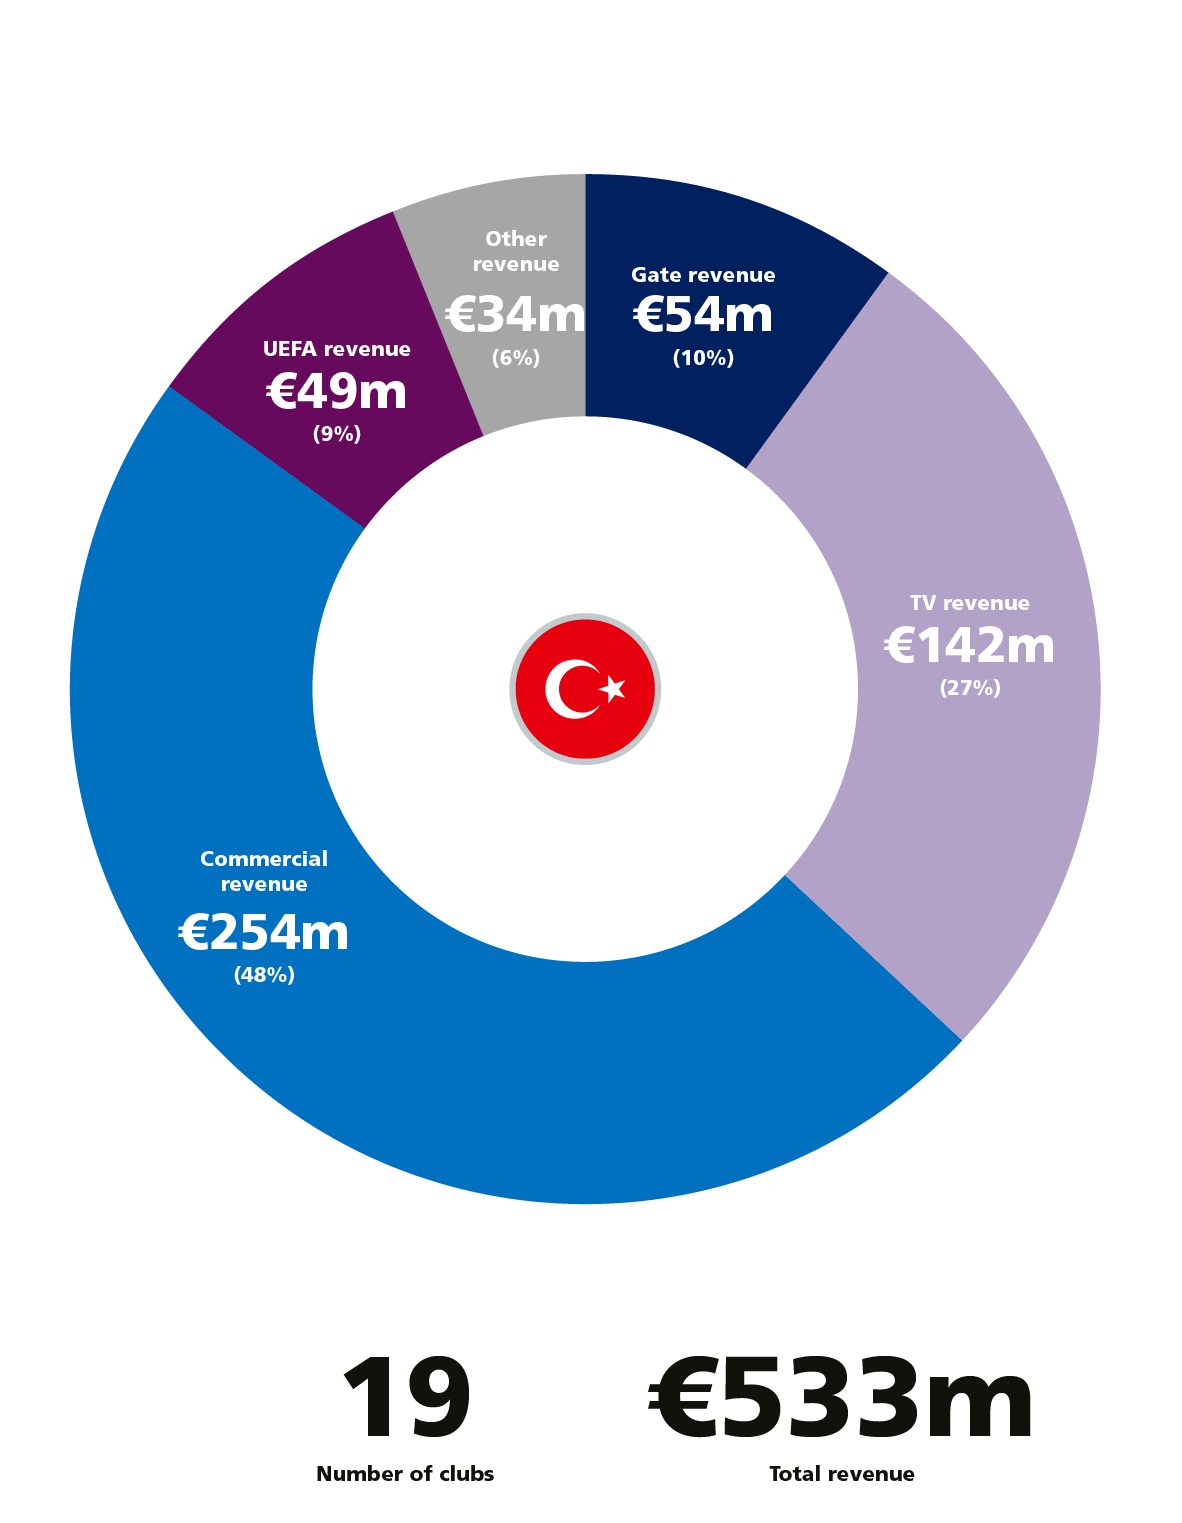
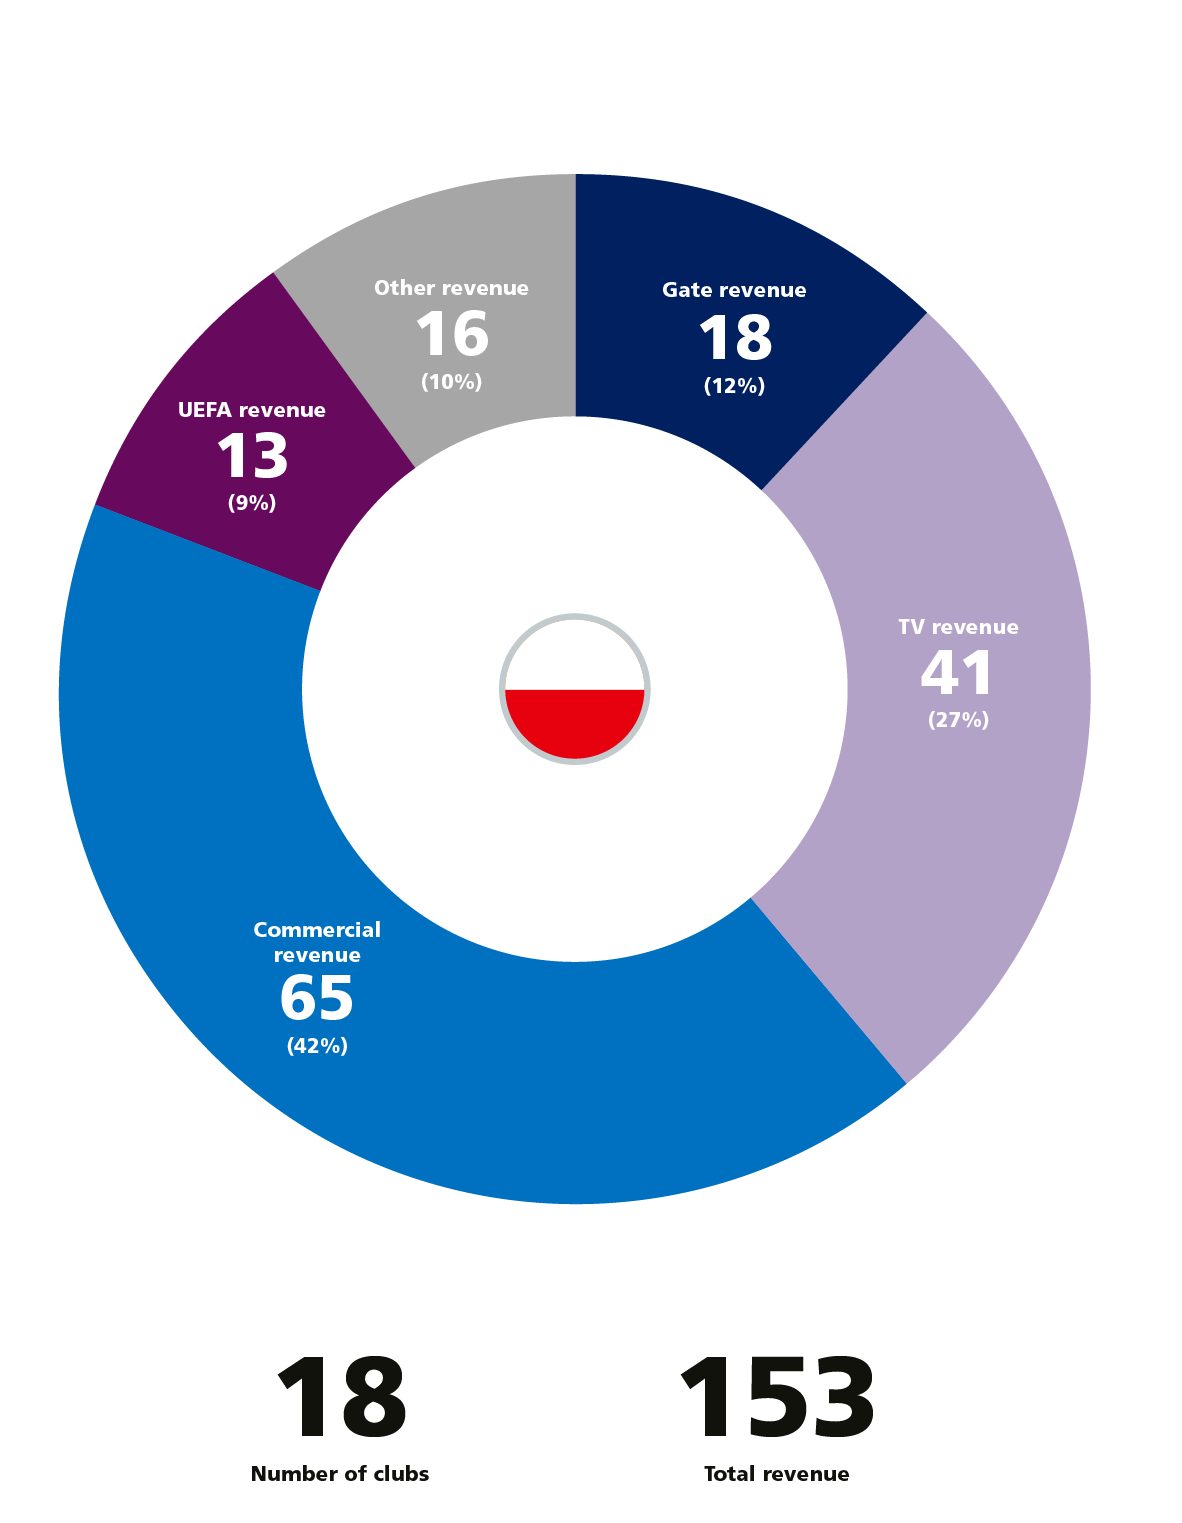
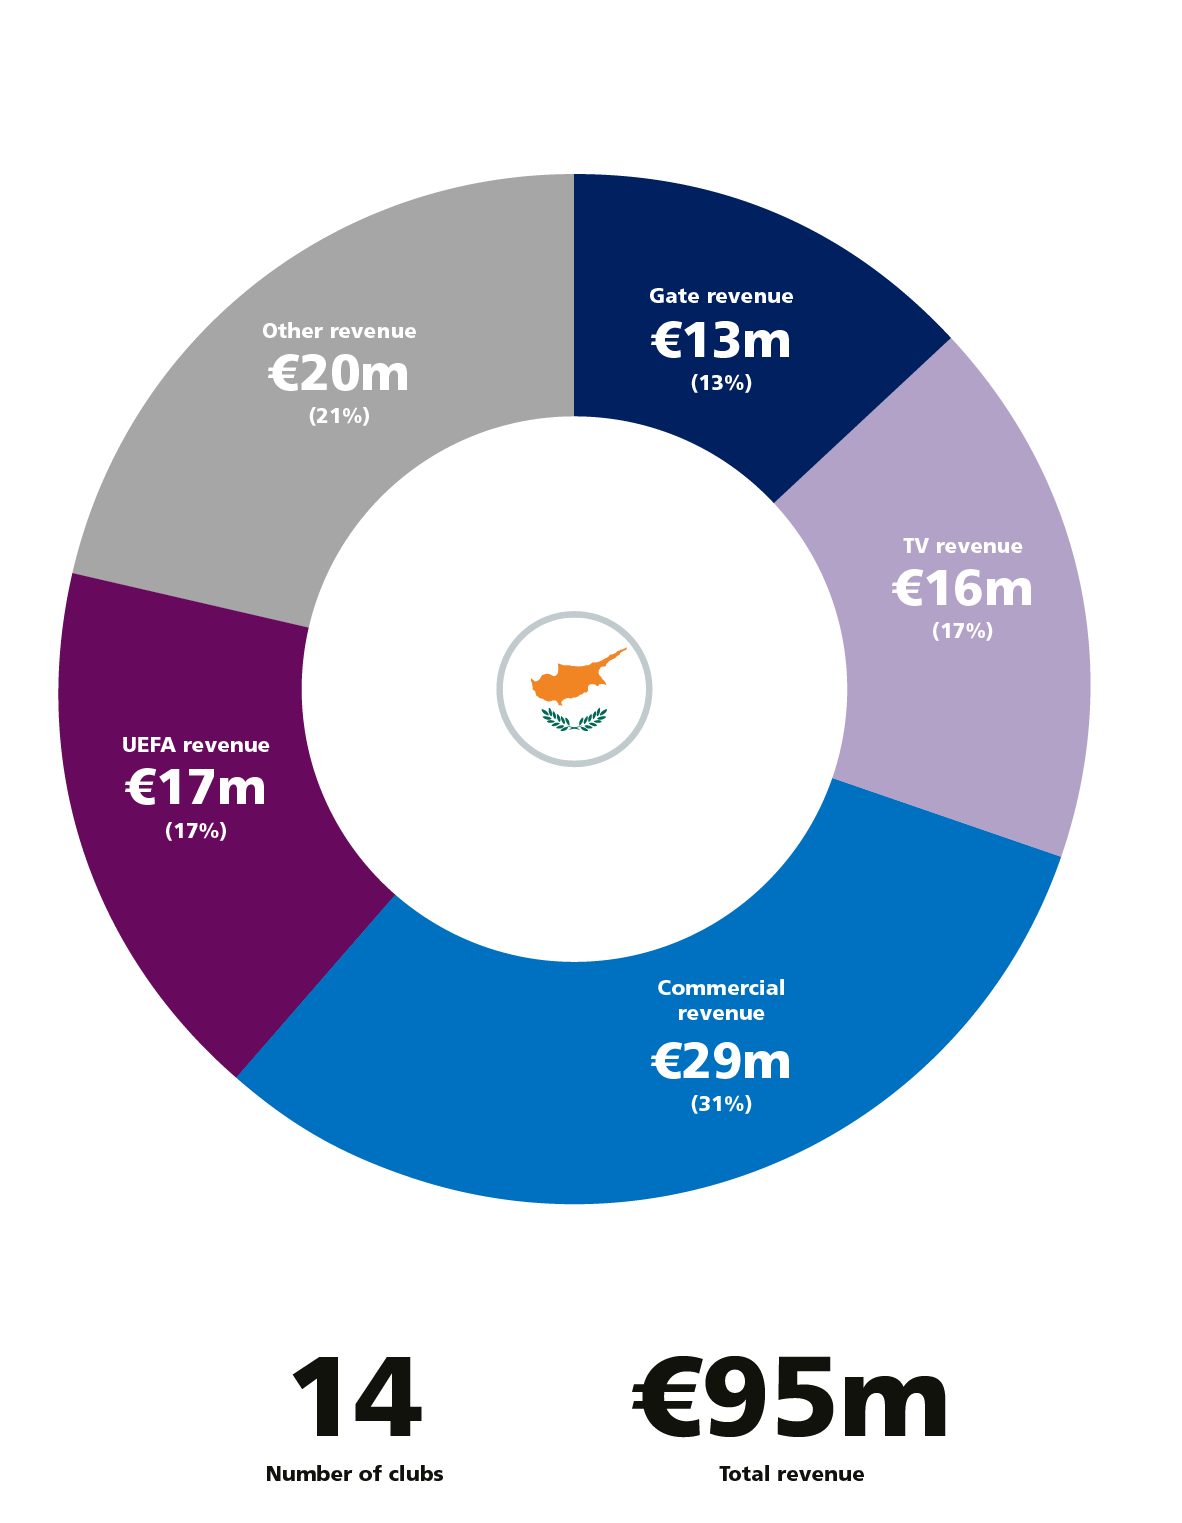
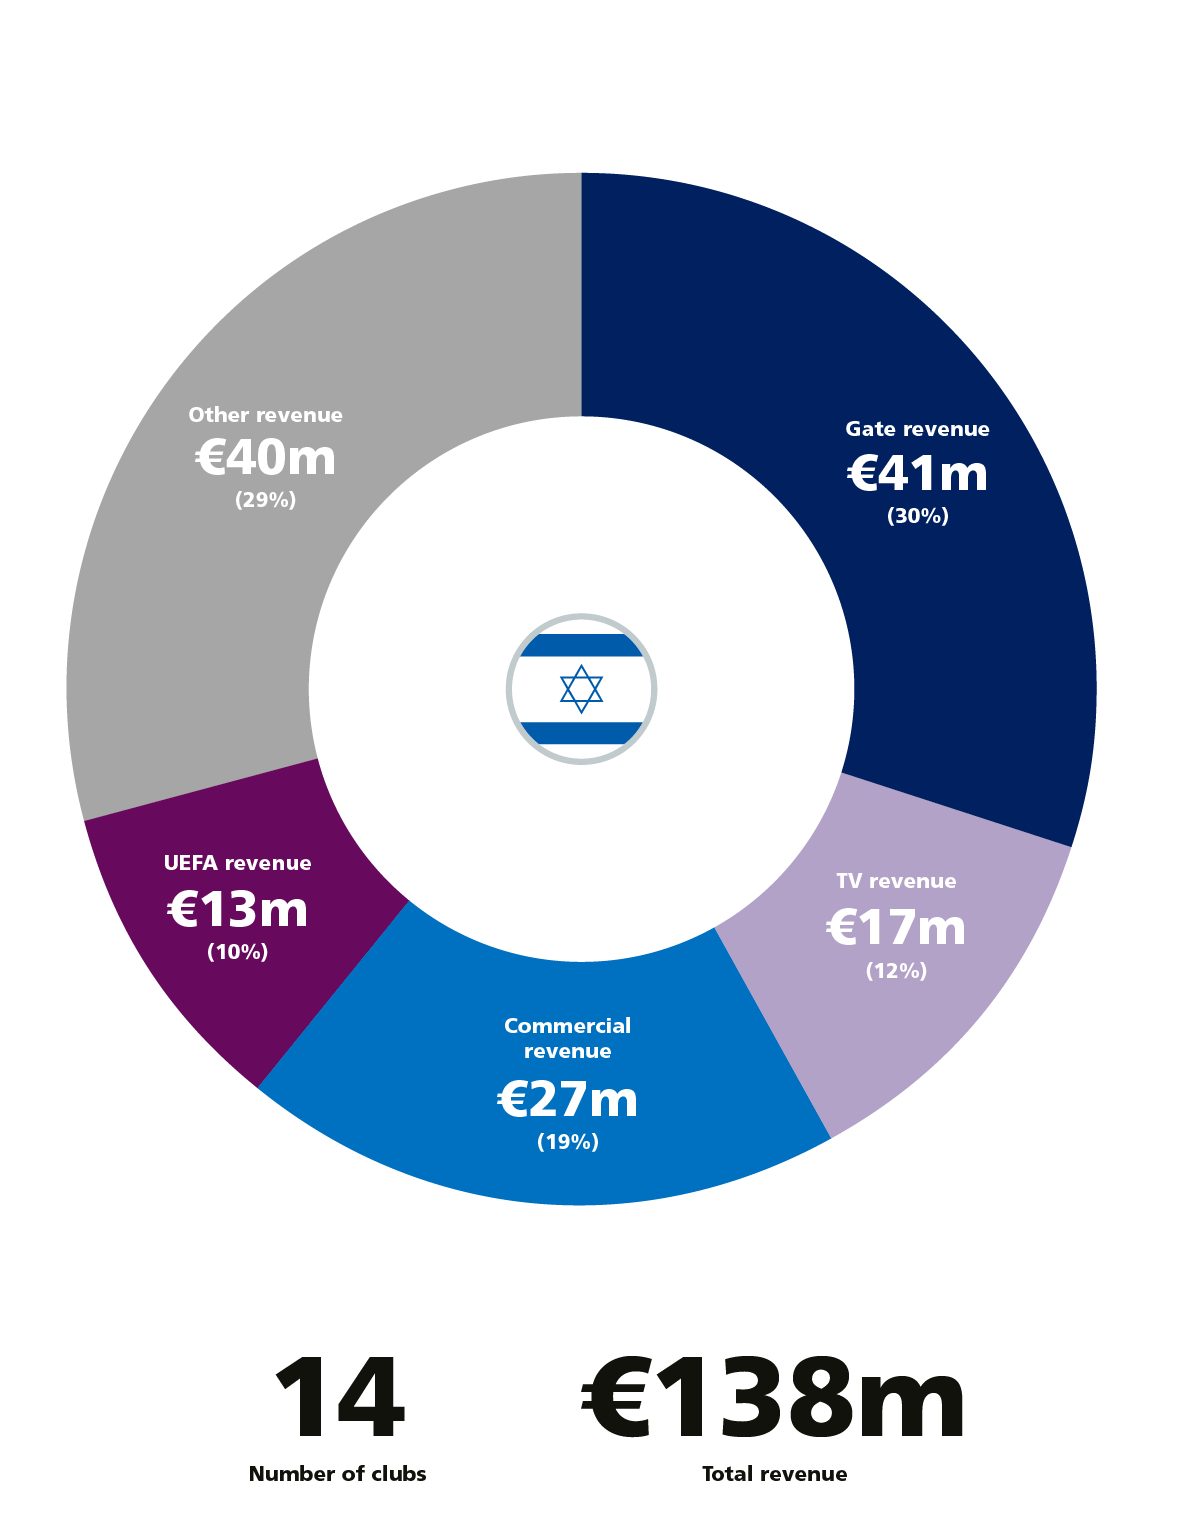
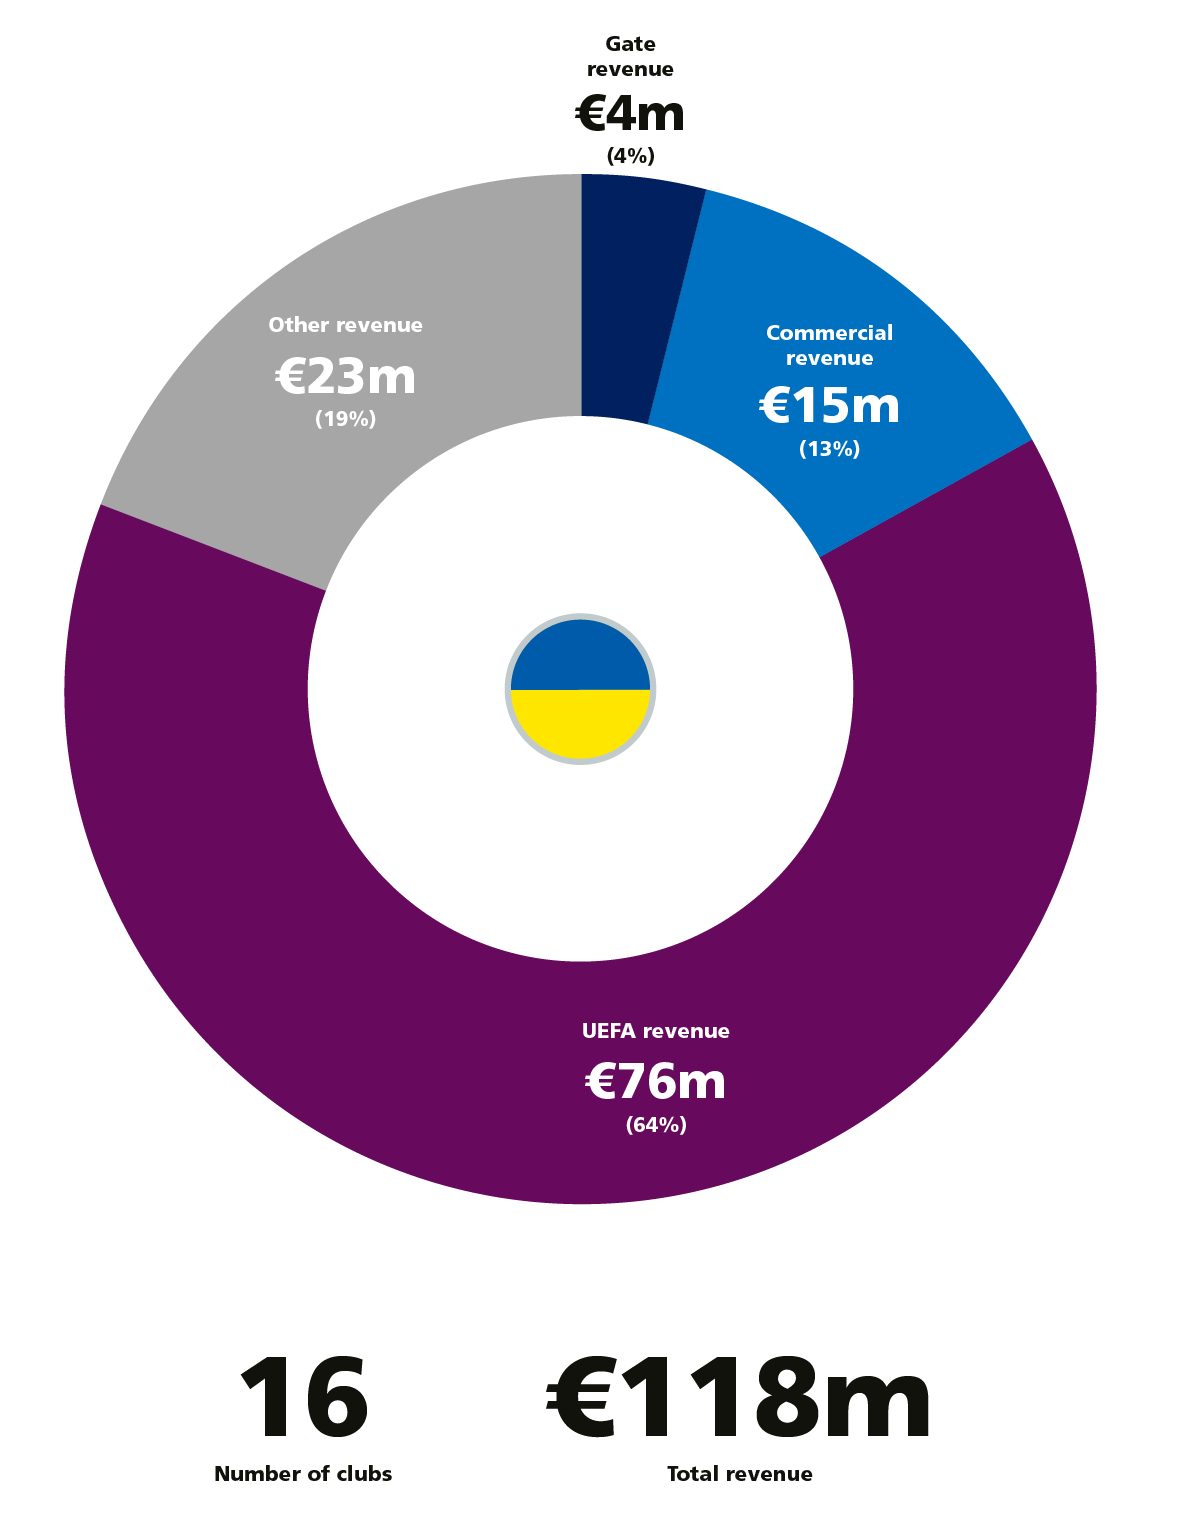
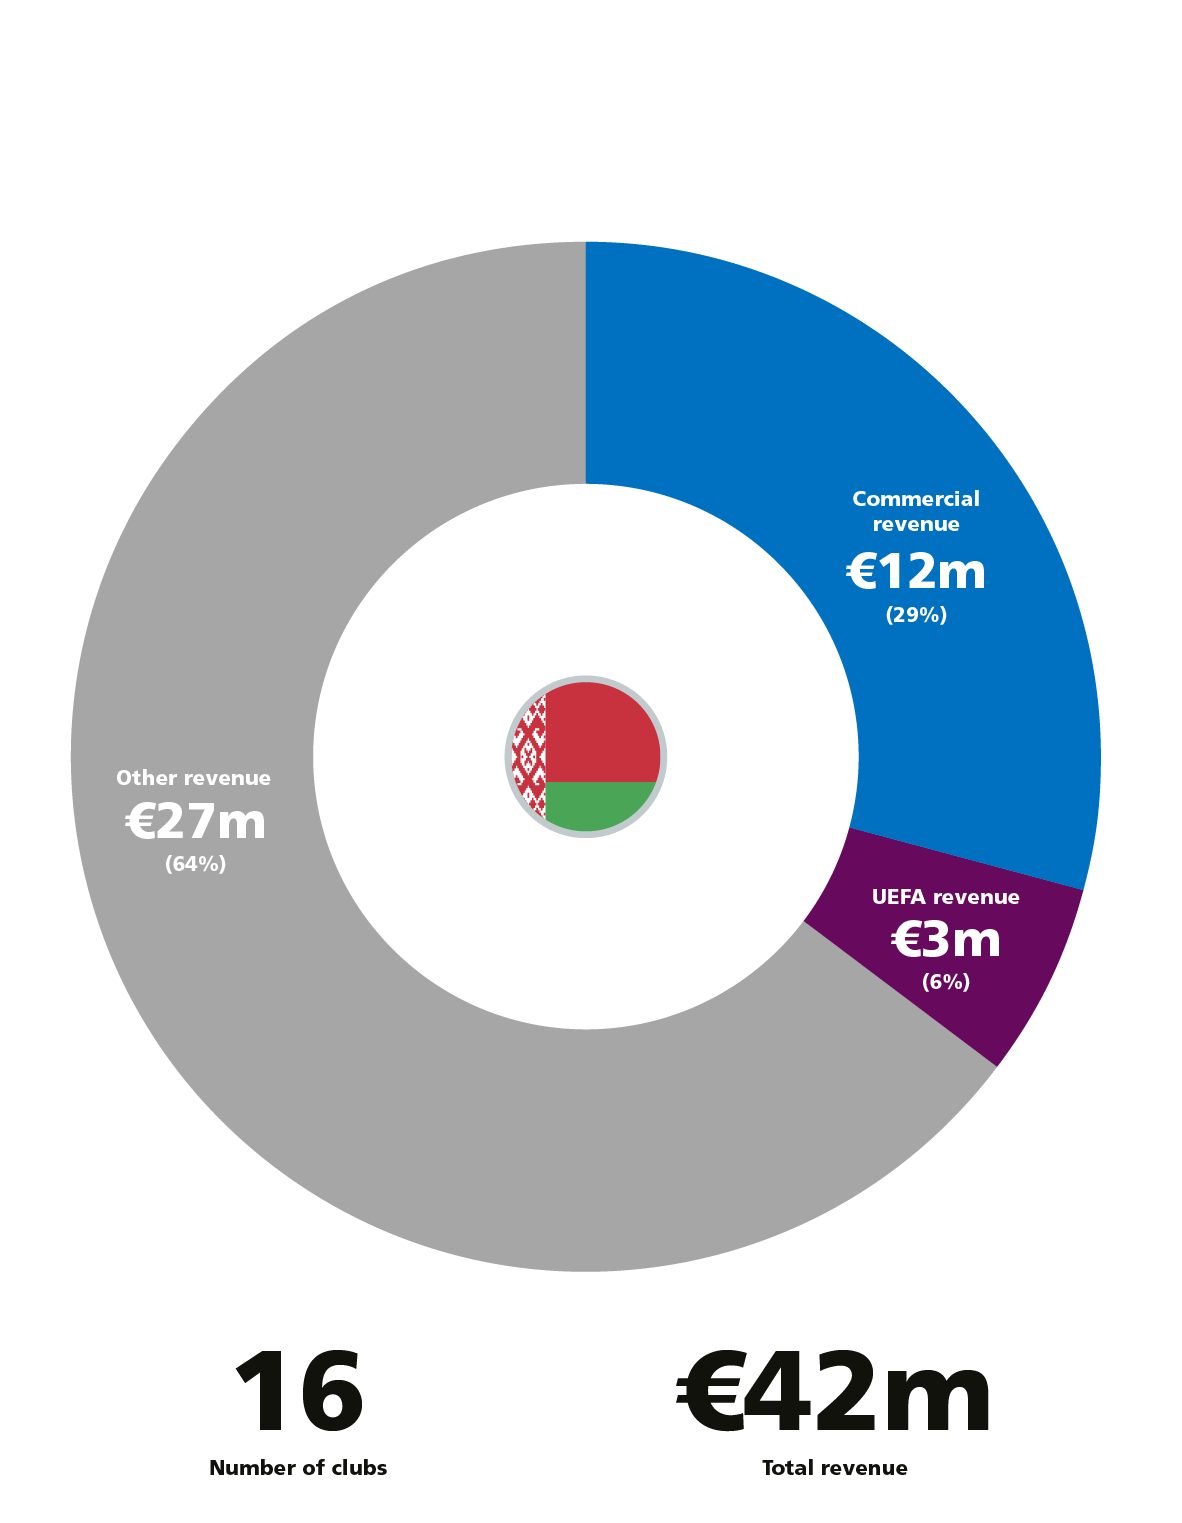
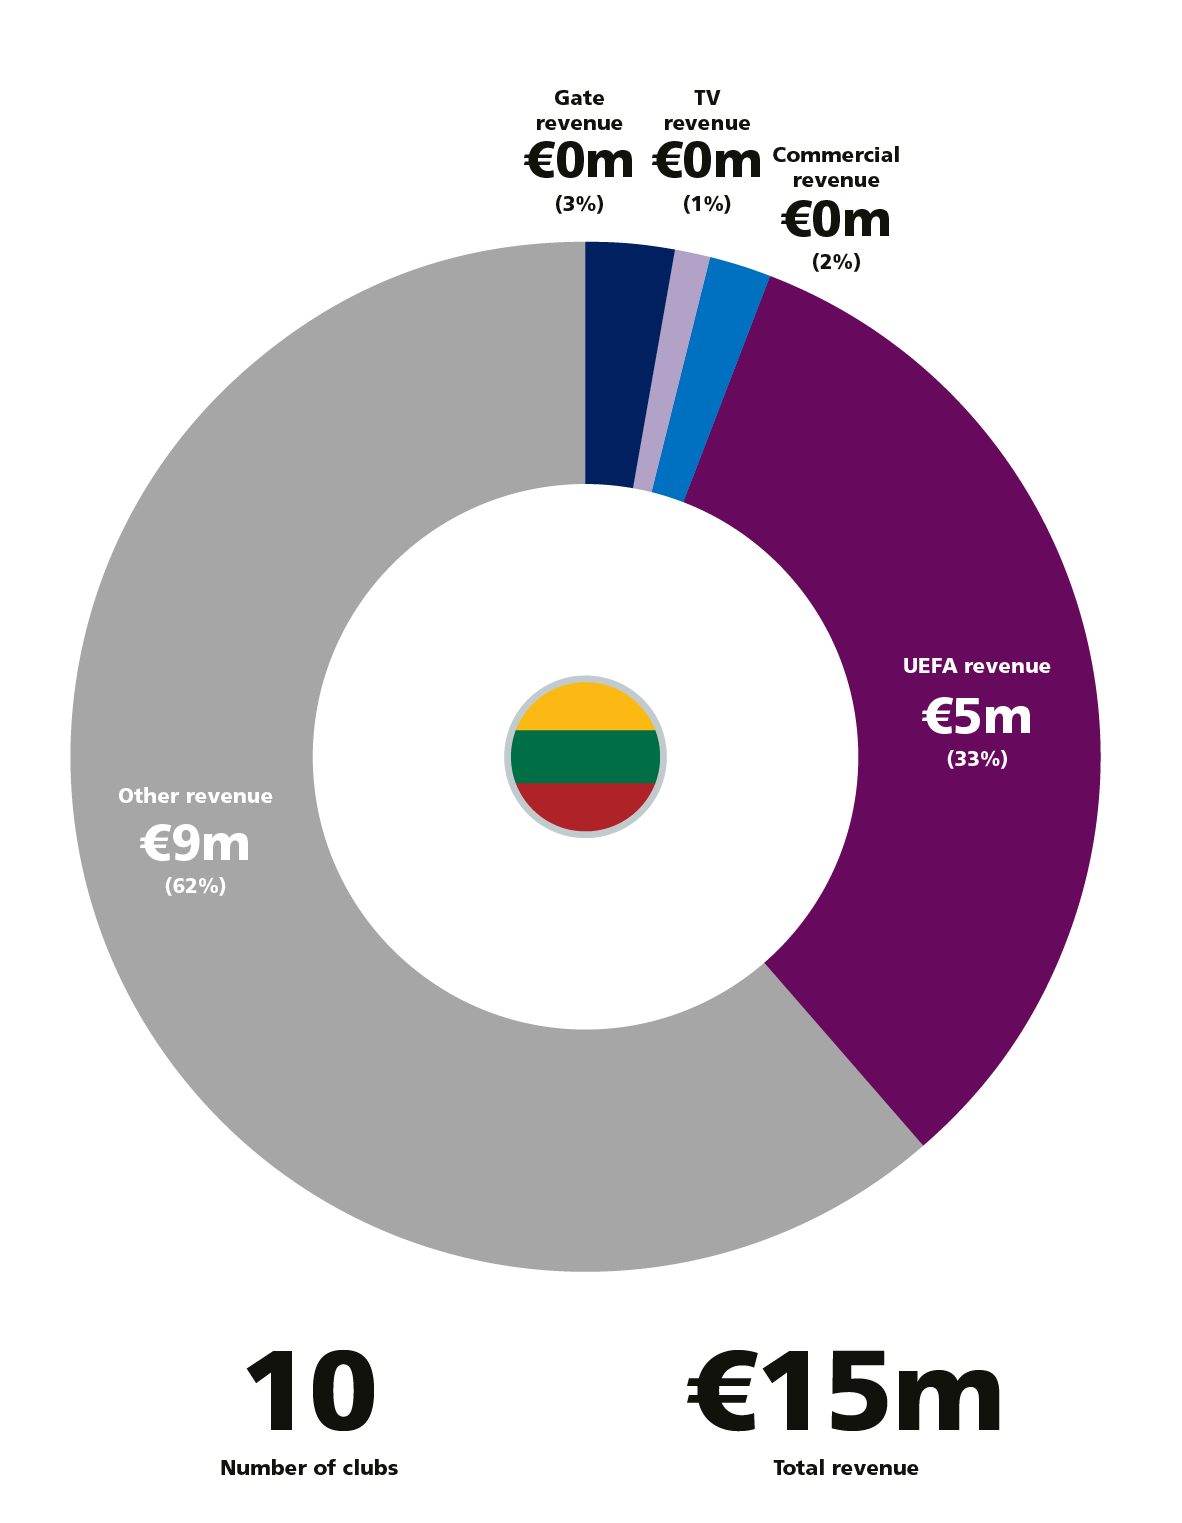
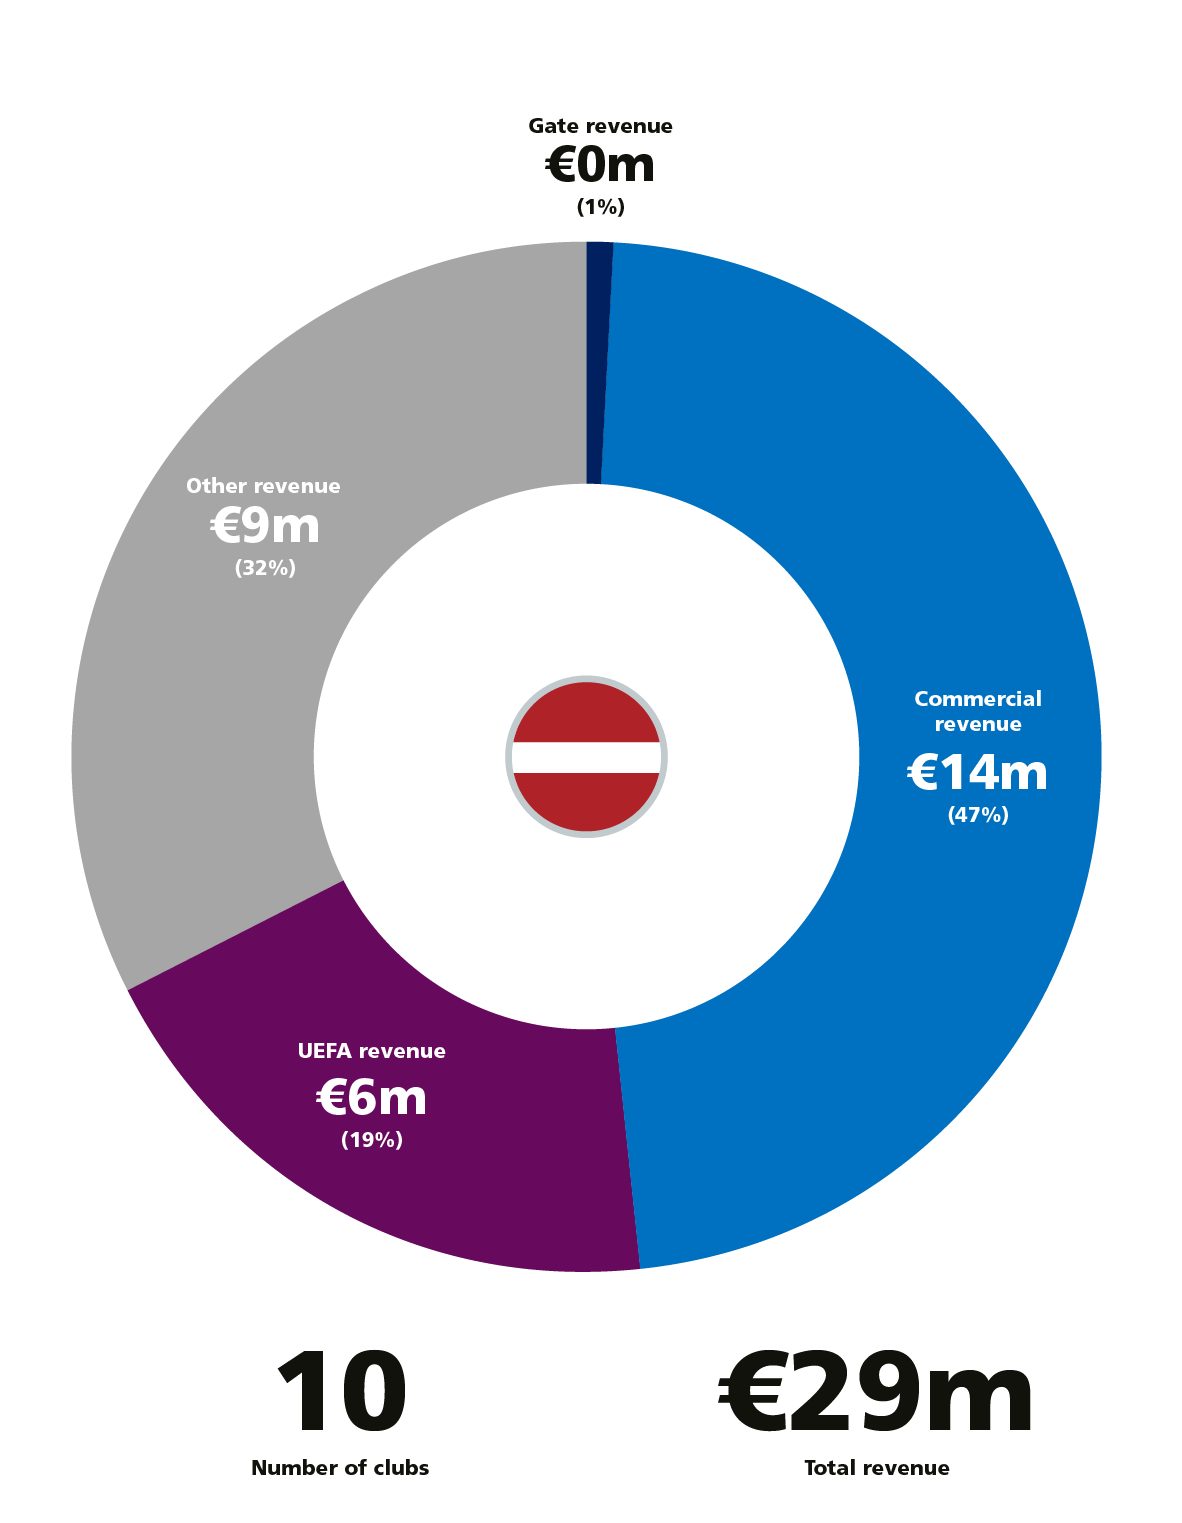
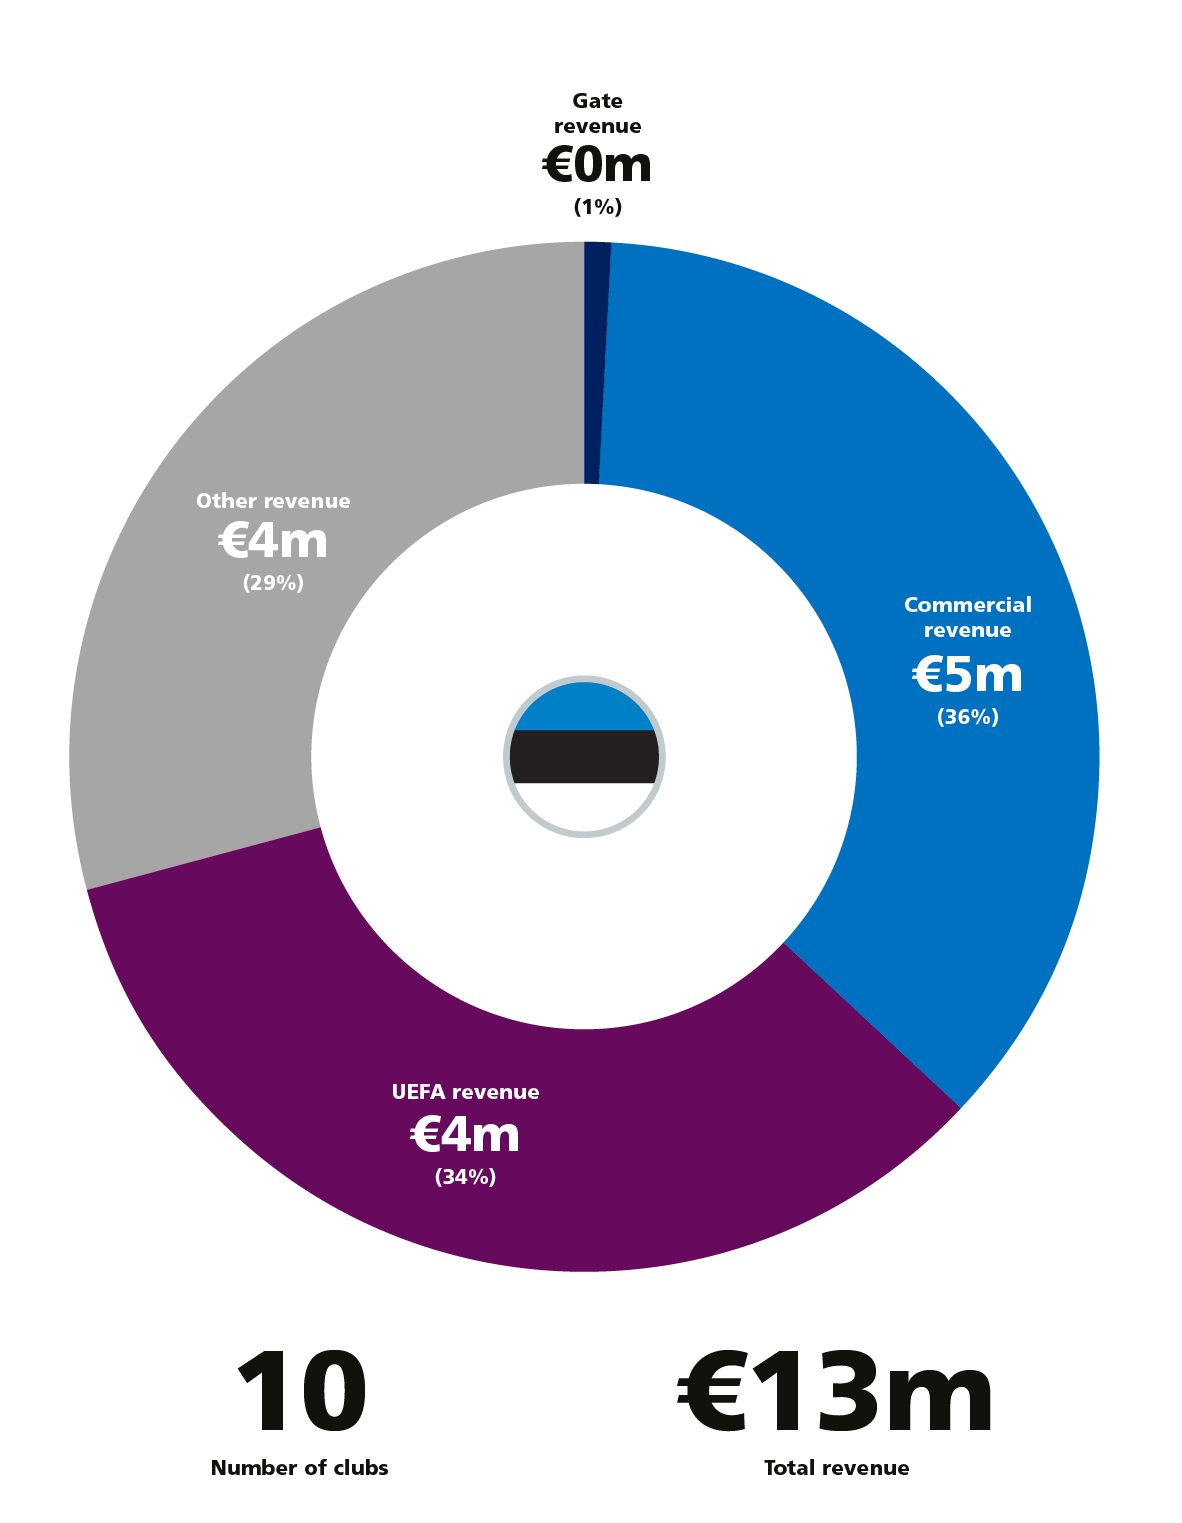
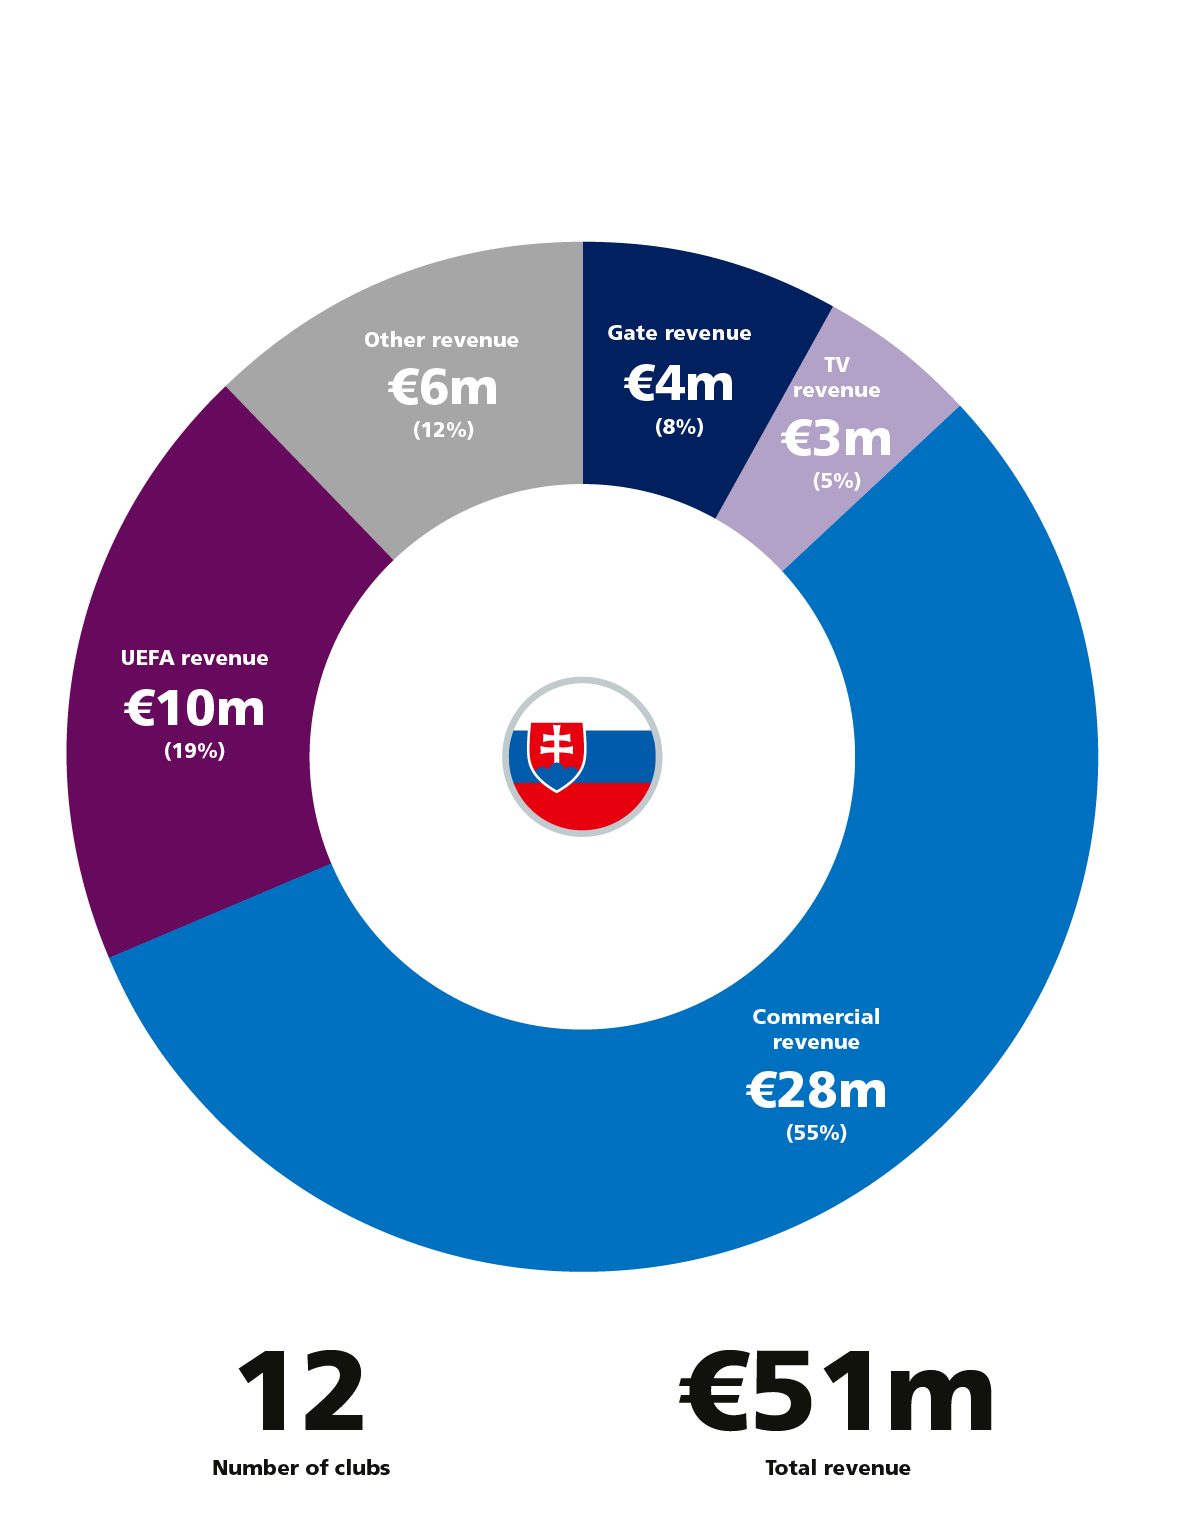
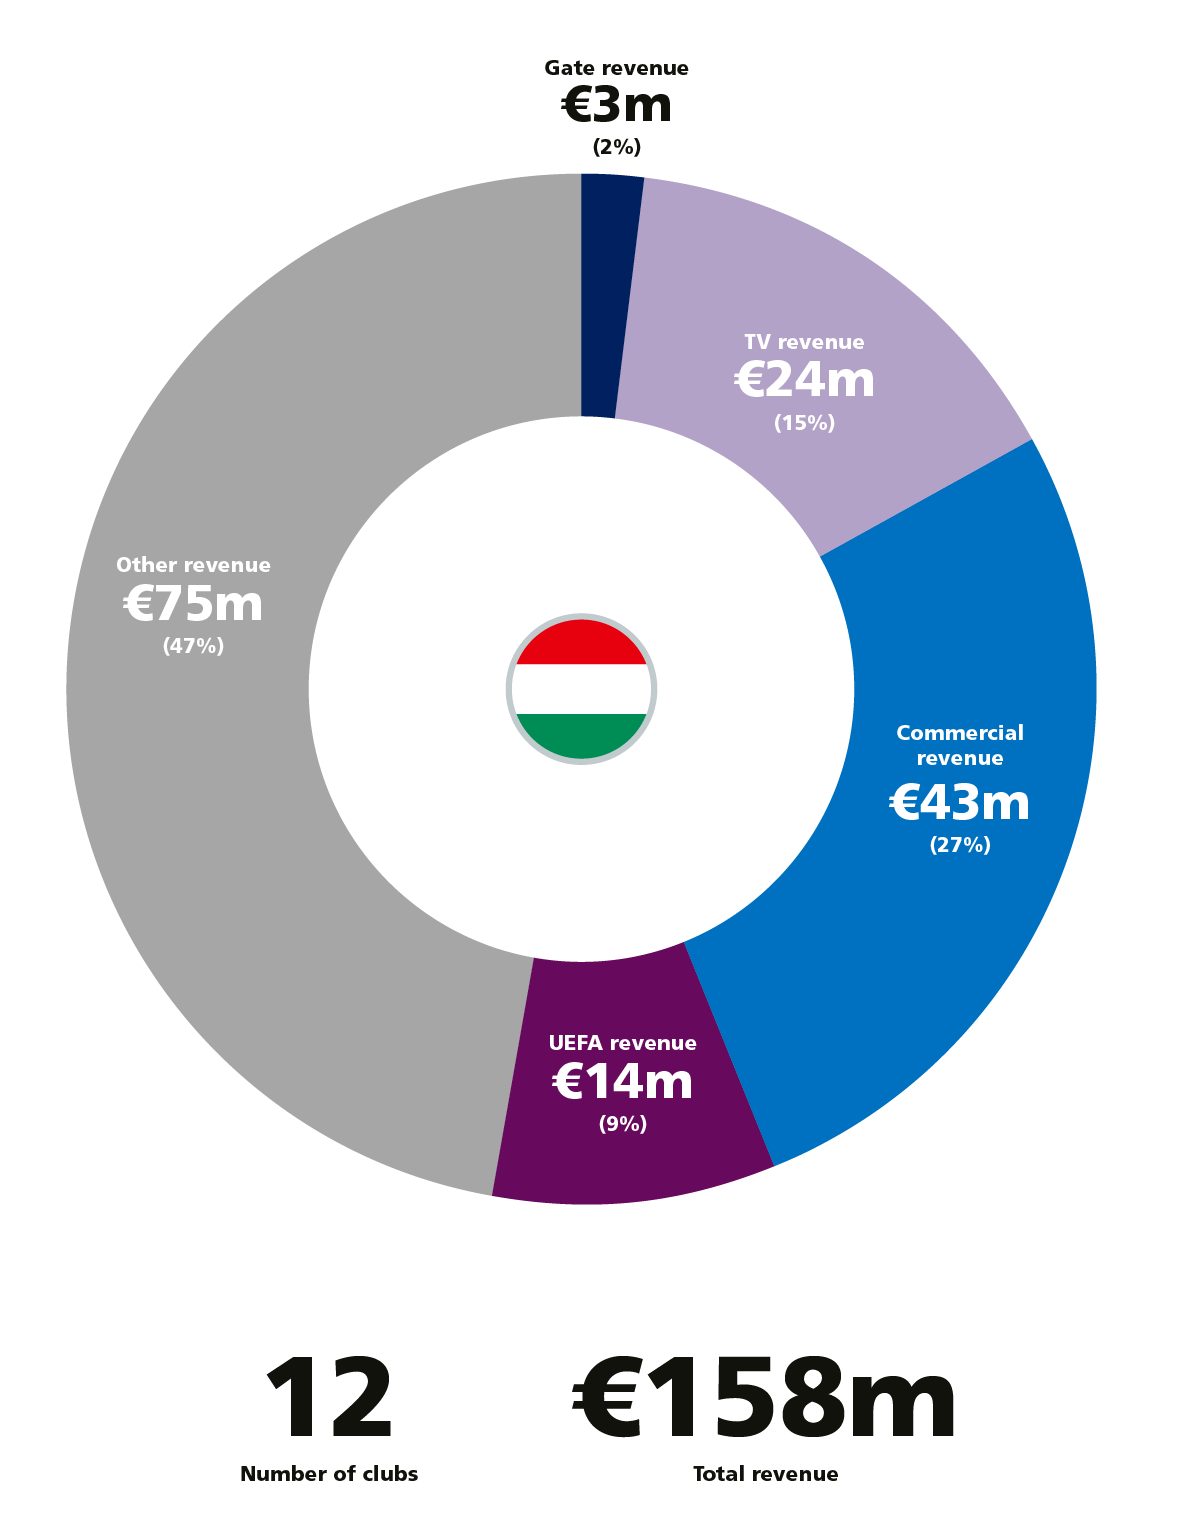
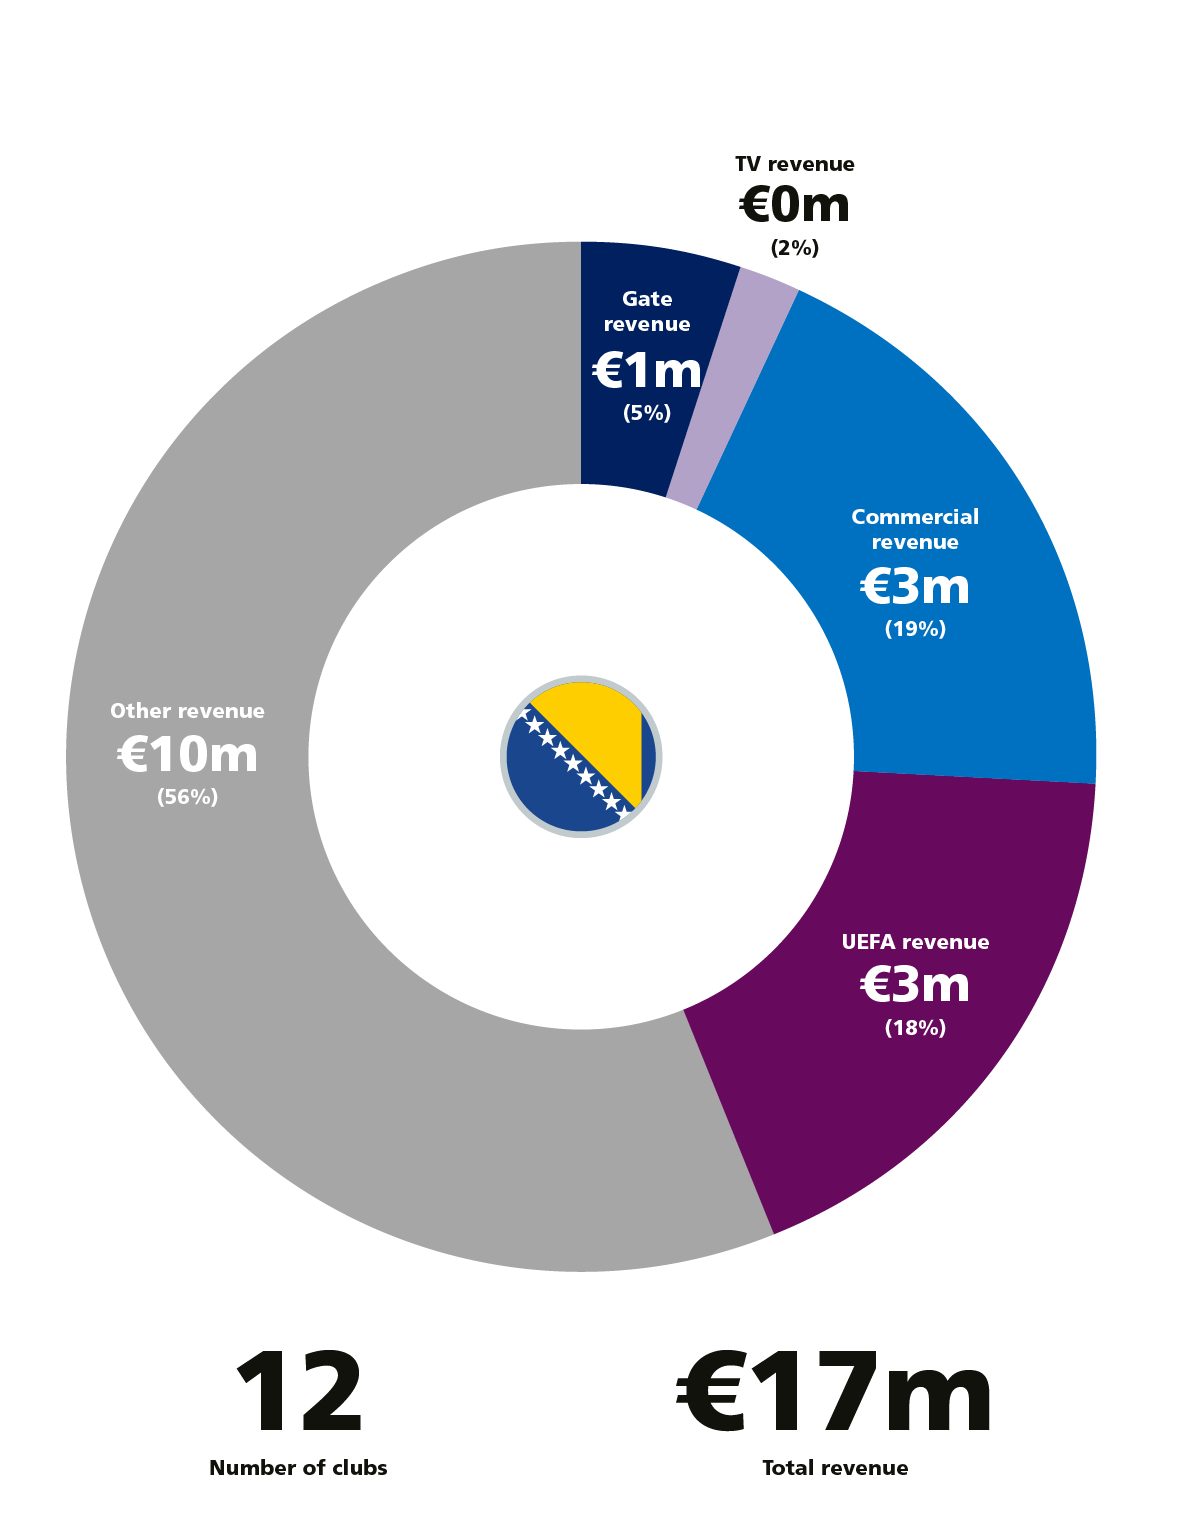
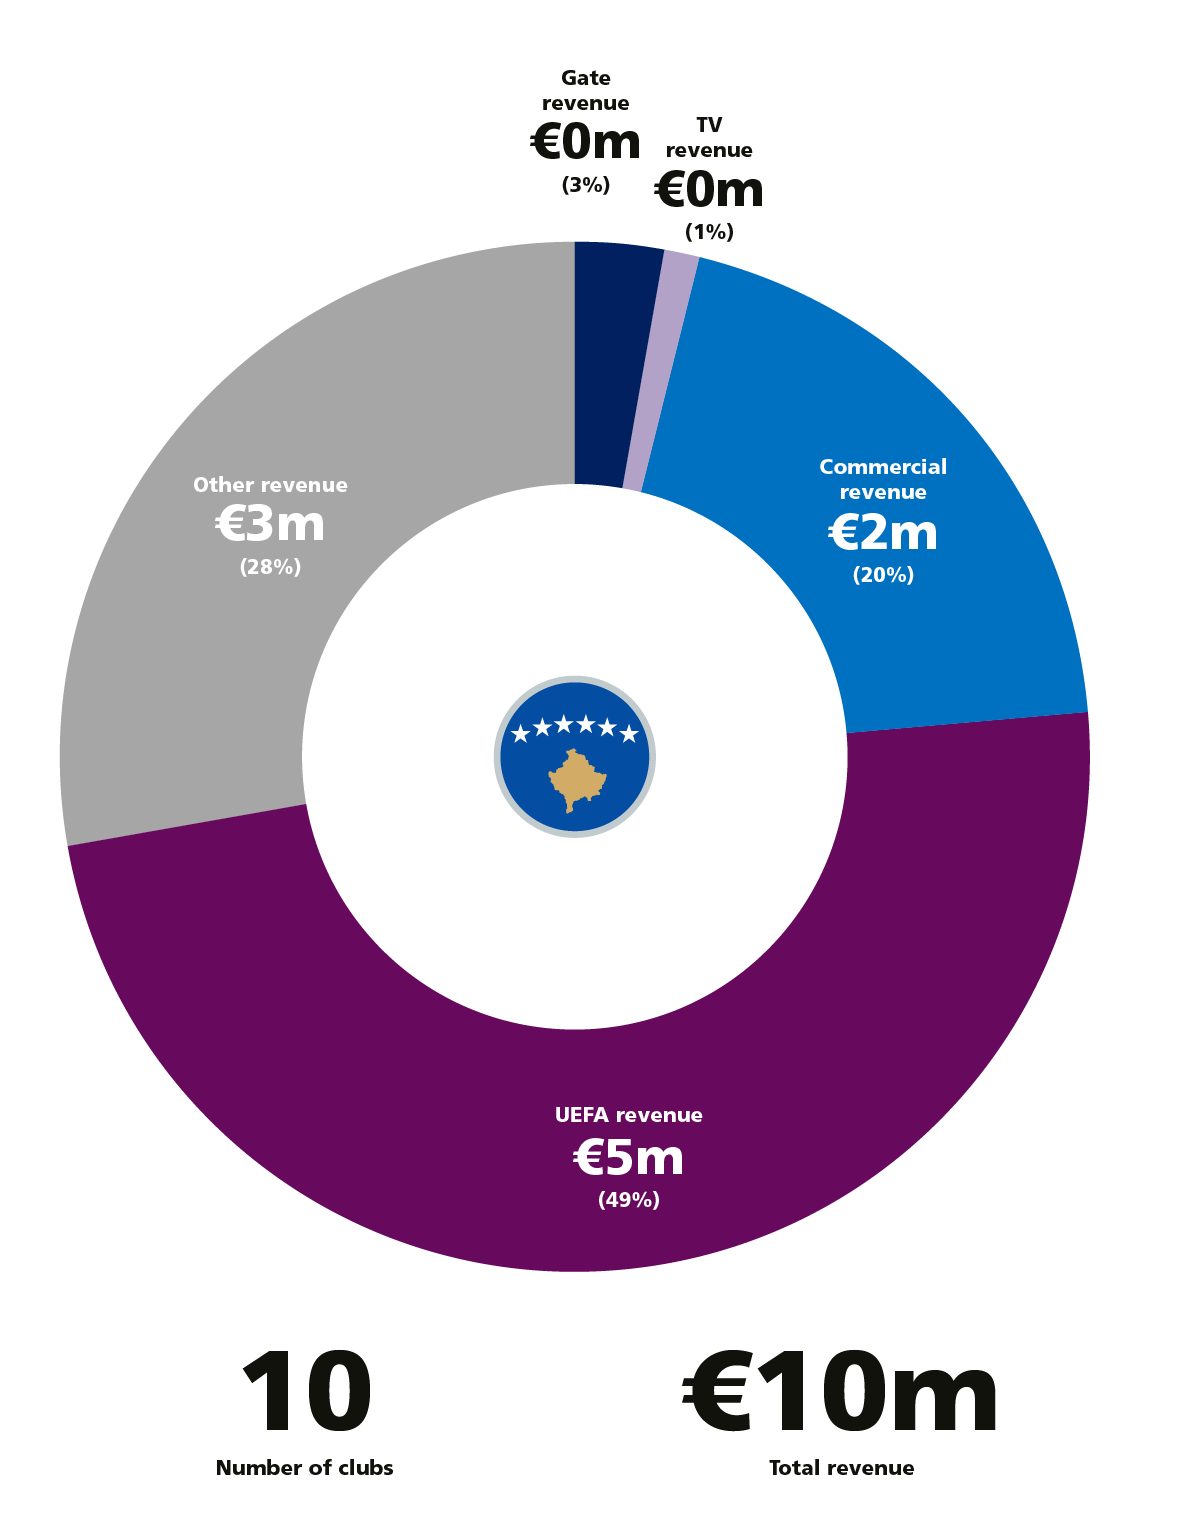
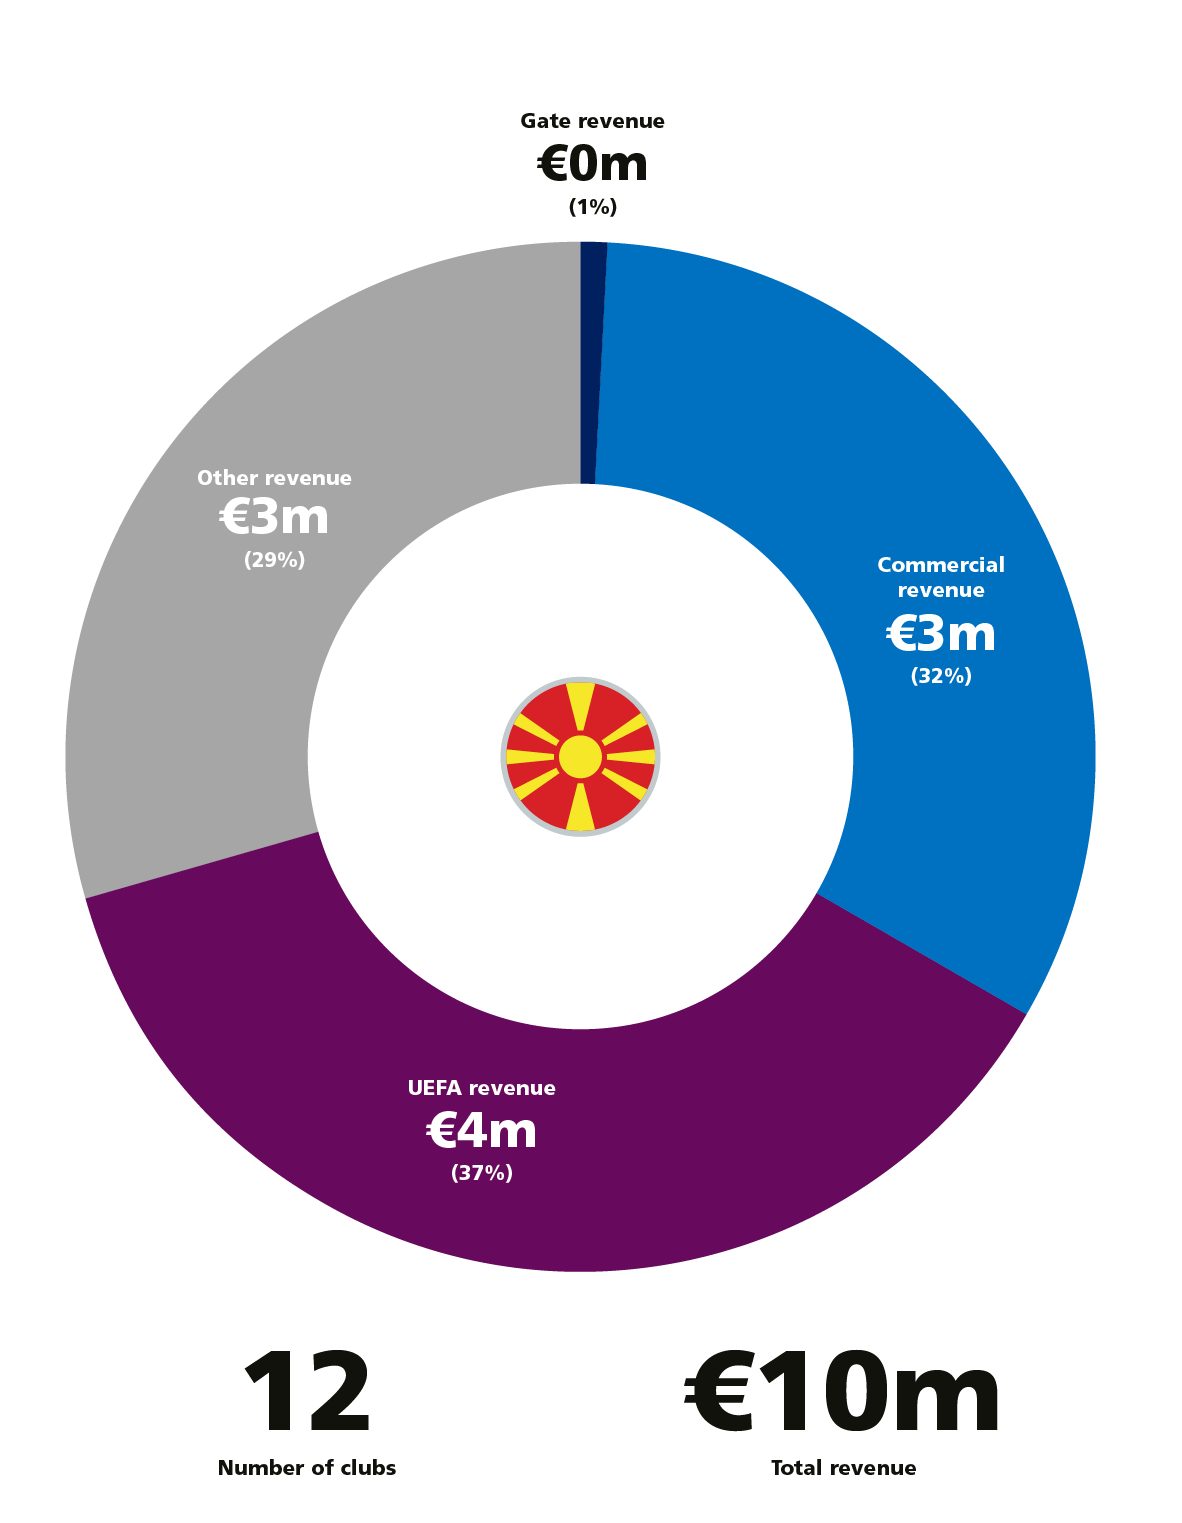
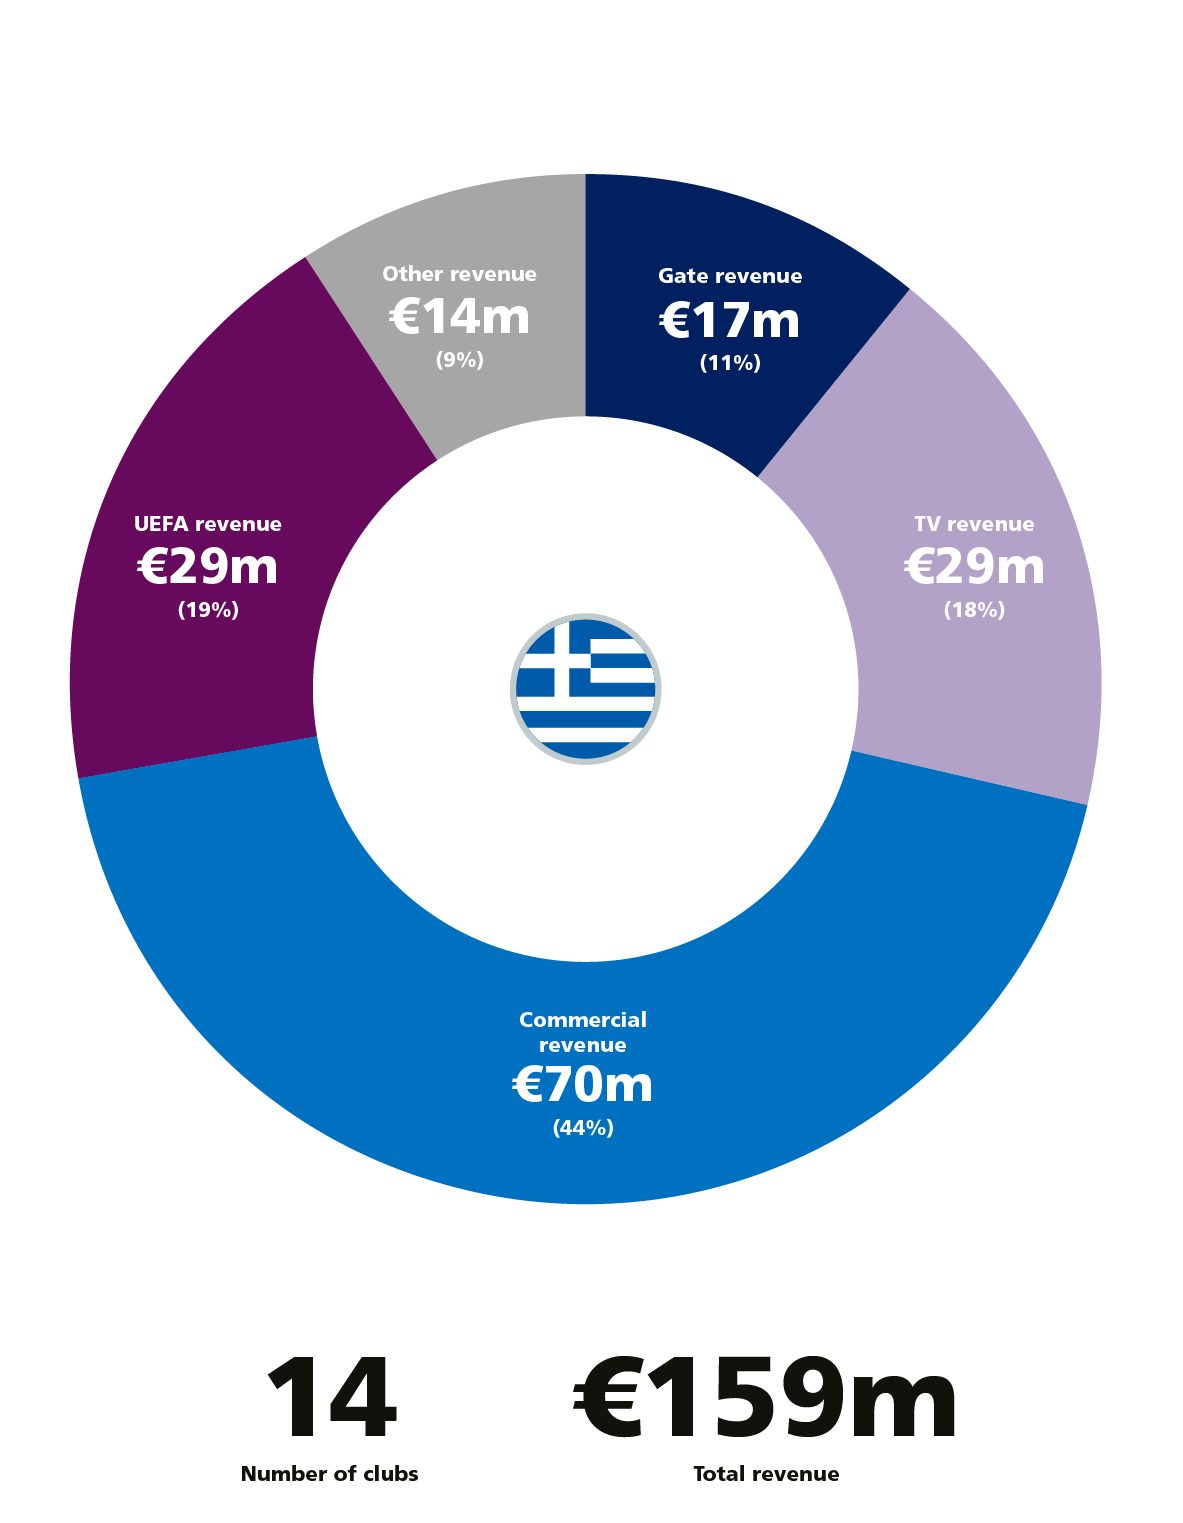
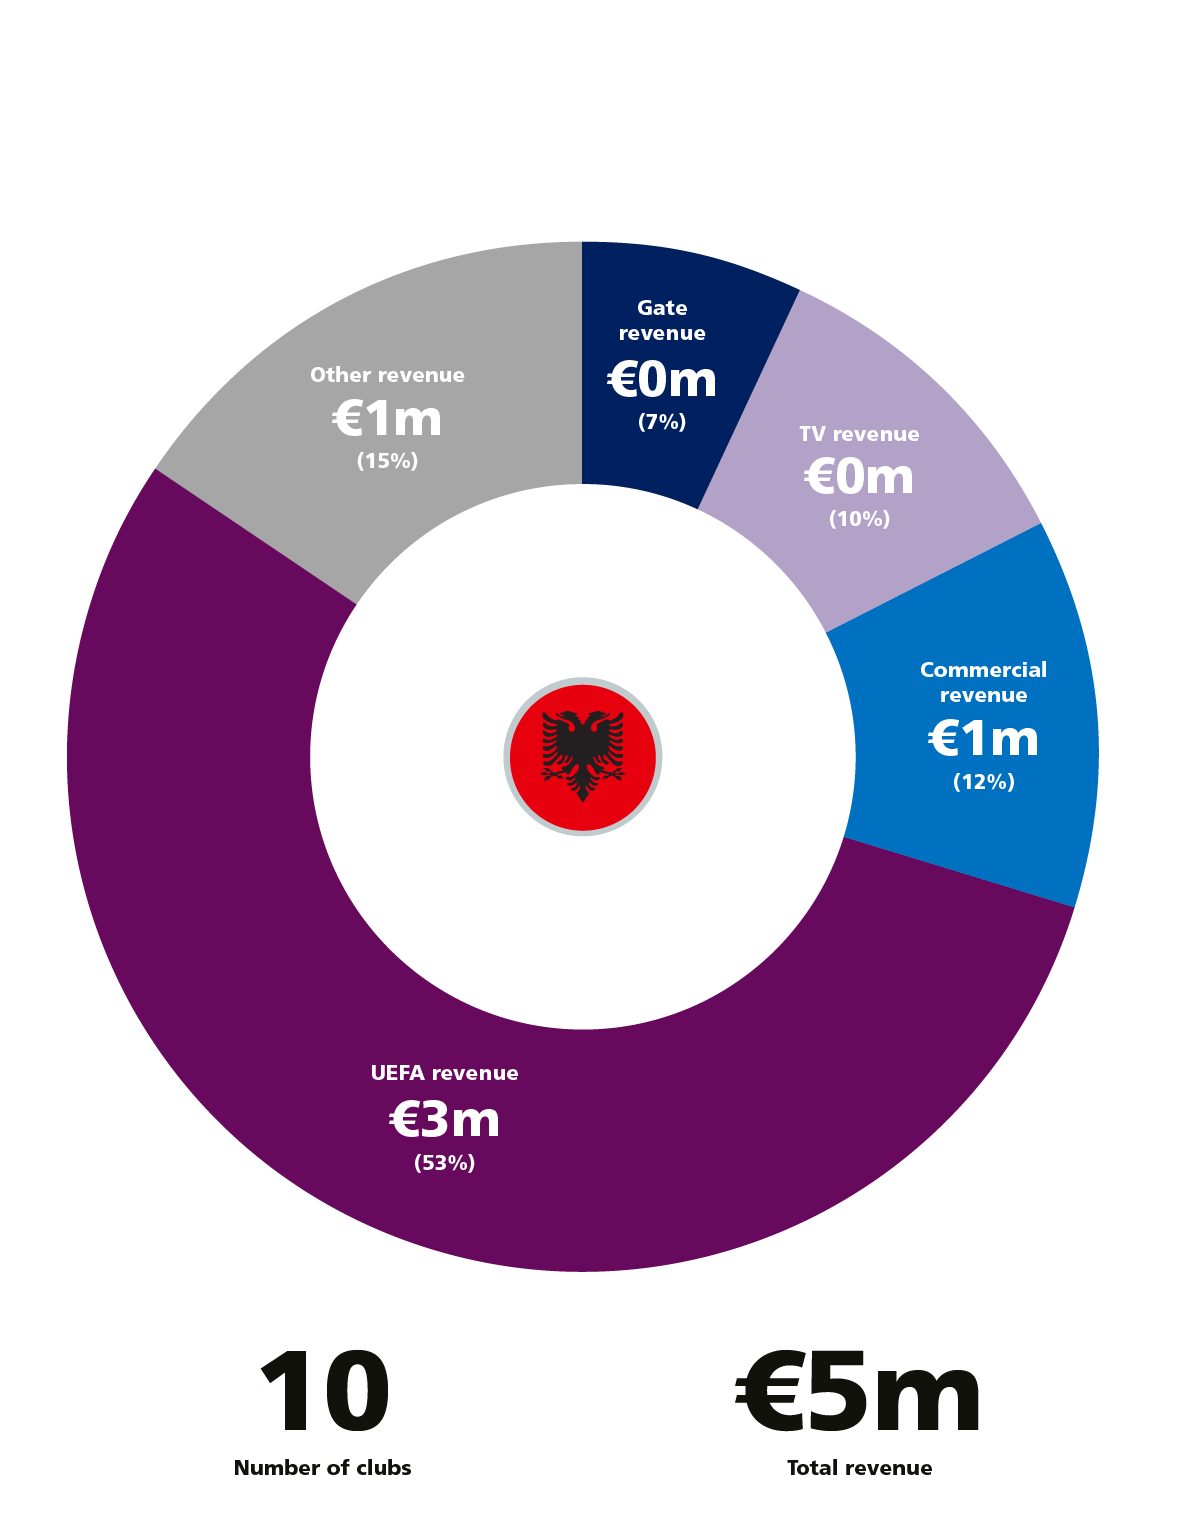
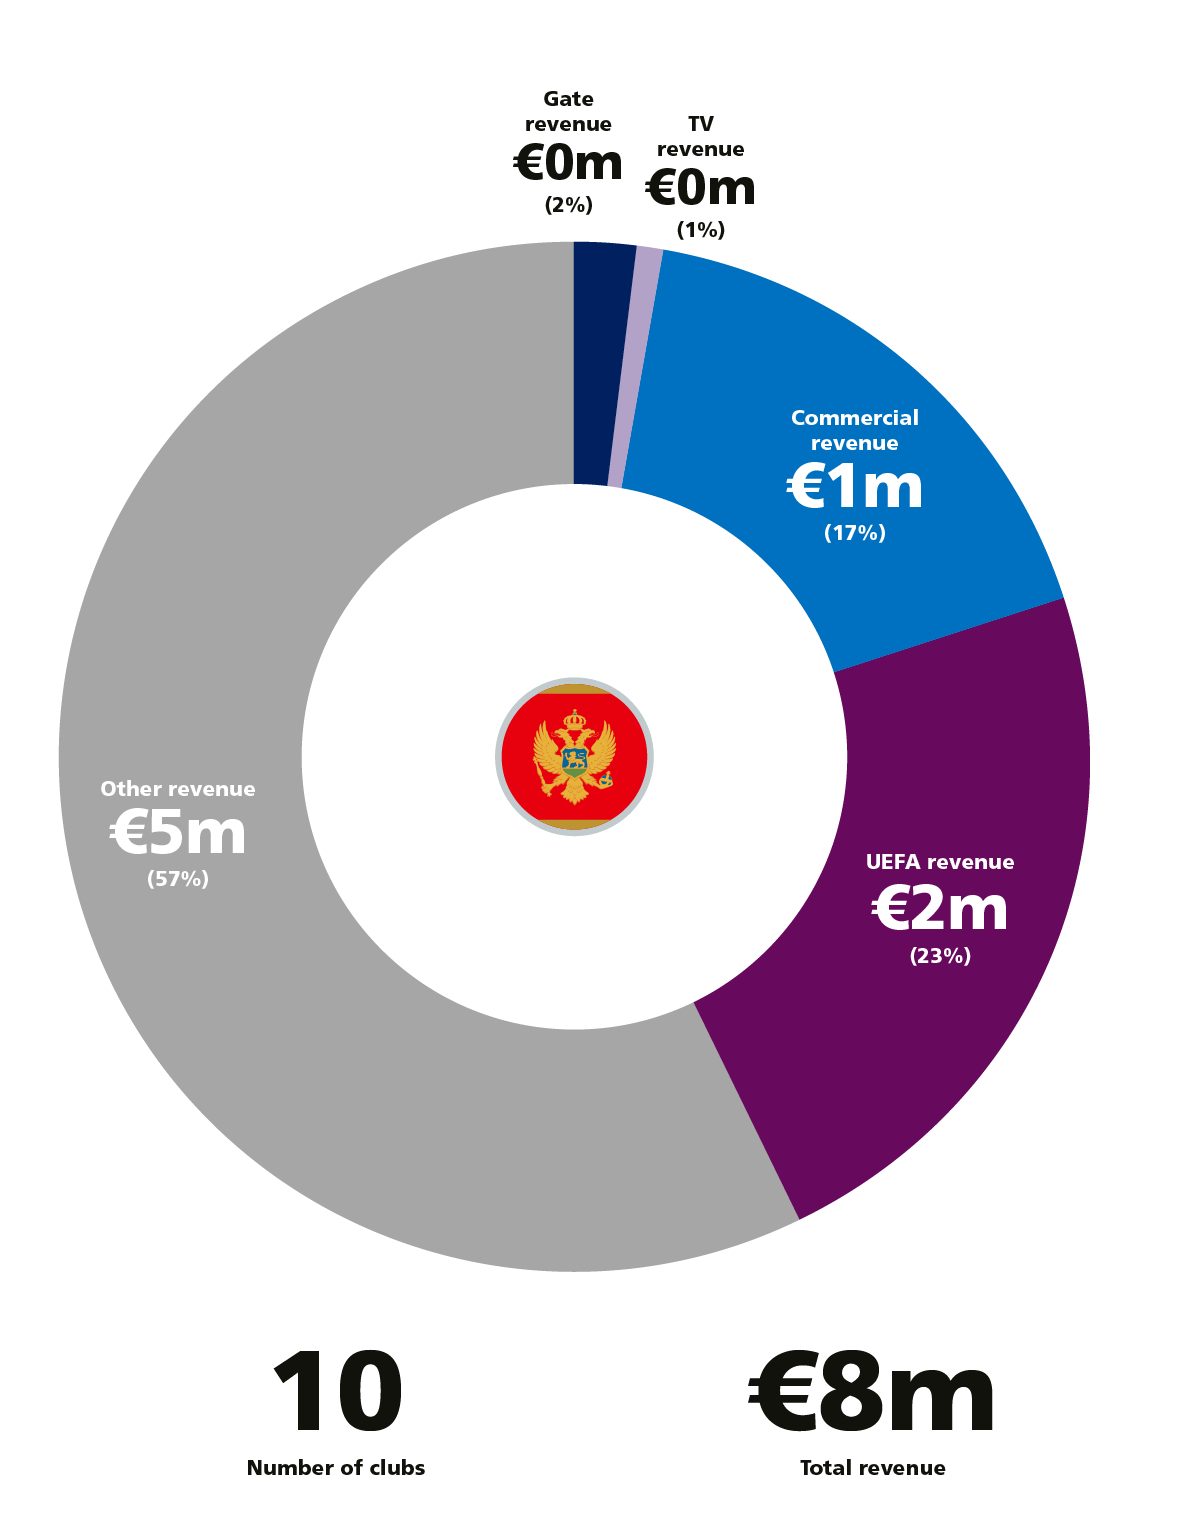
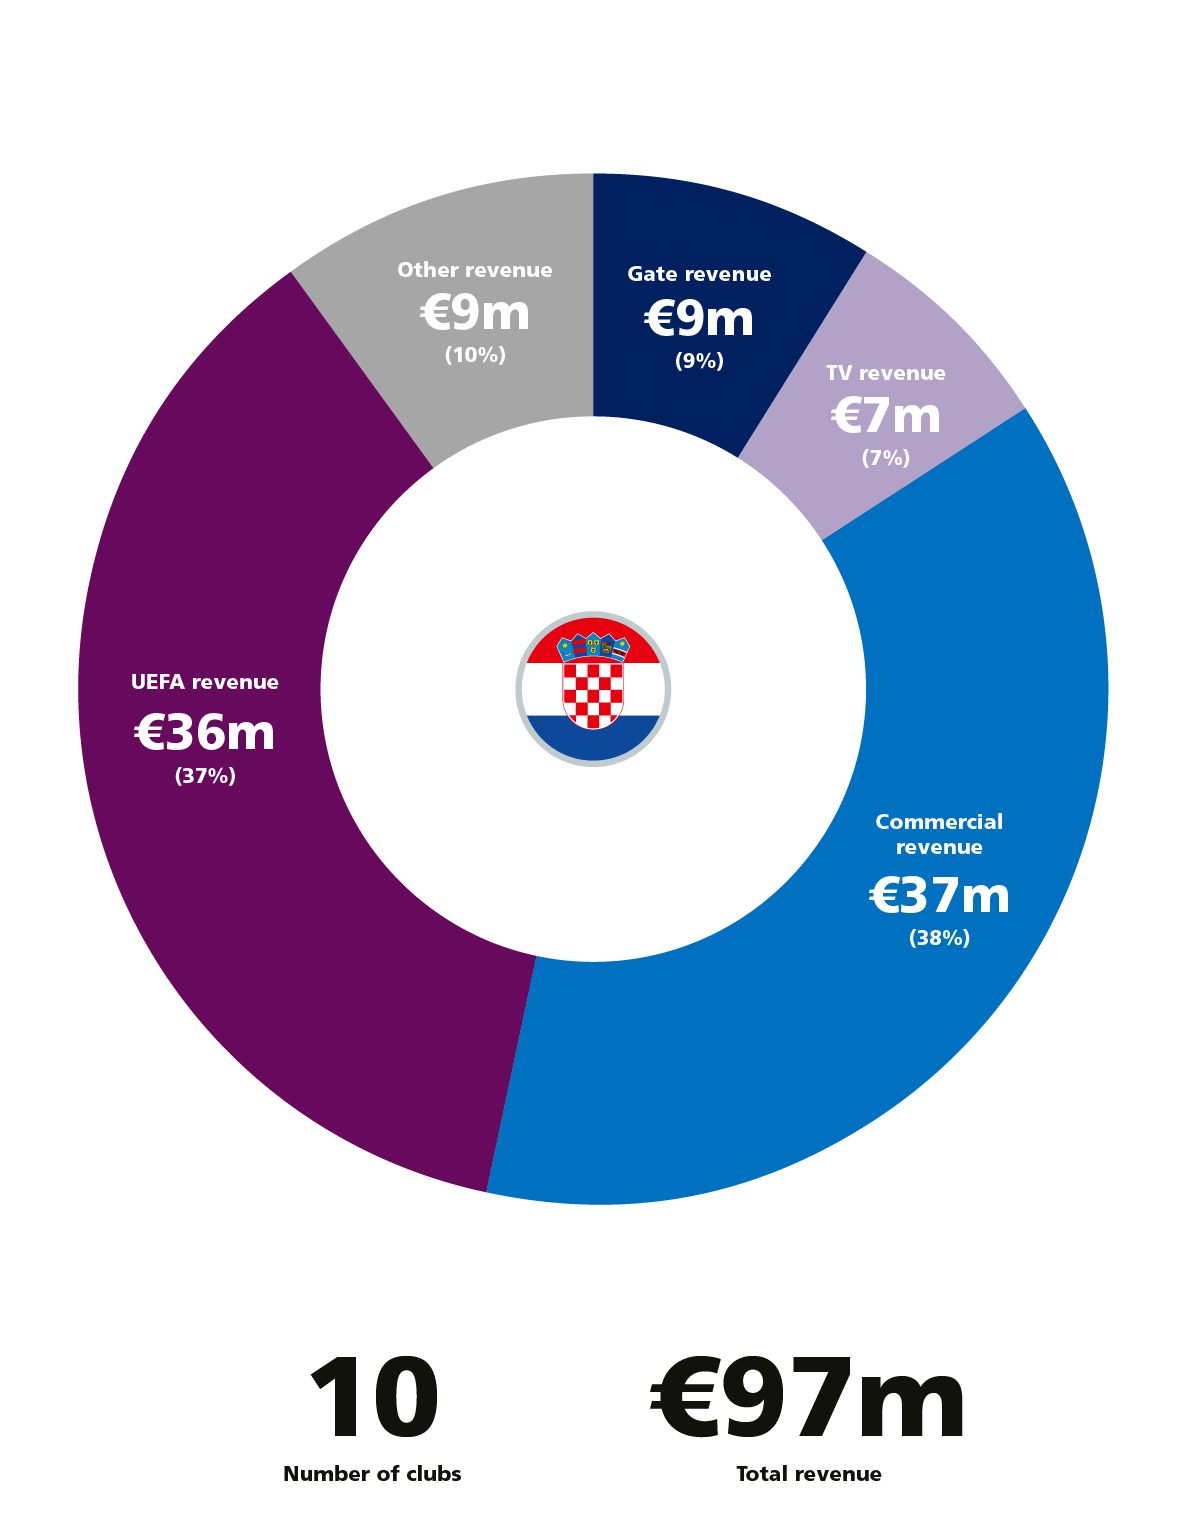
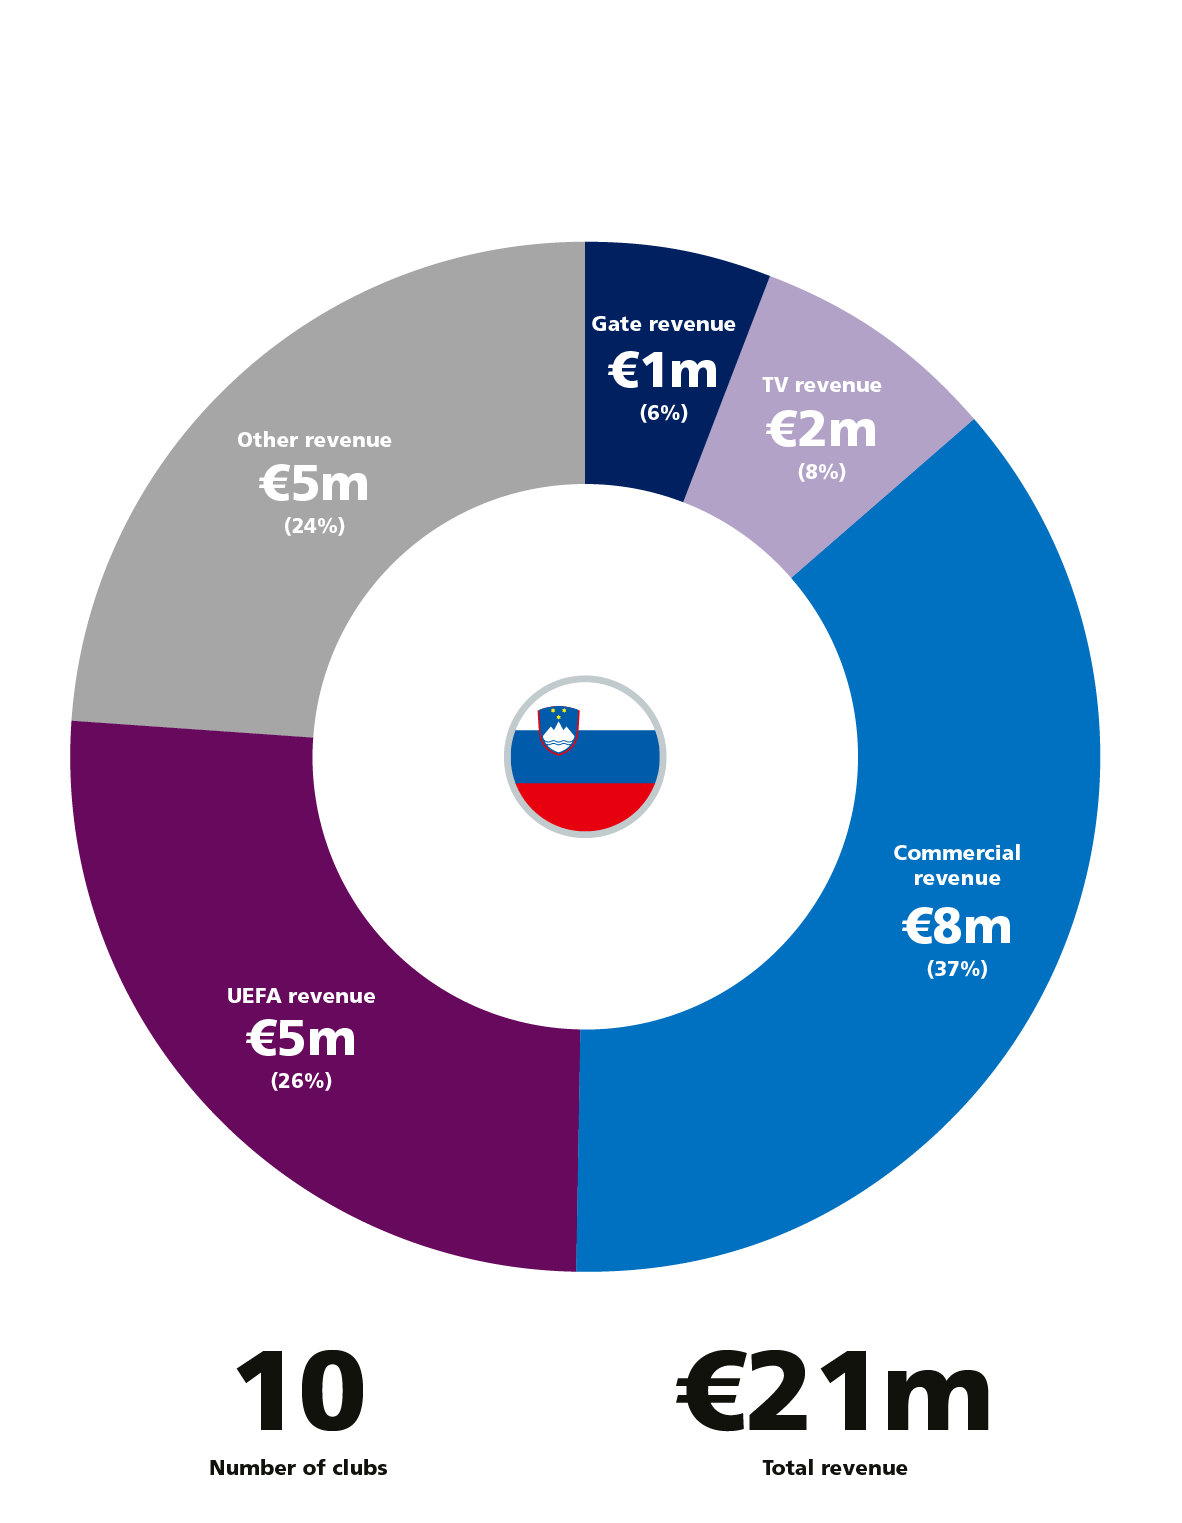
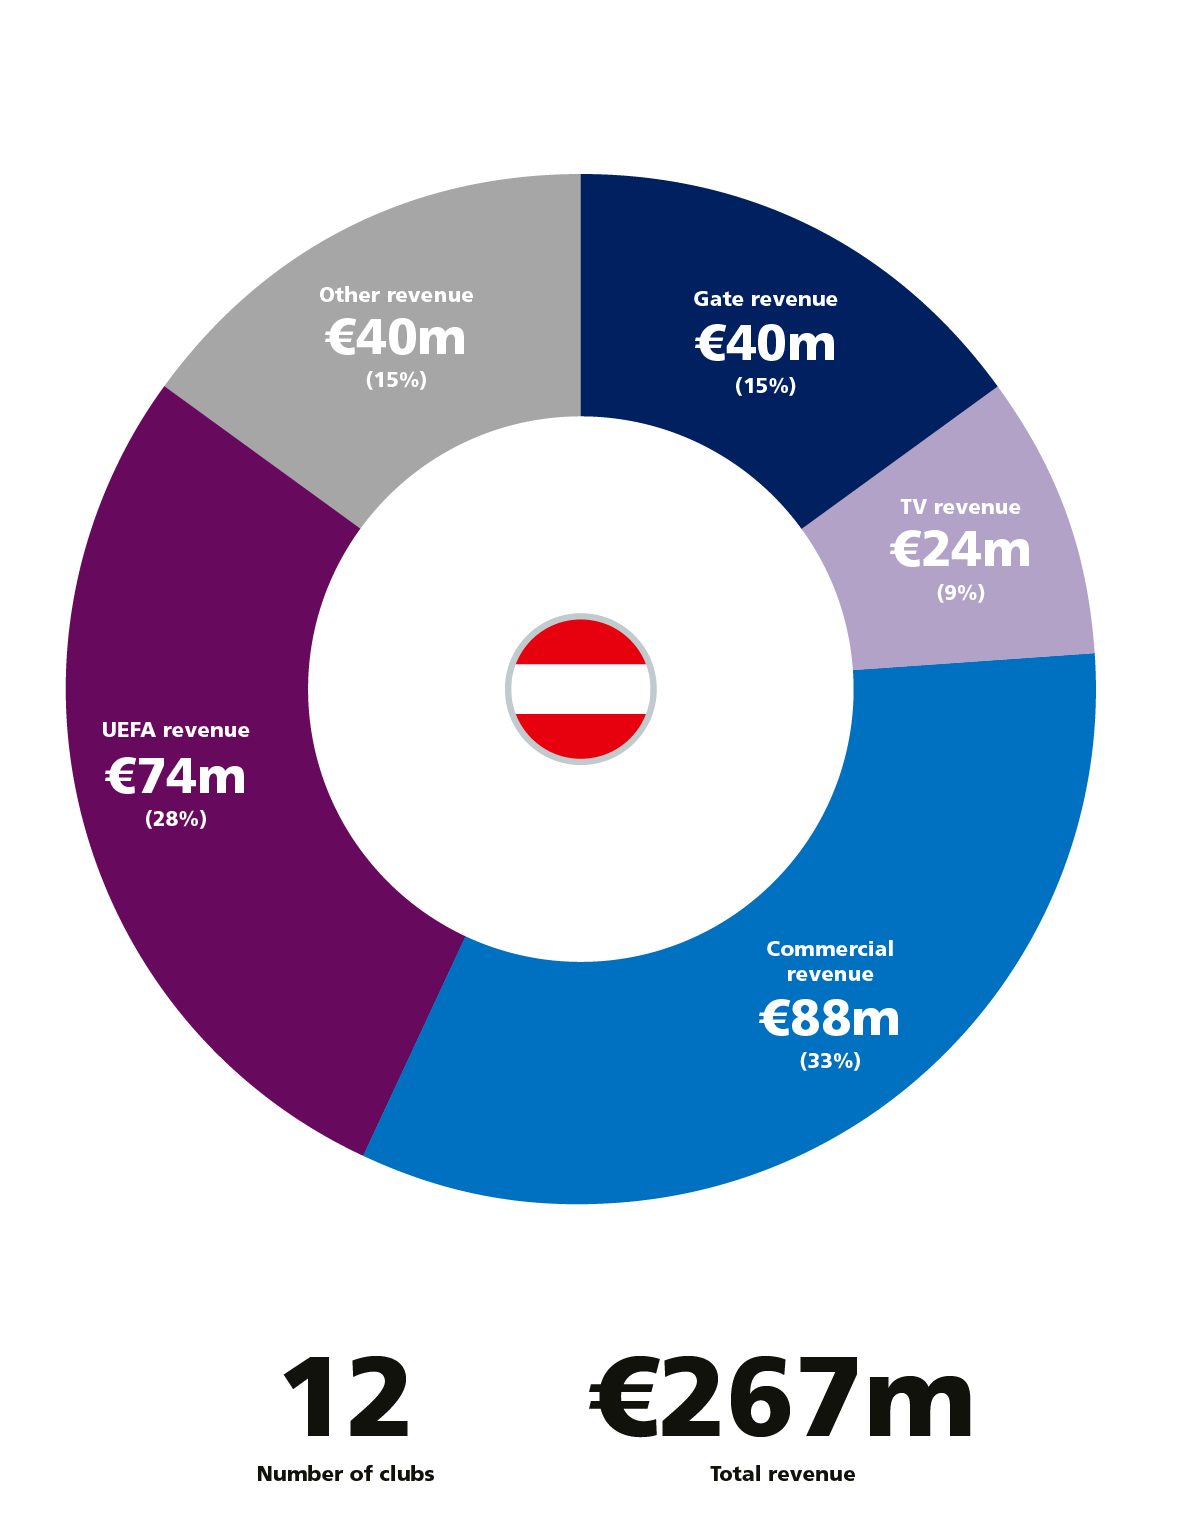
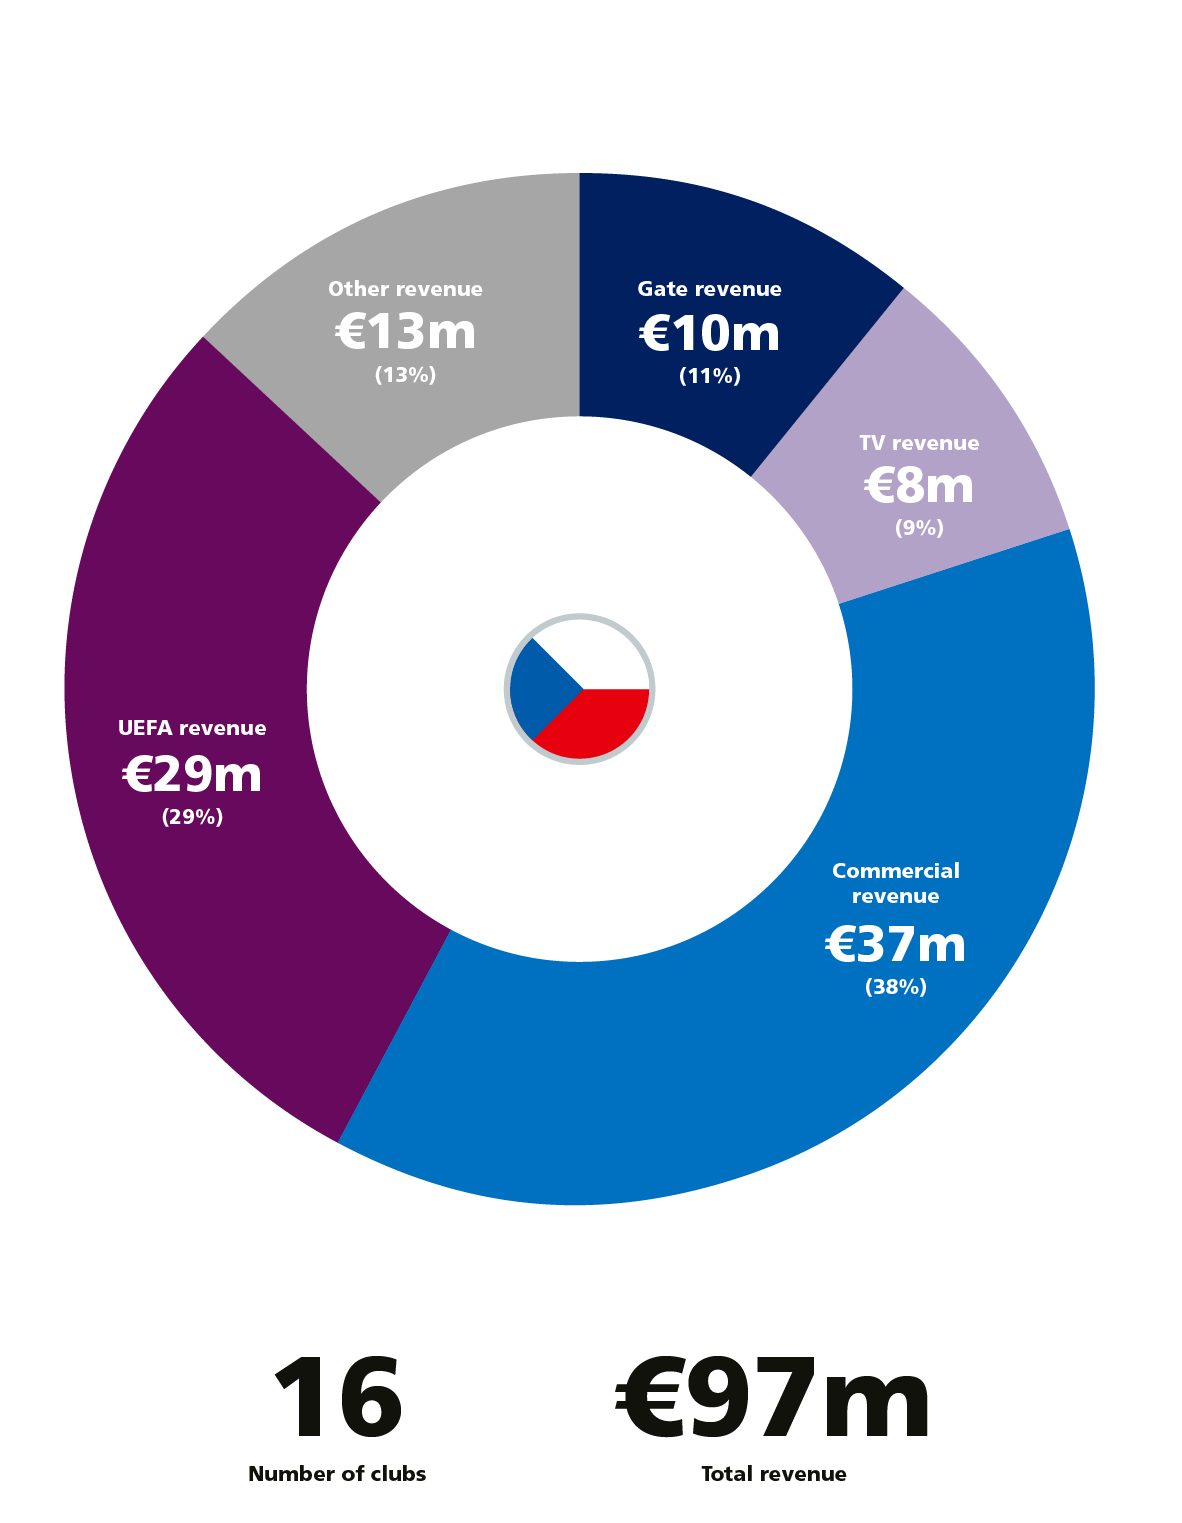
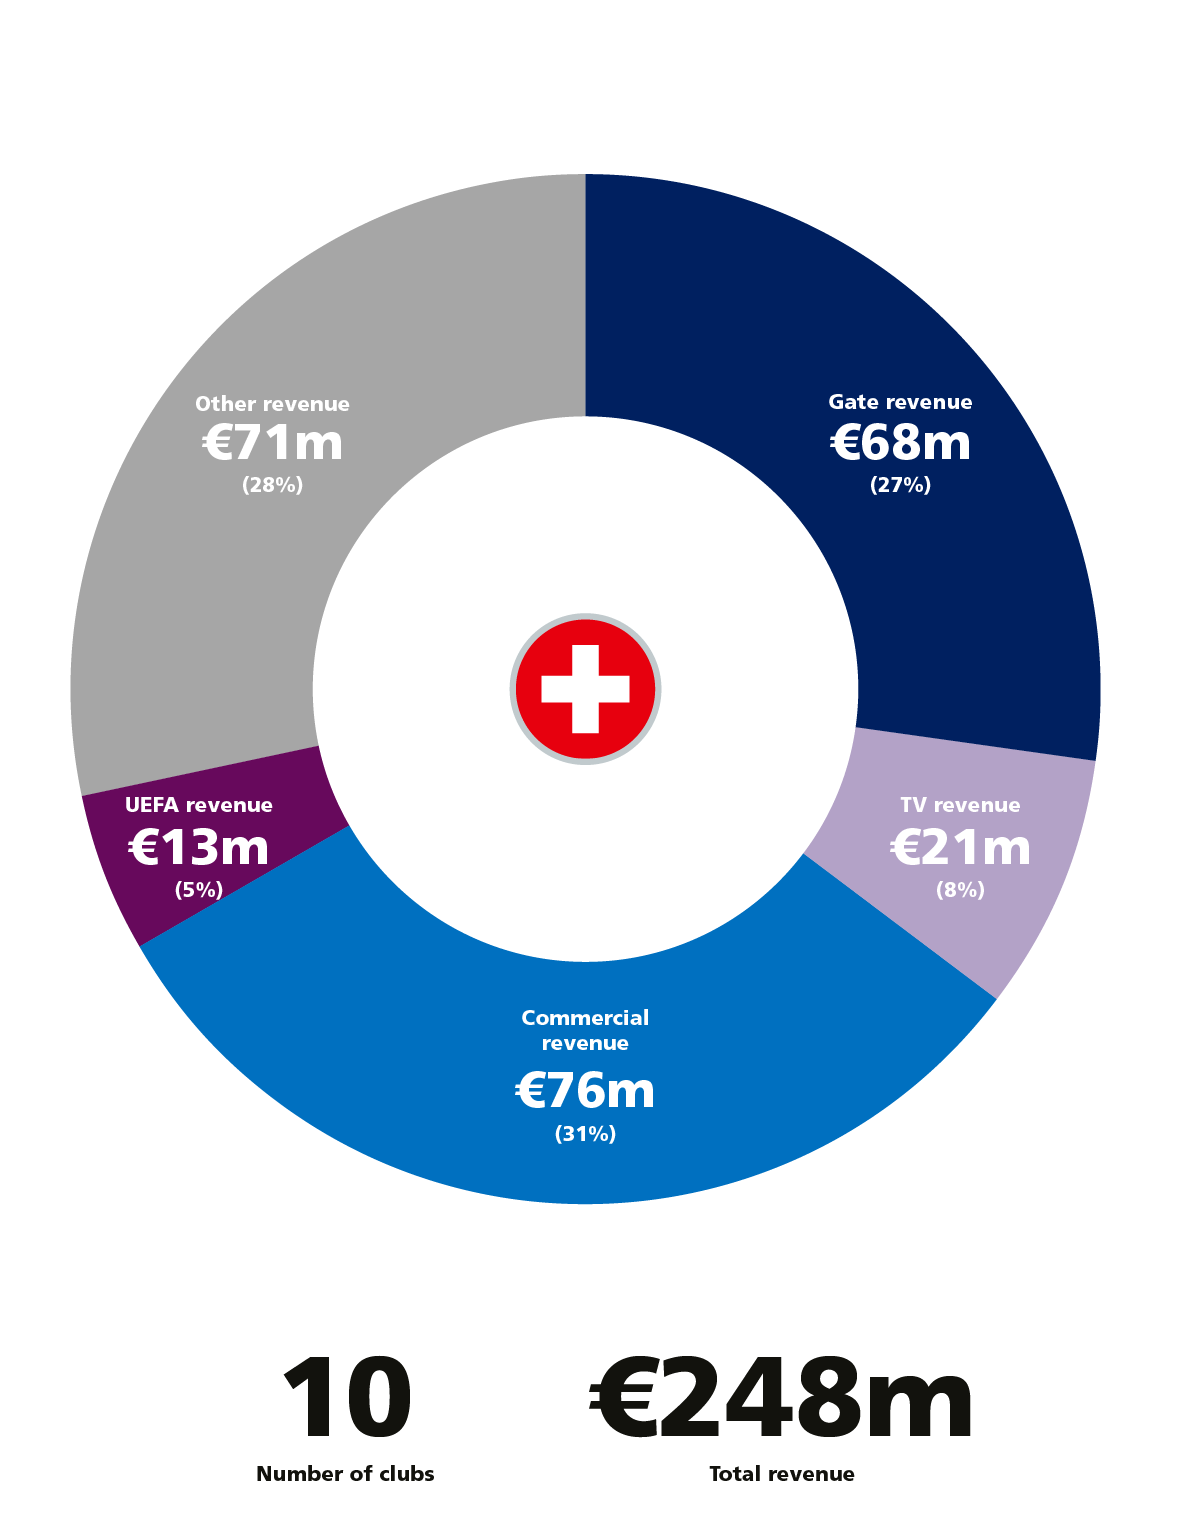
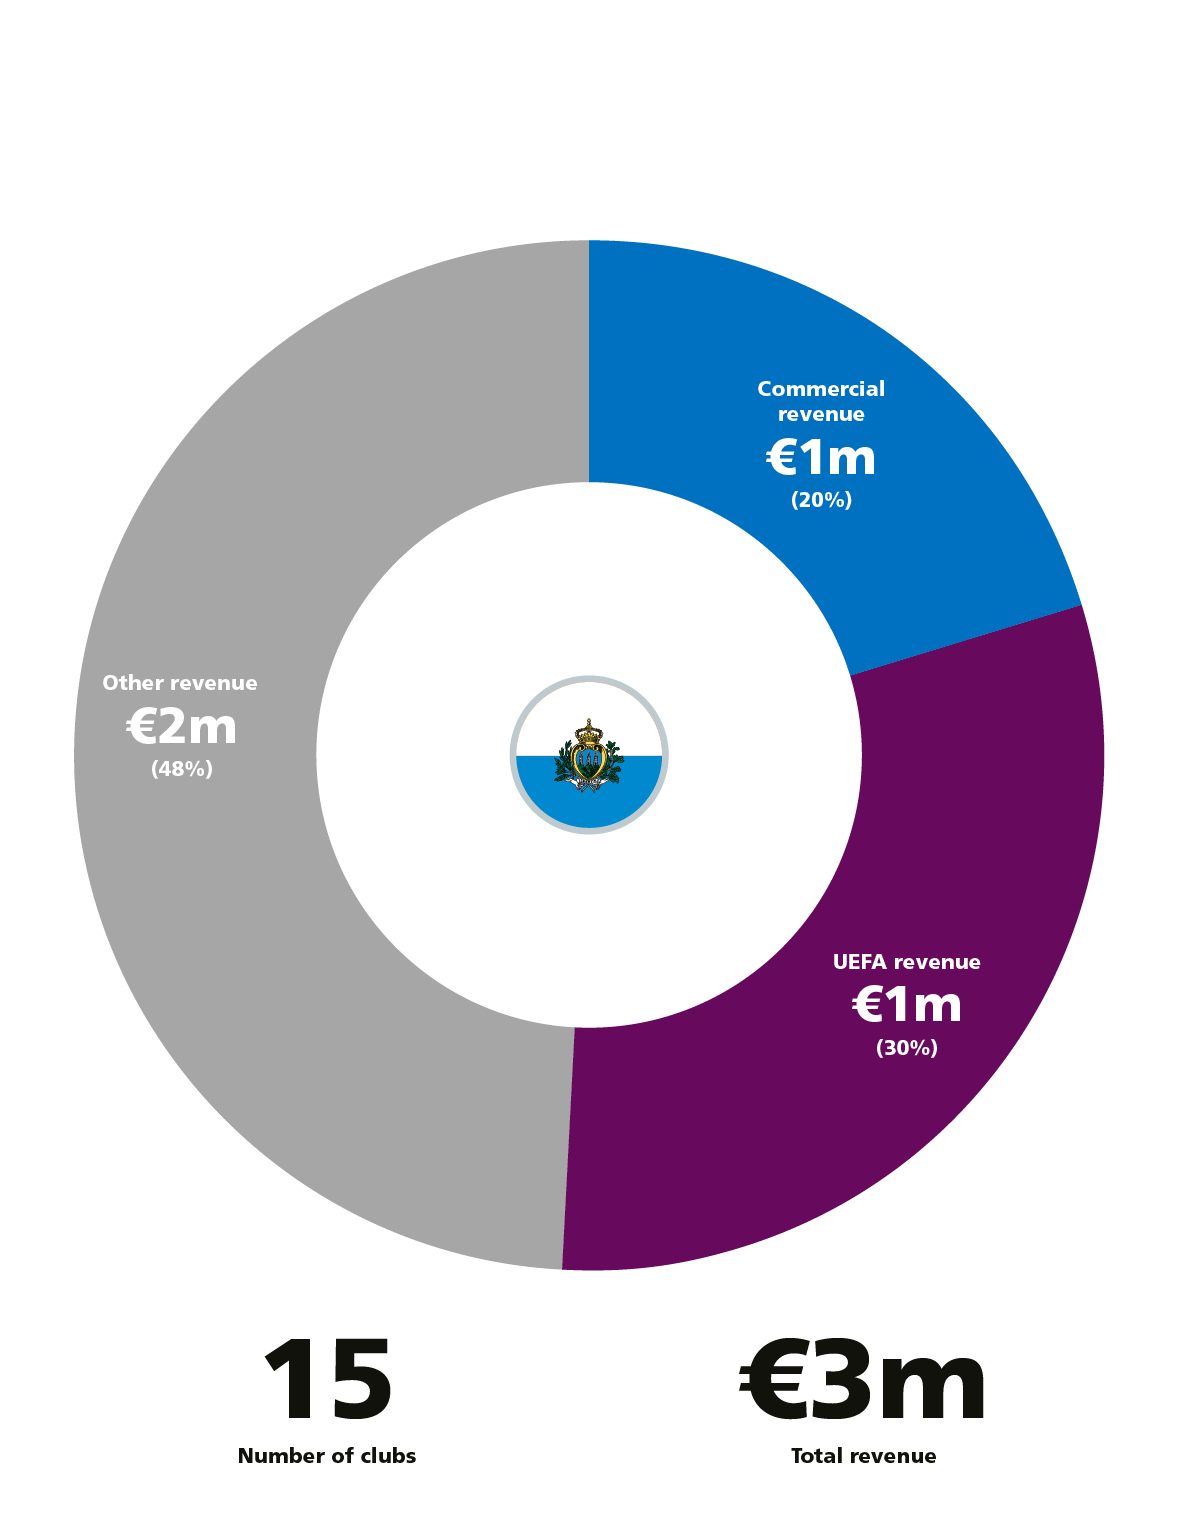
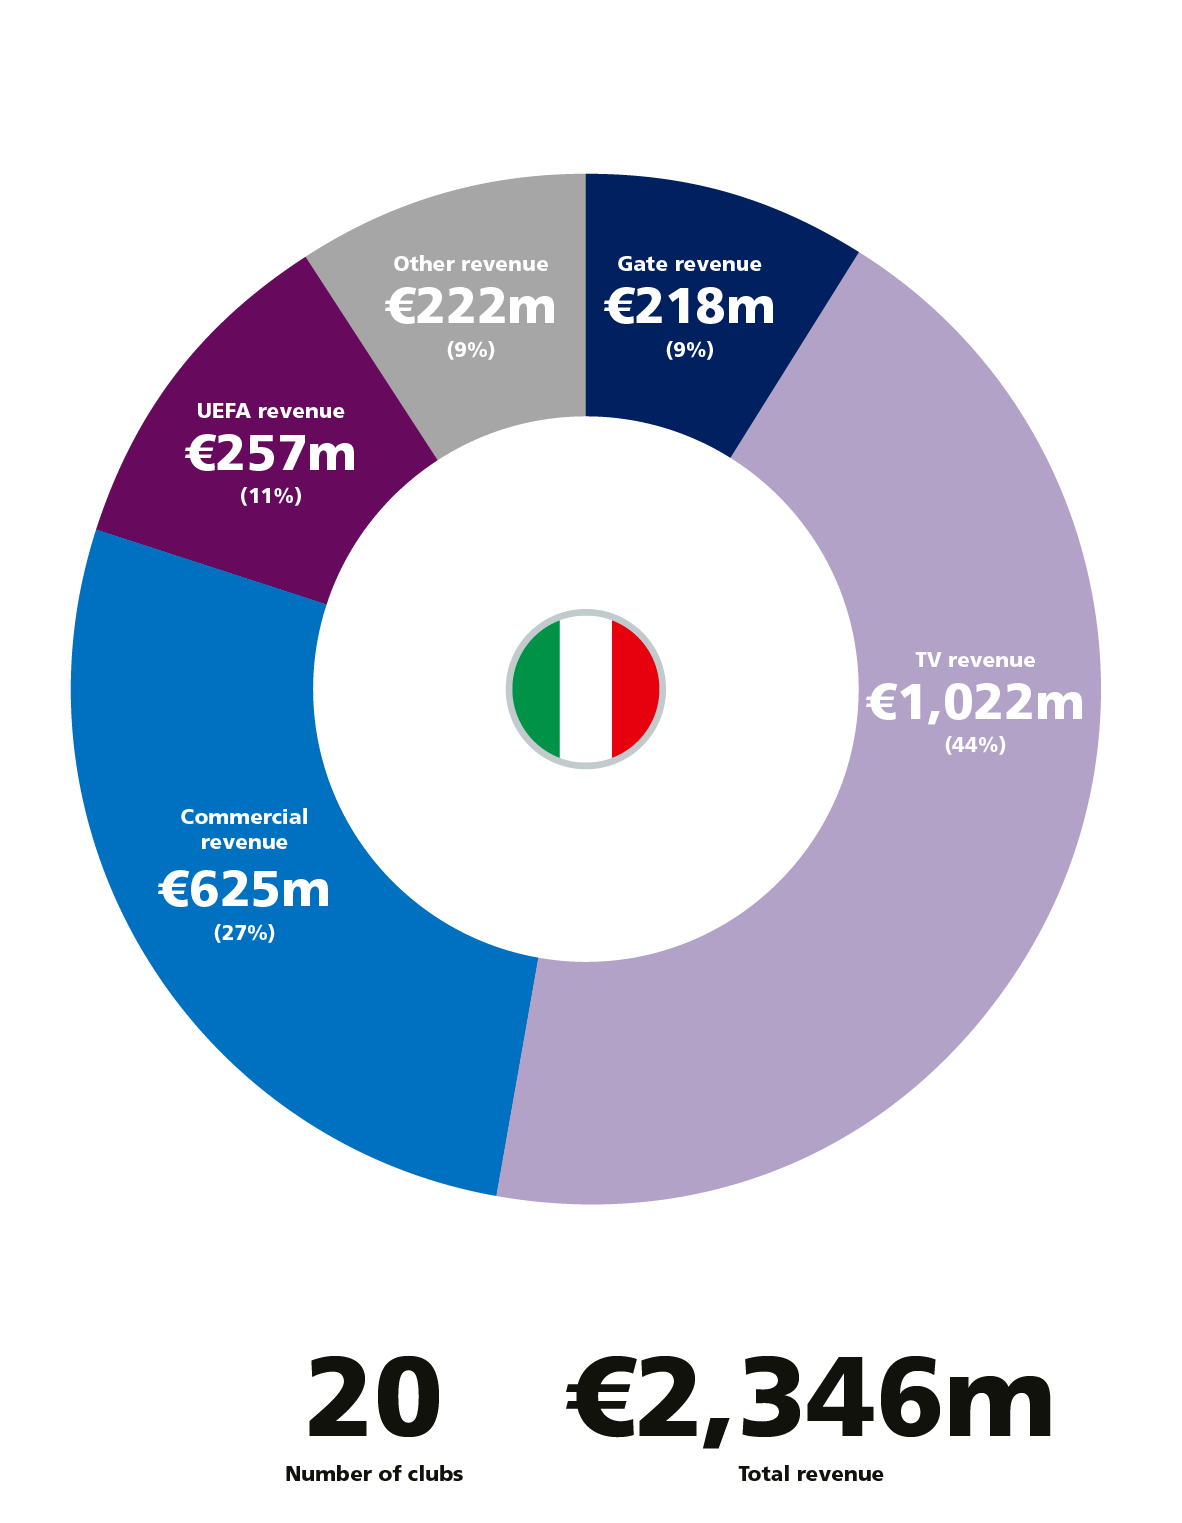
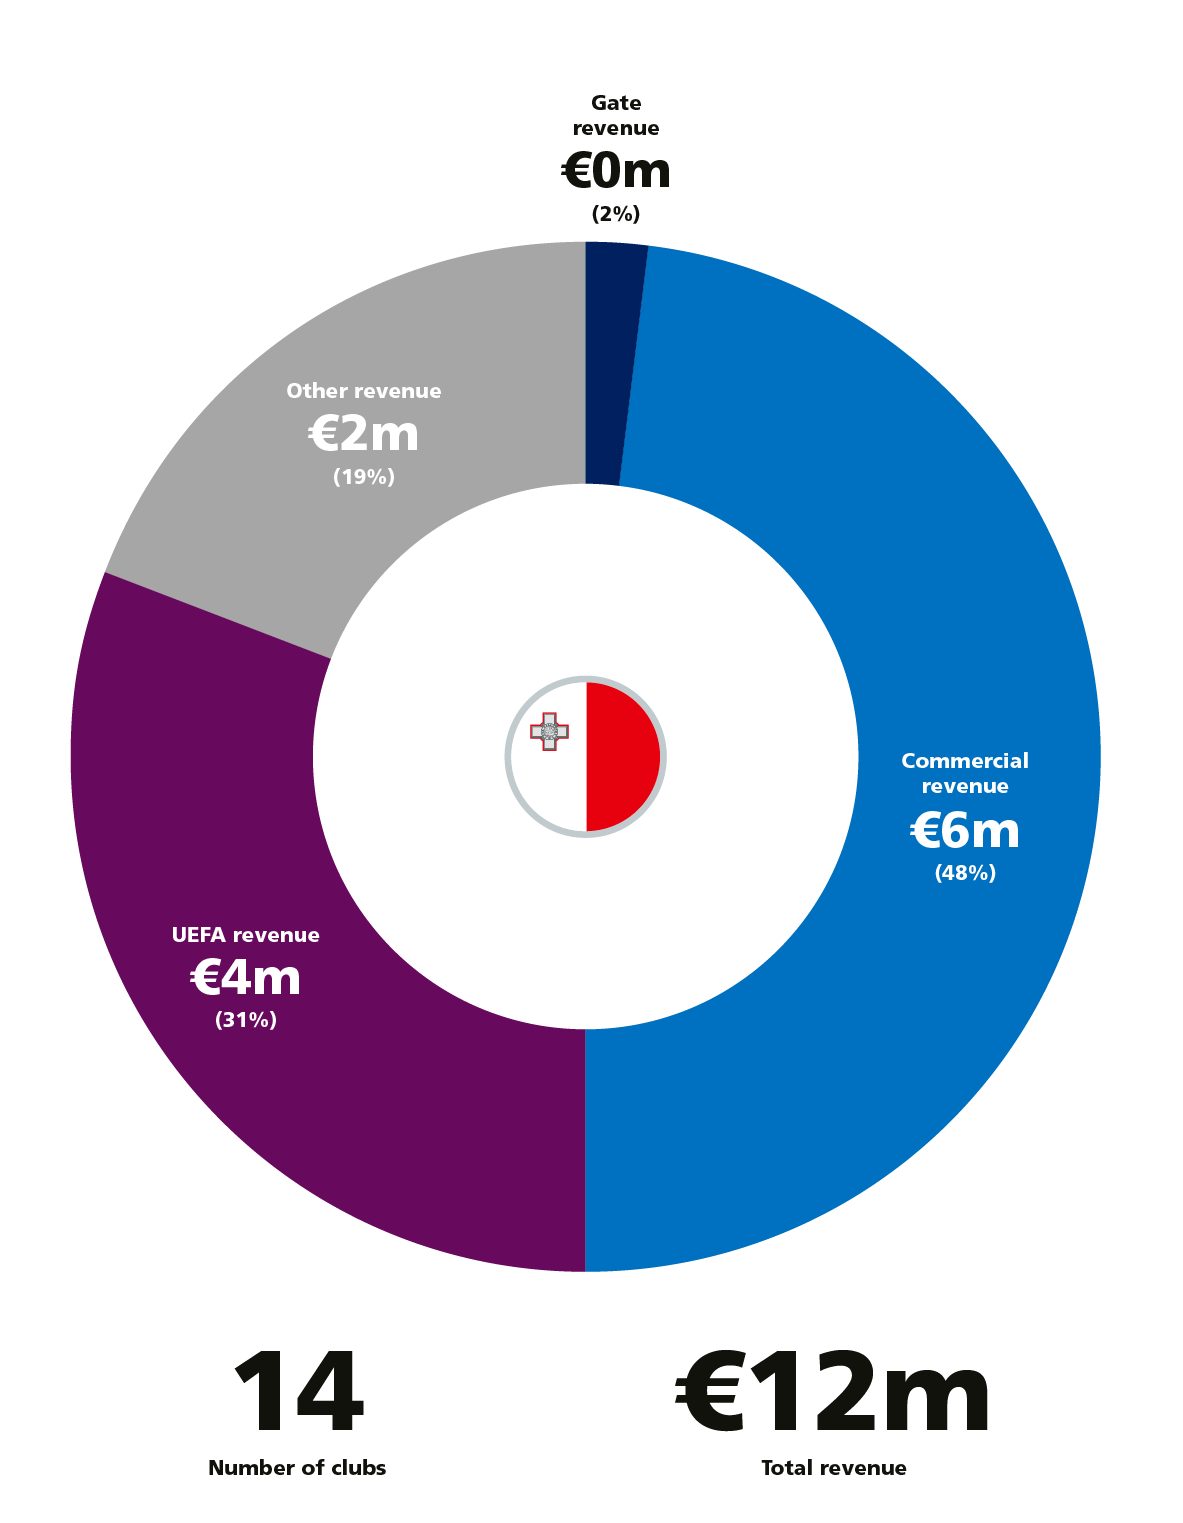
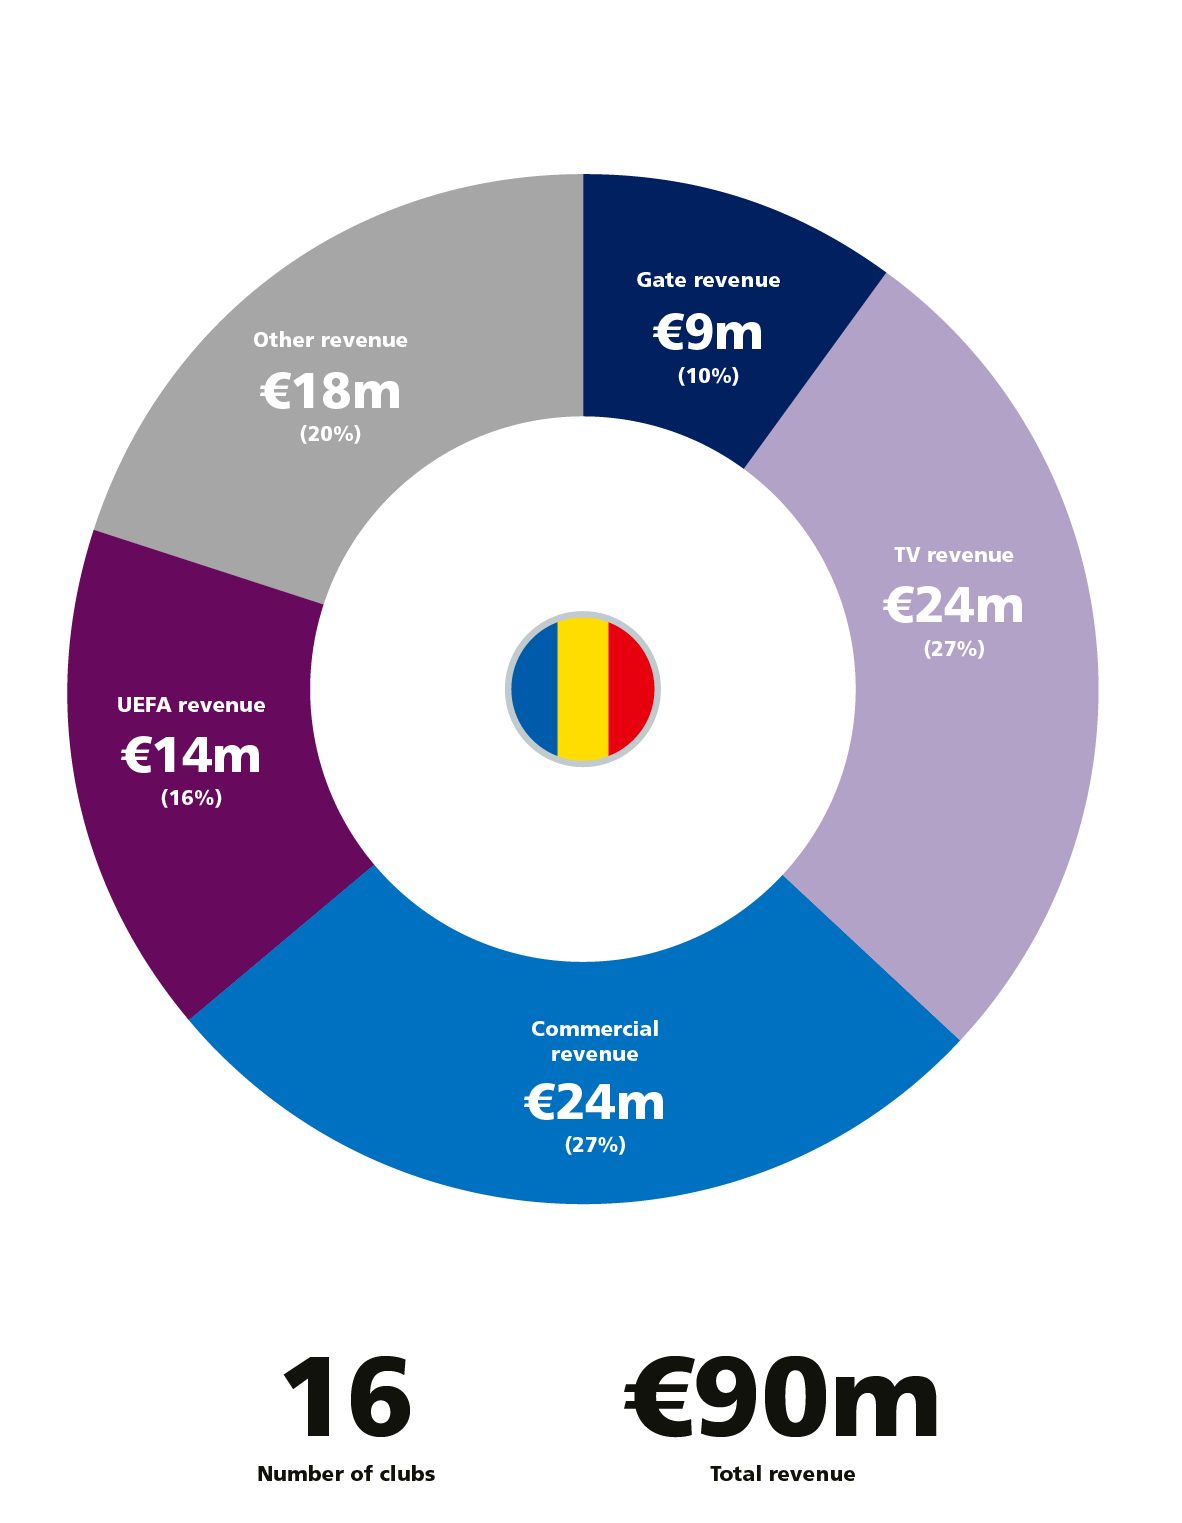
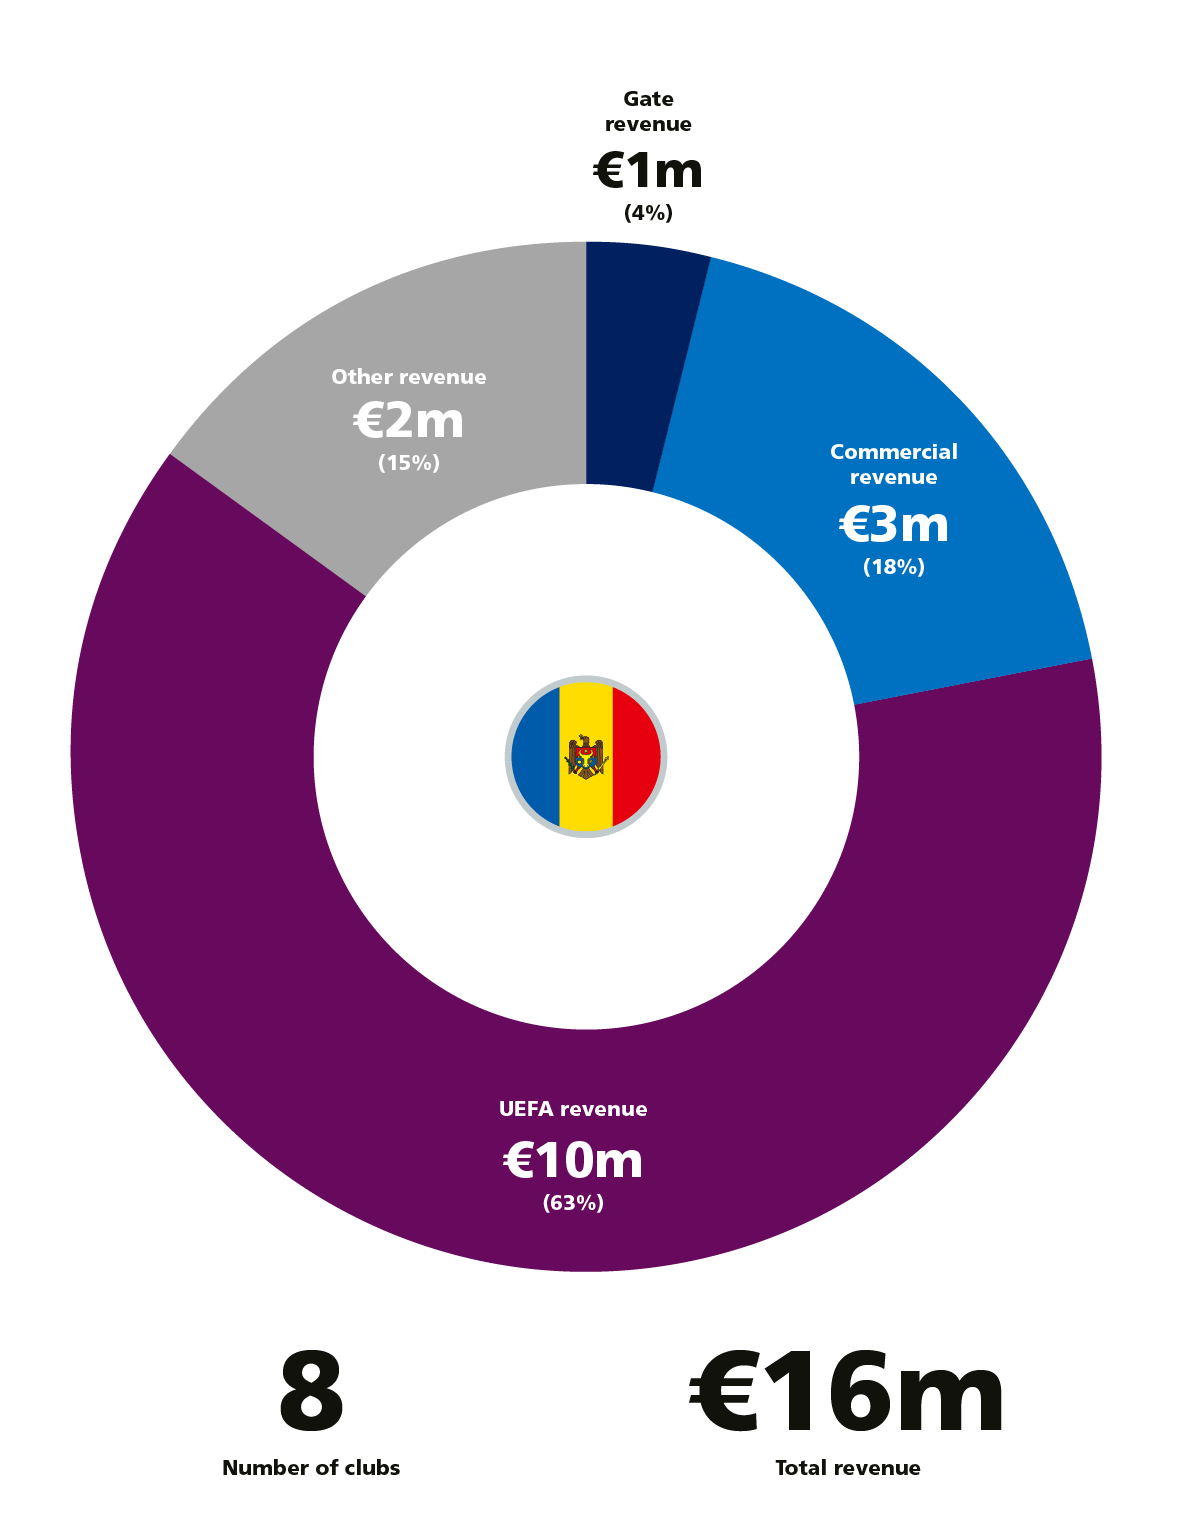
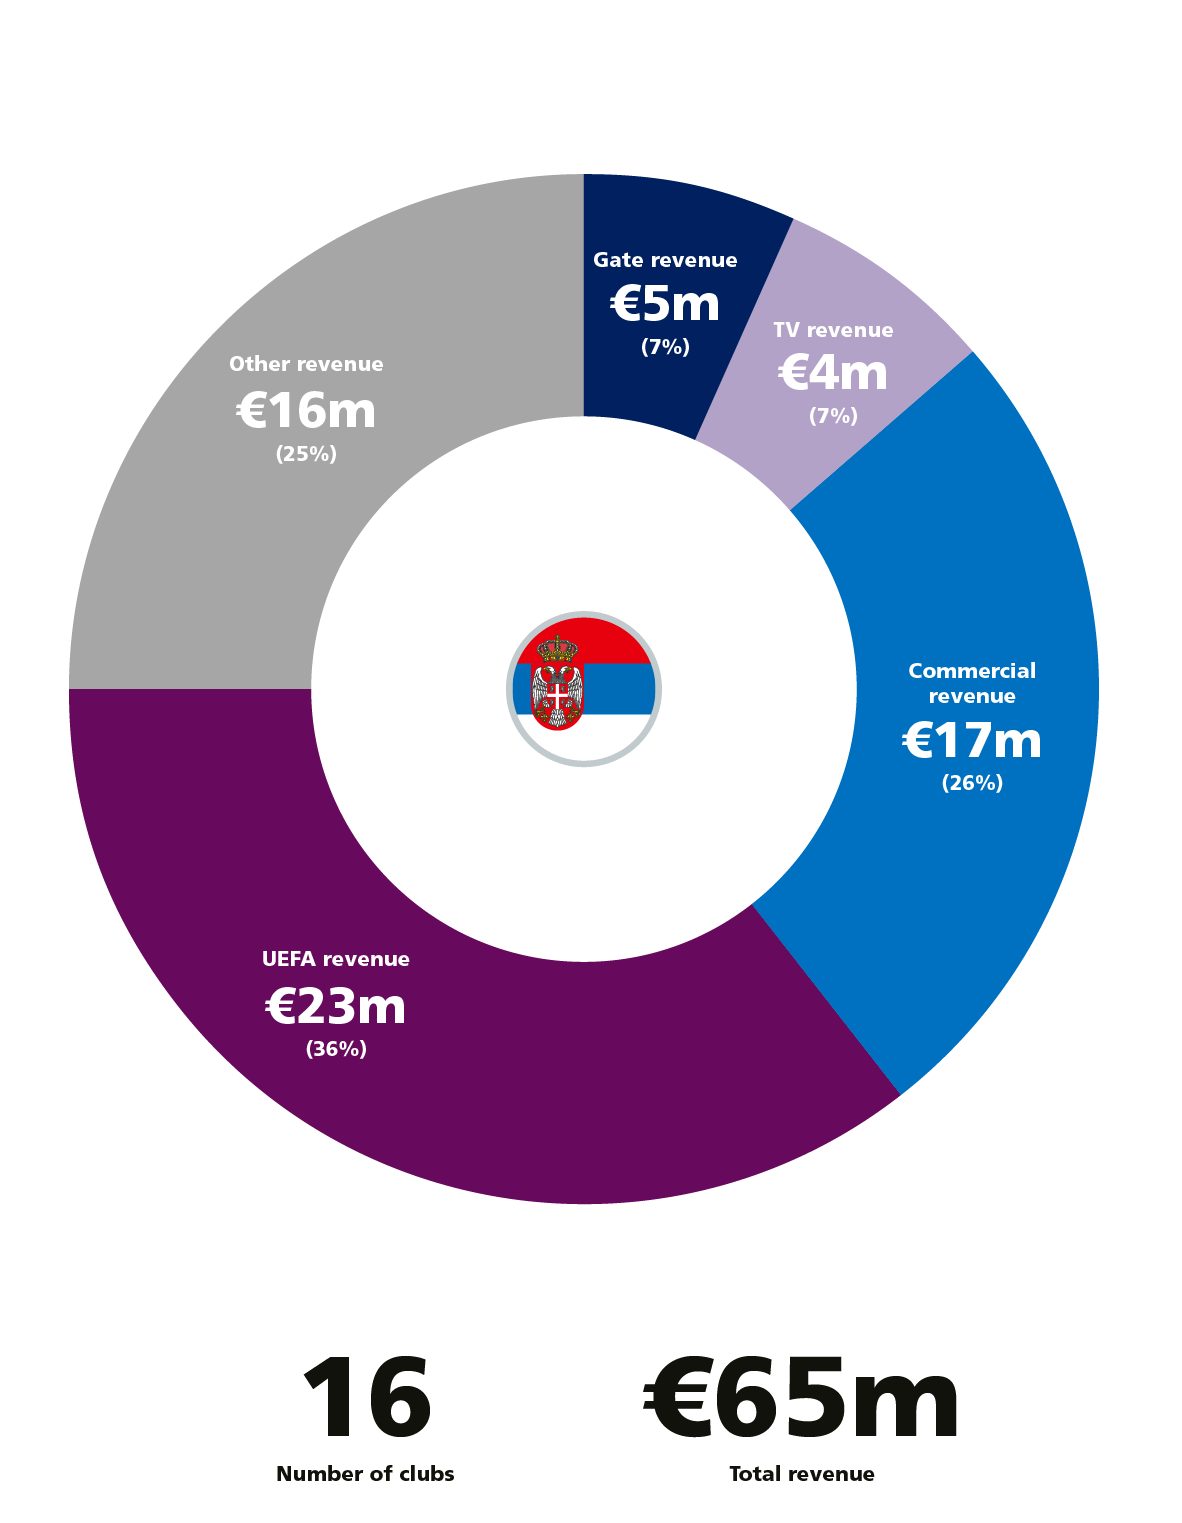
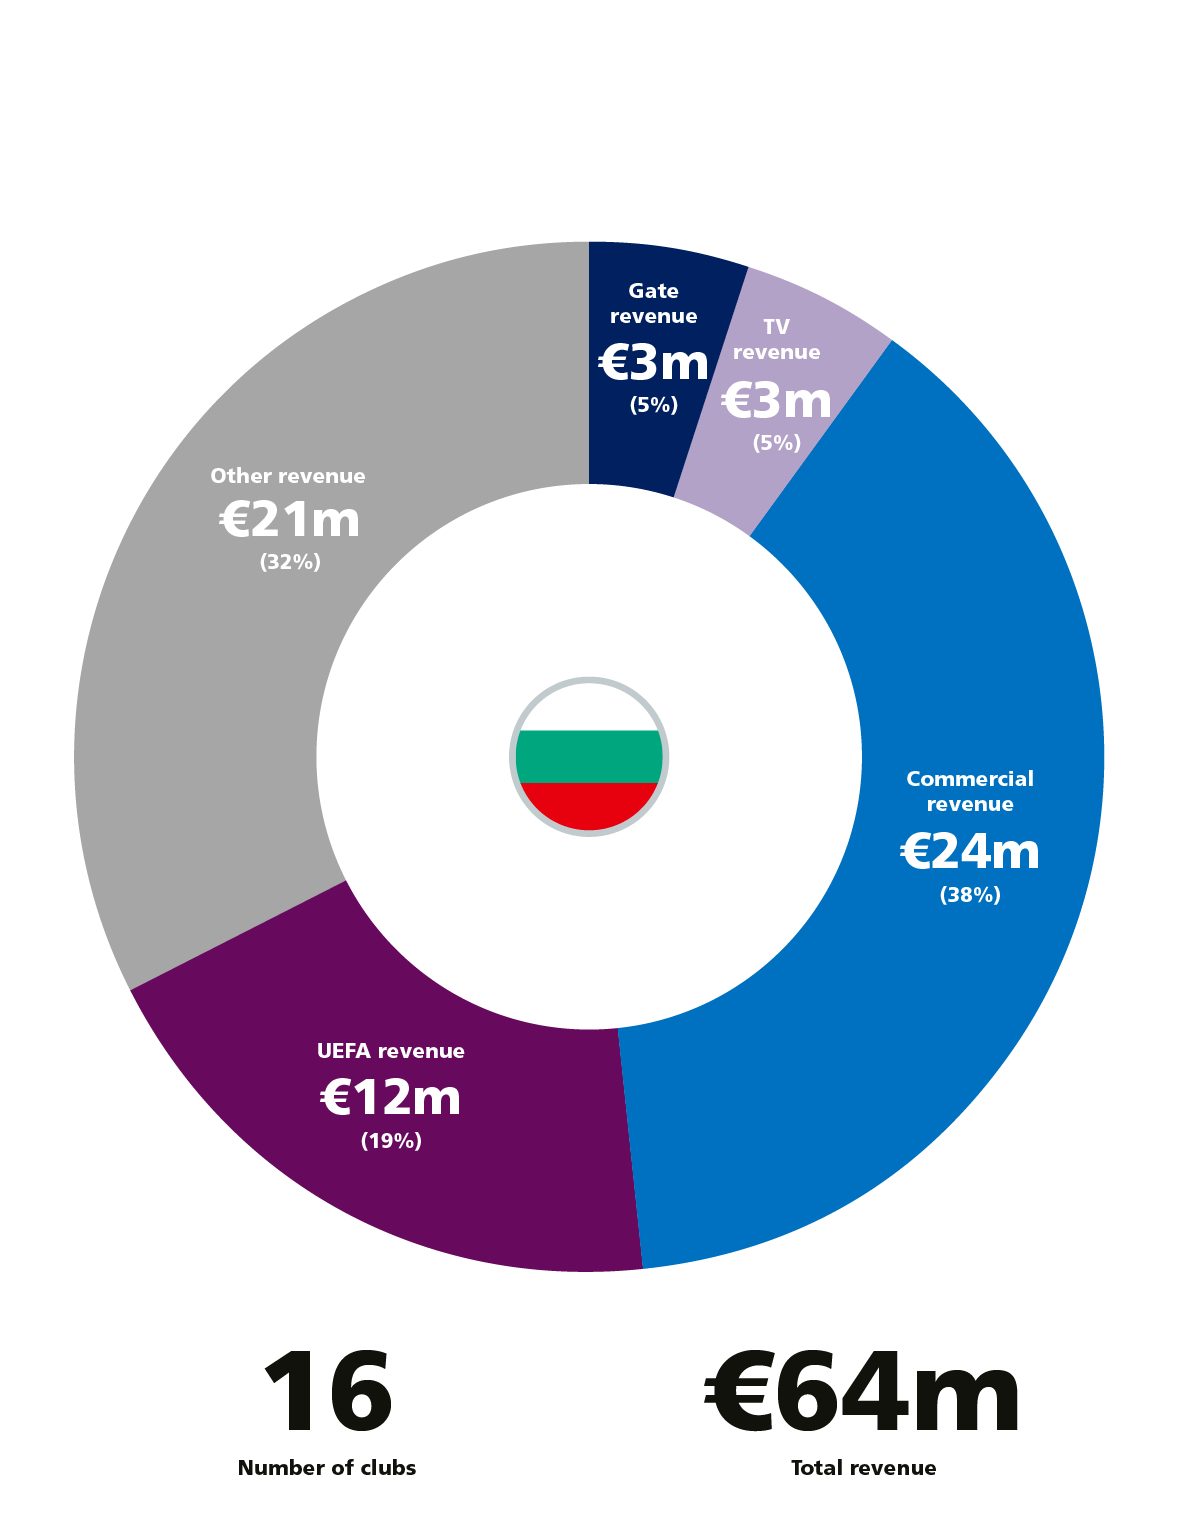
The report provides a country by country overview of where revenue is generated from, as well as country rankings.
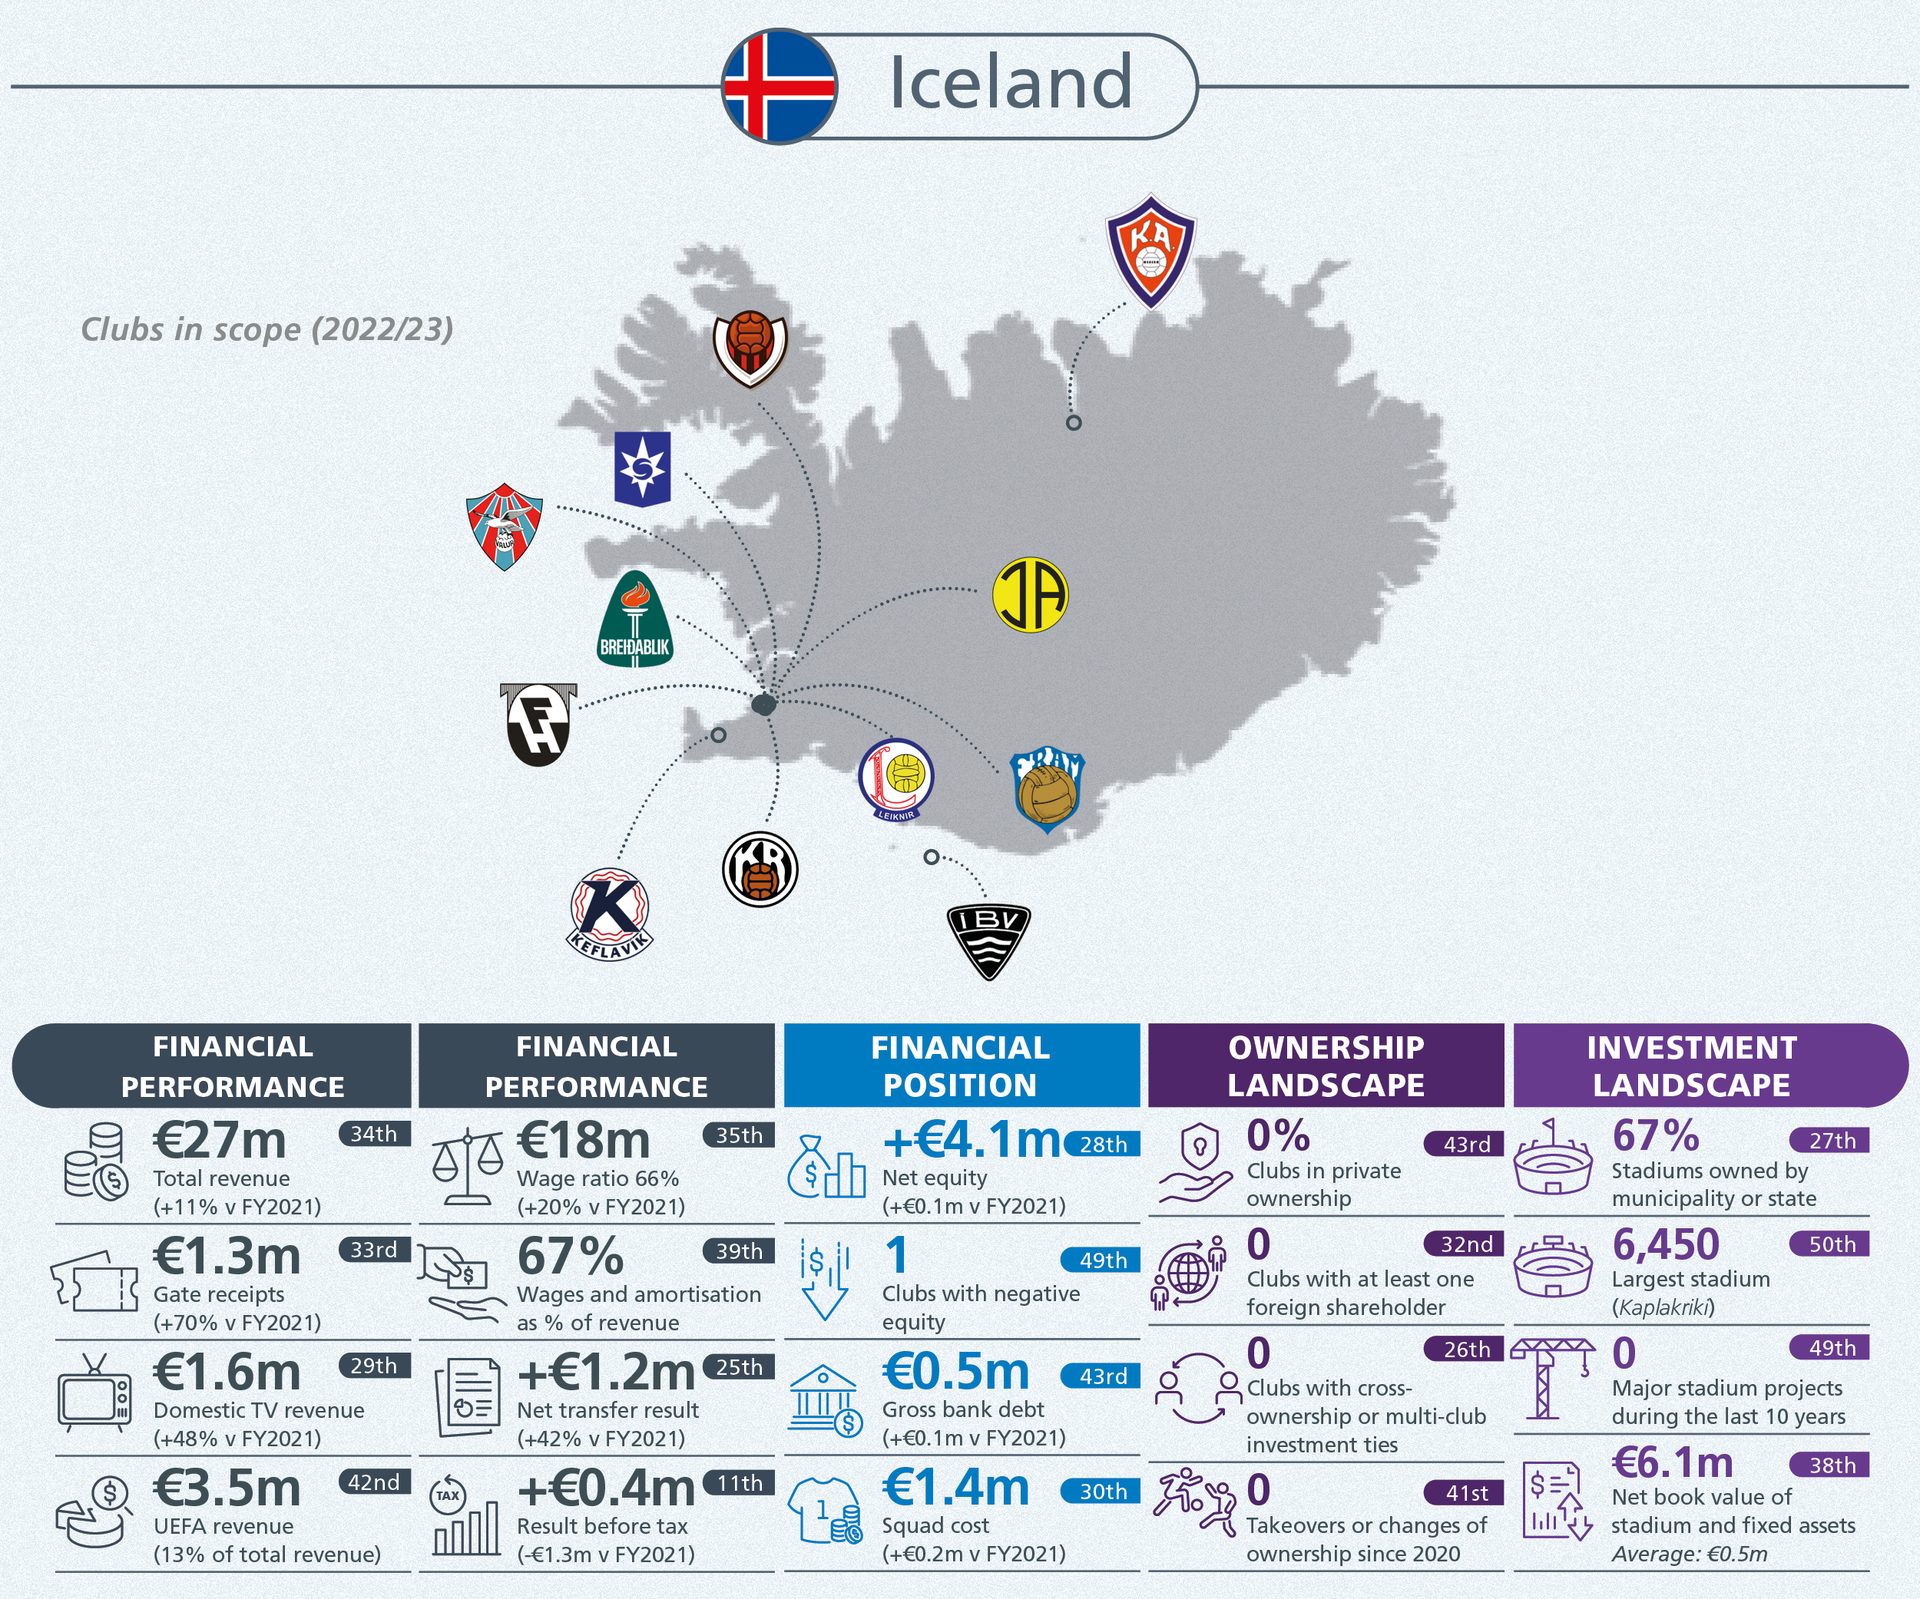
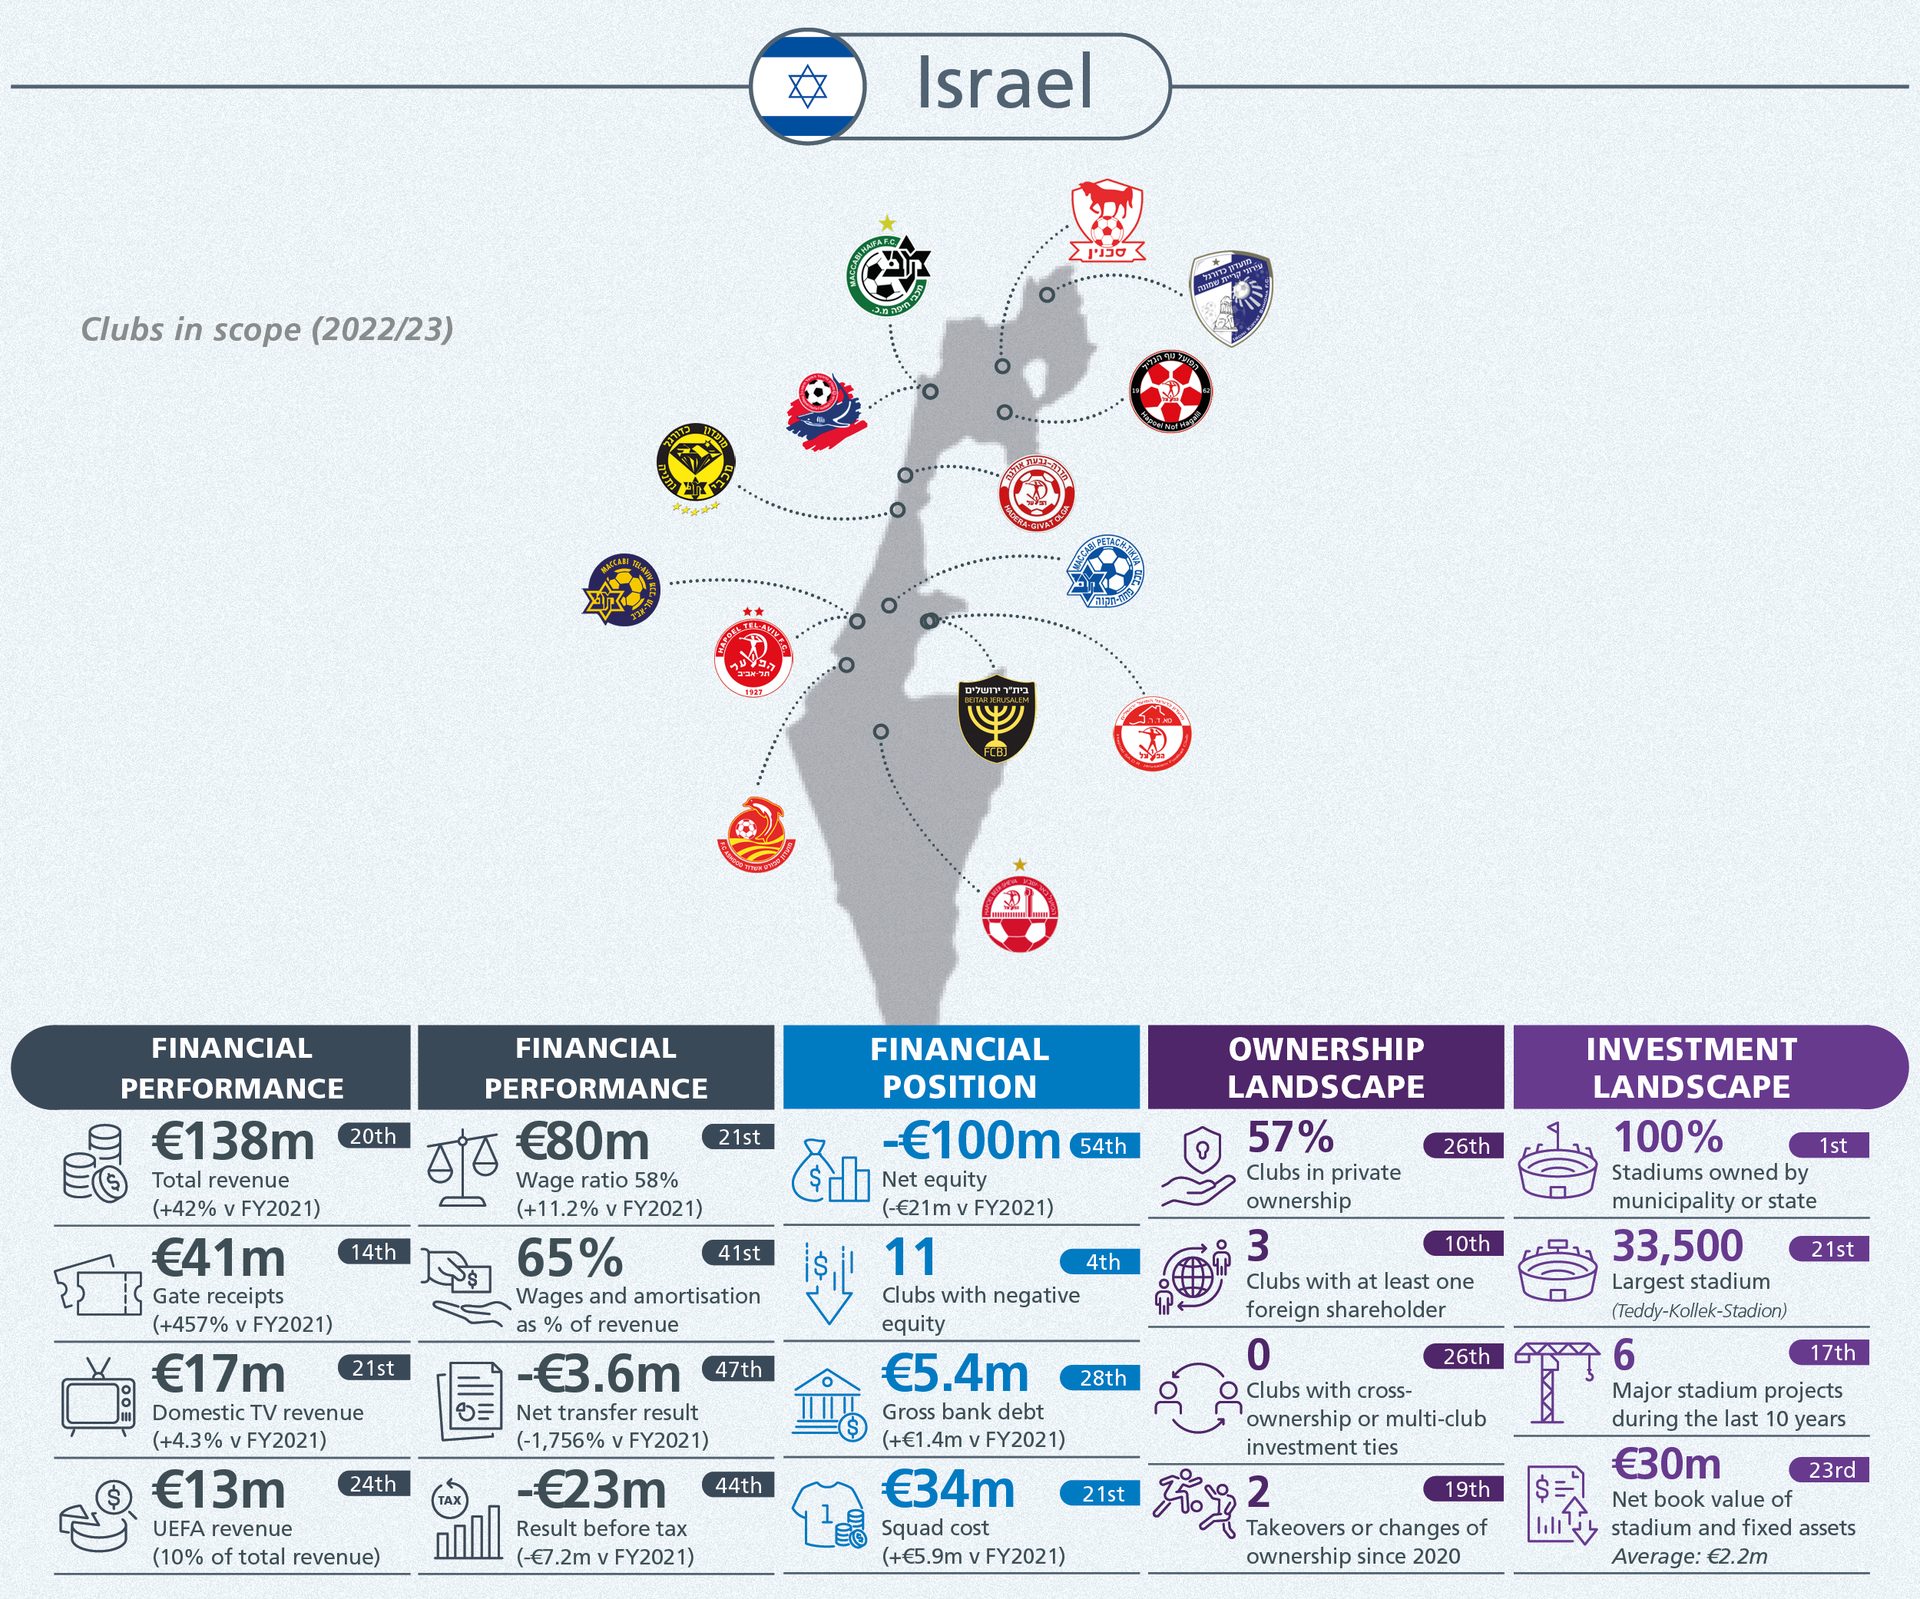
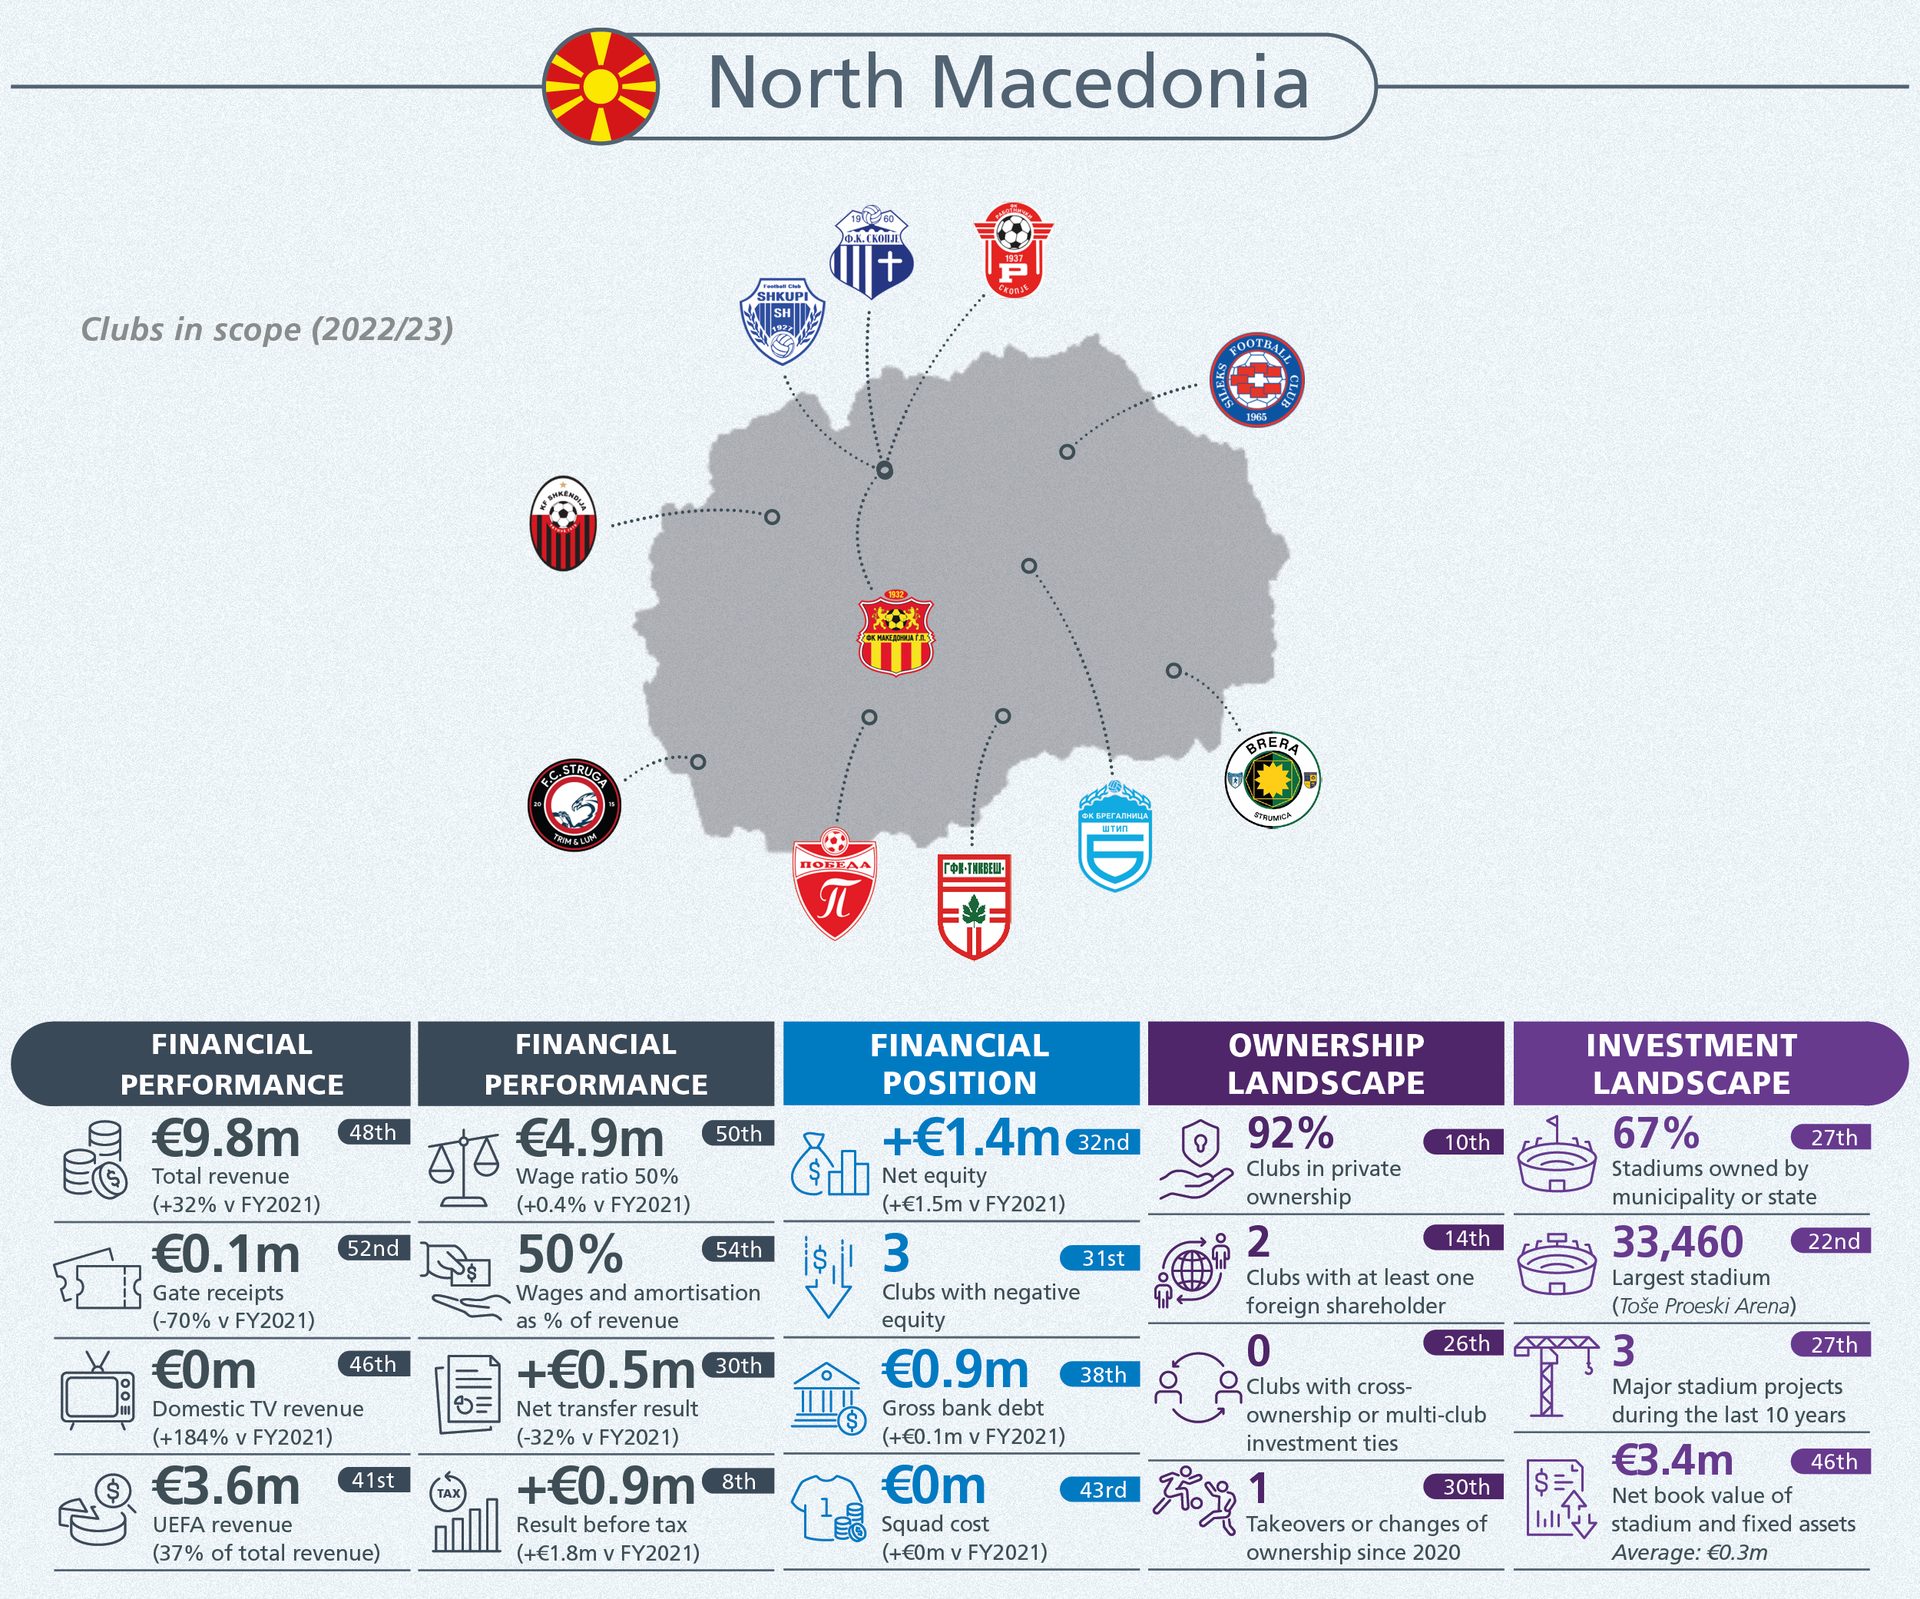
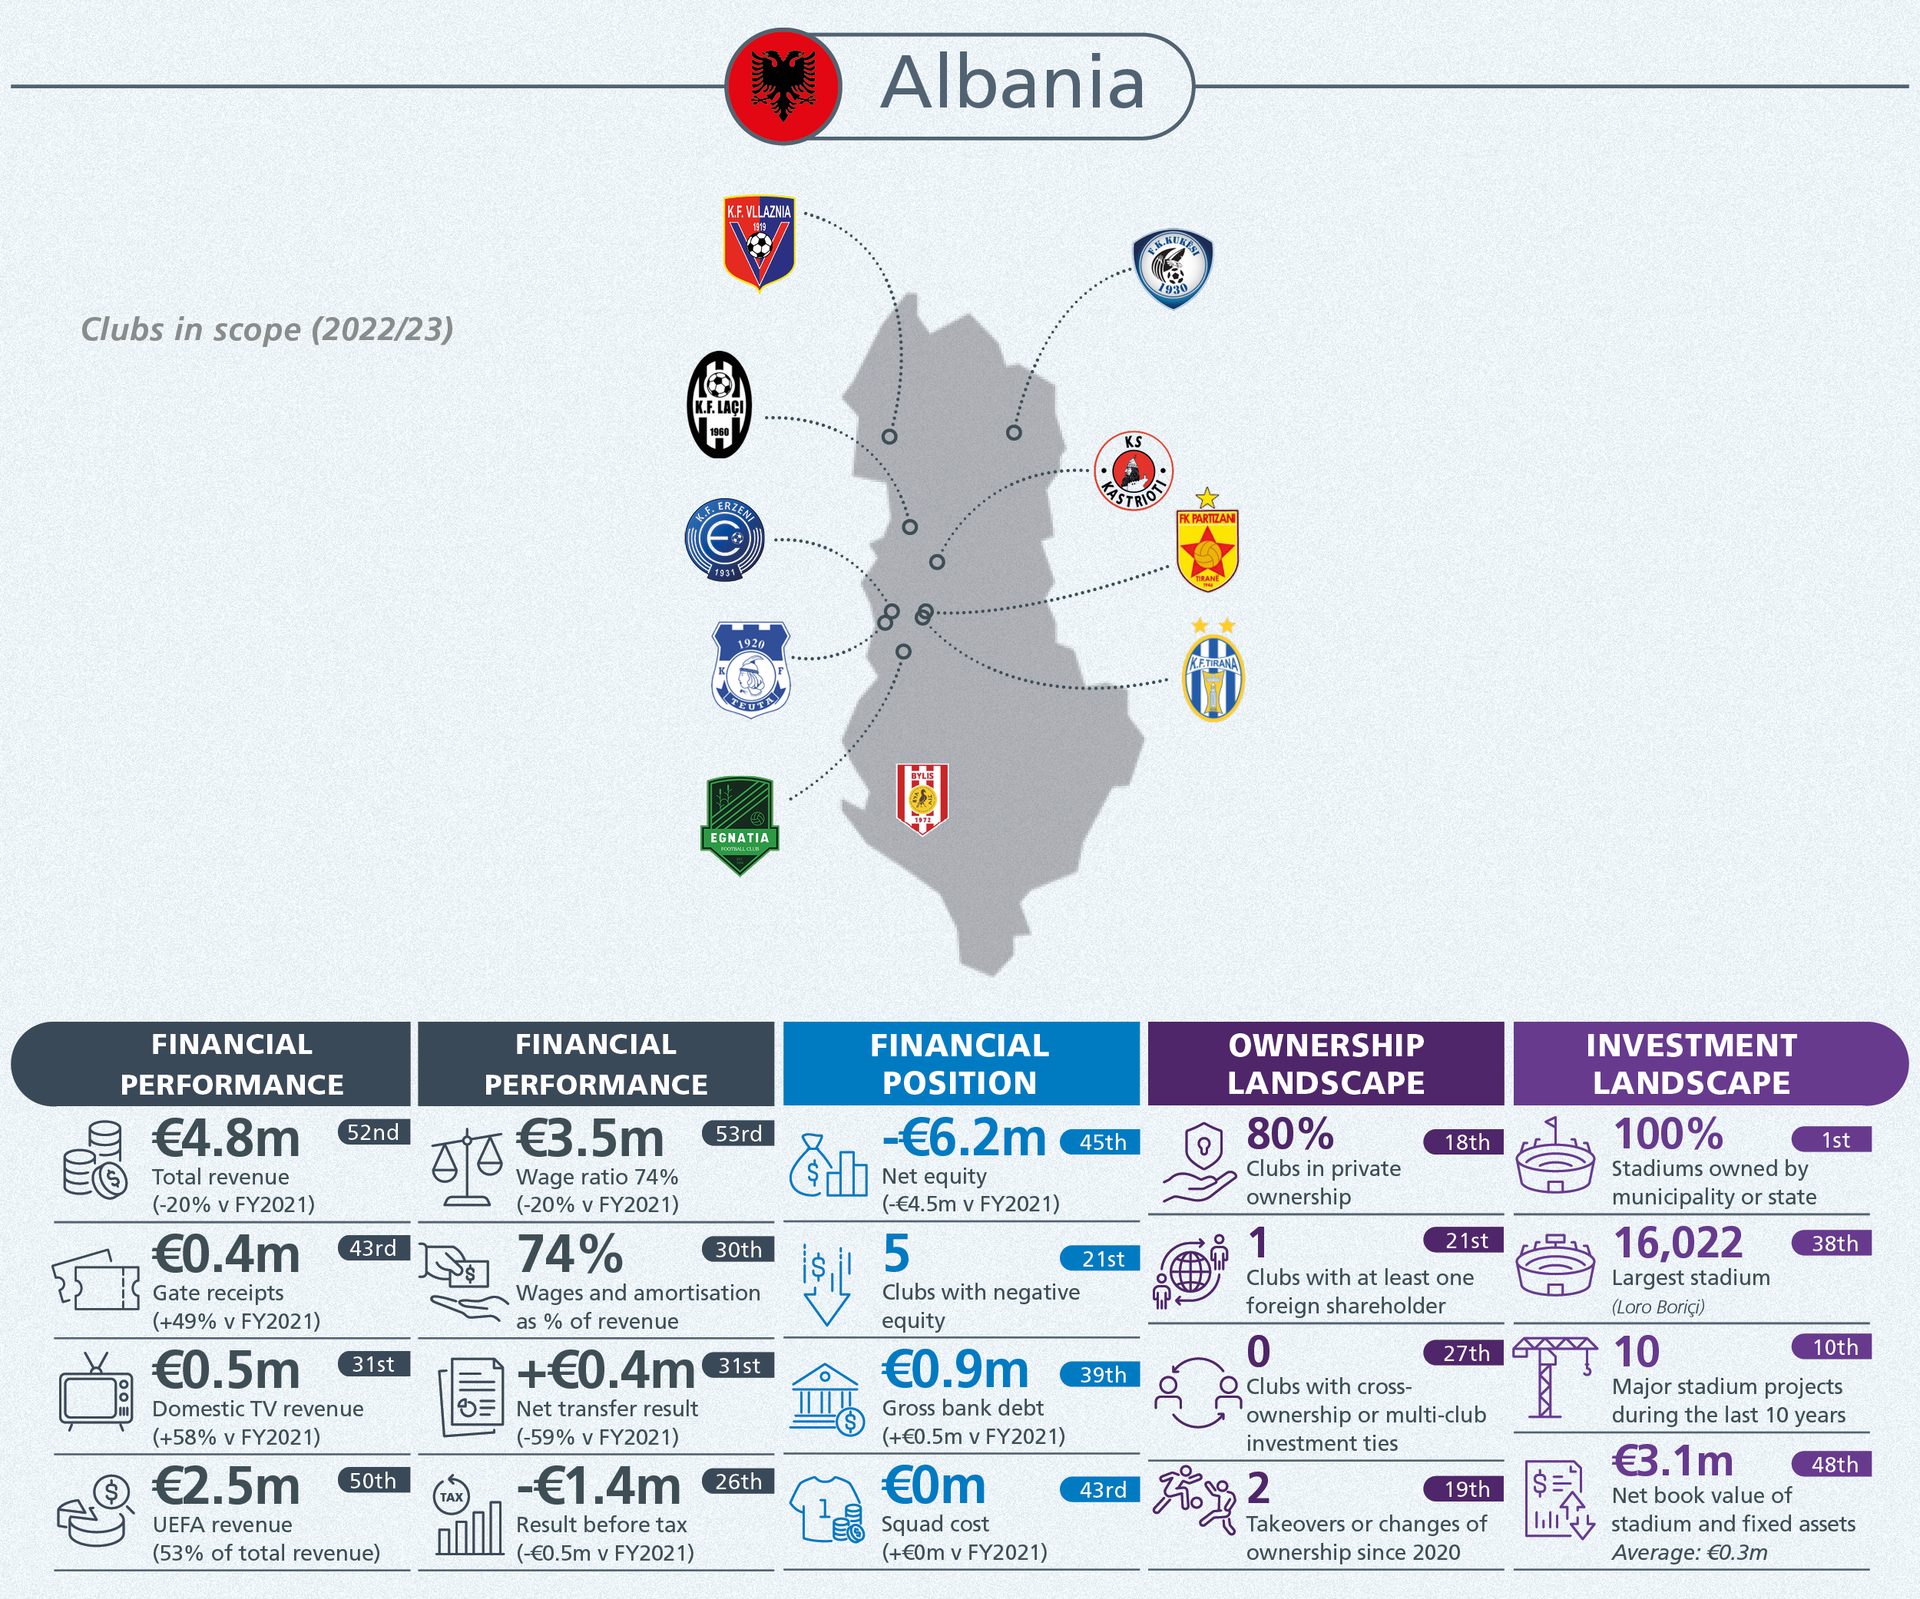
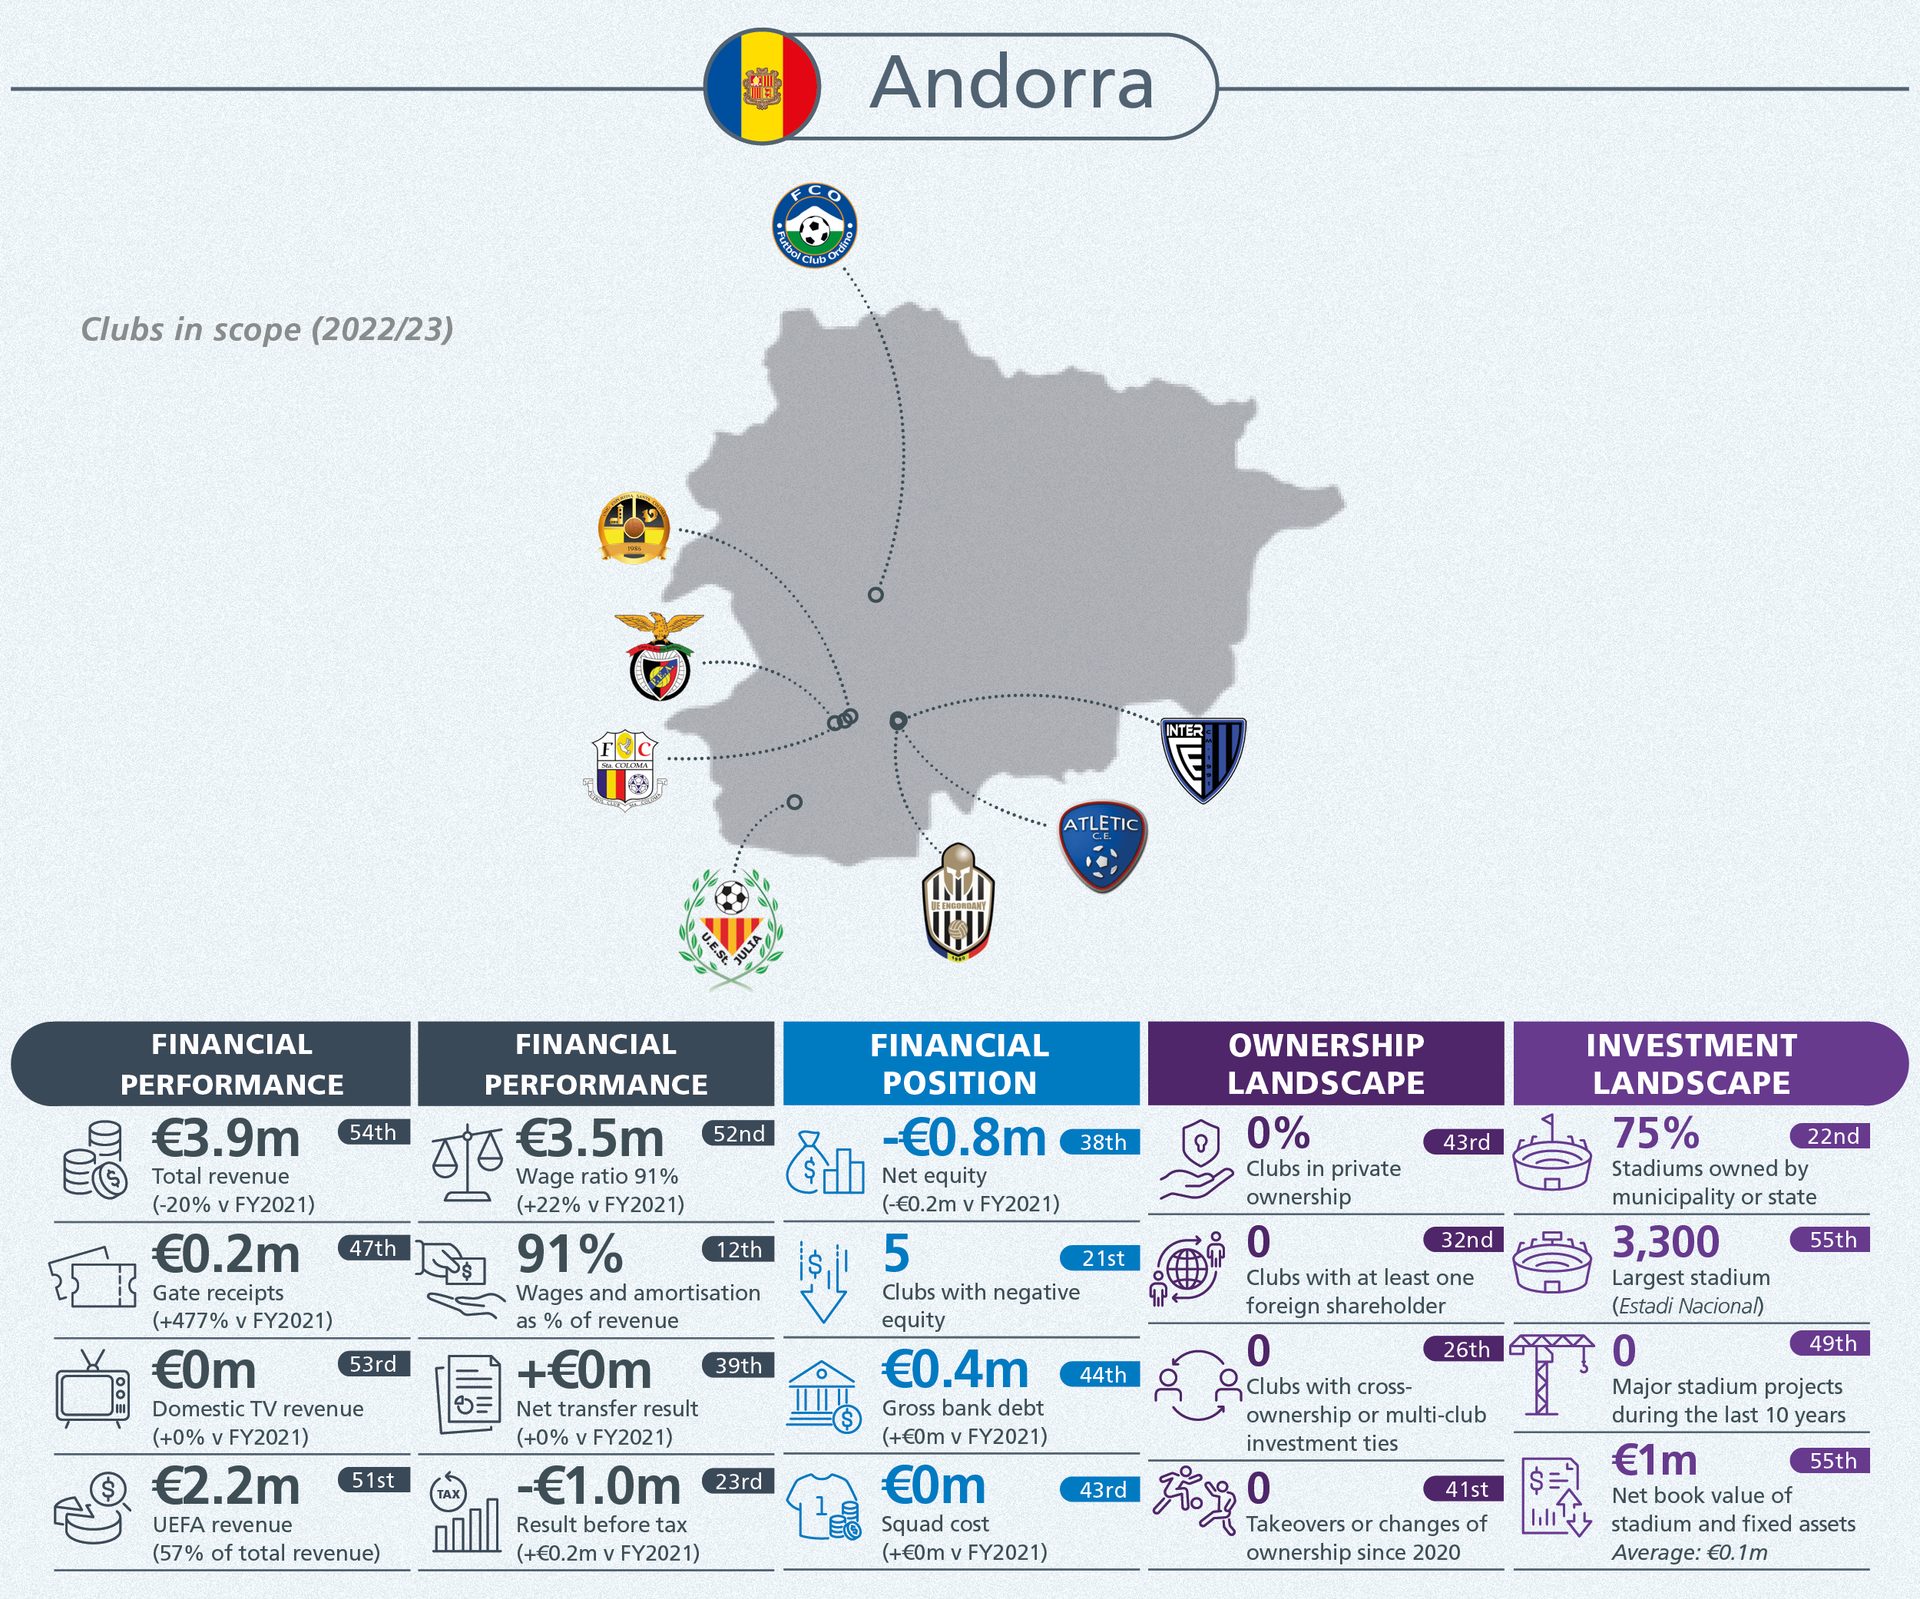
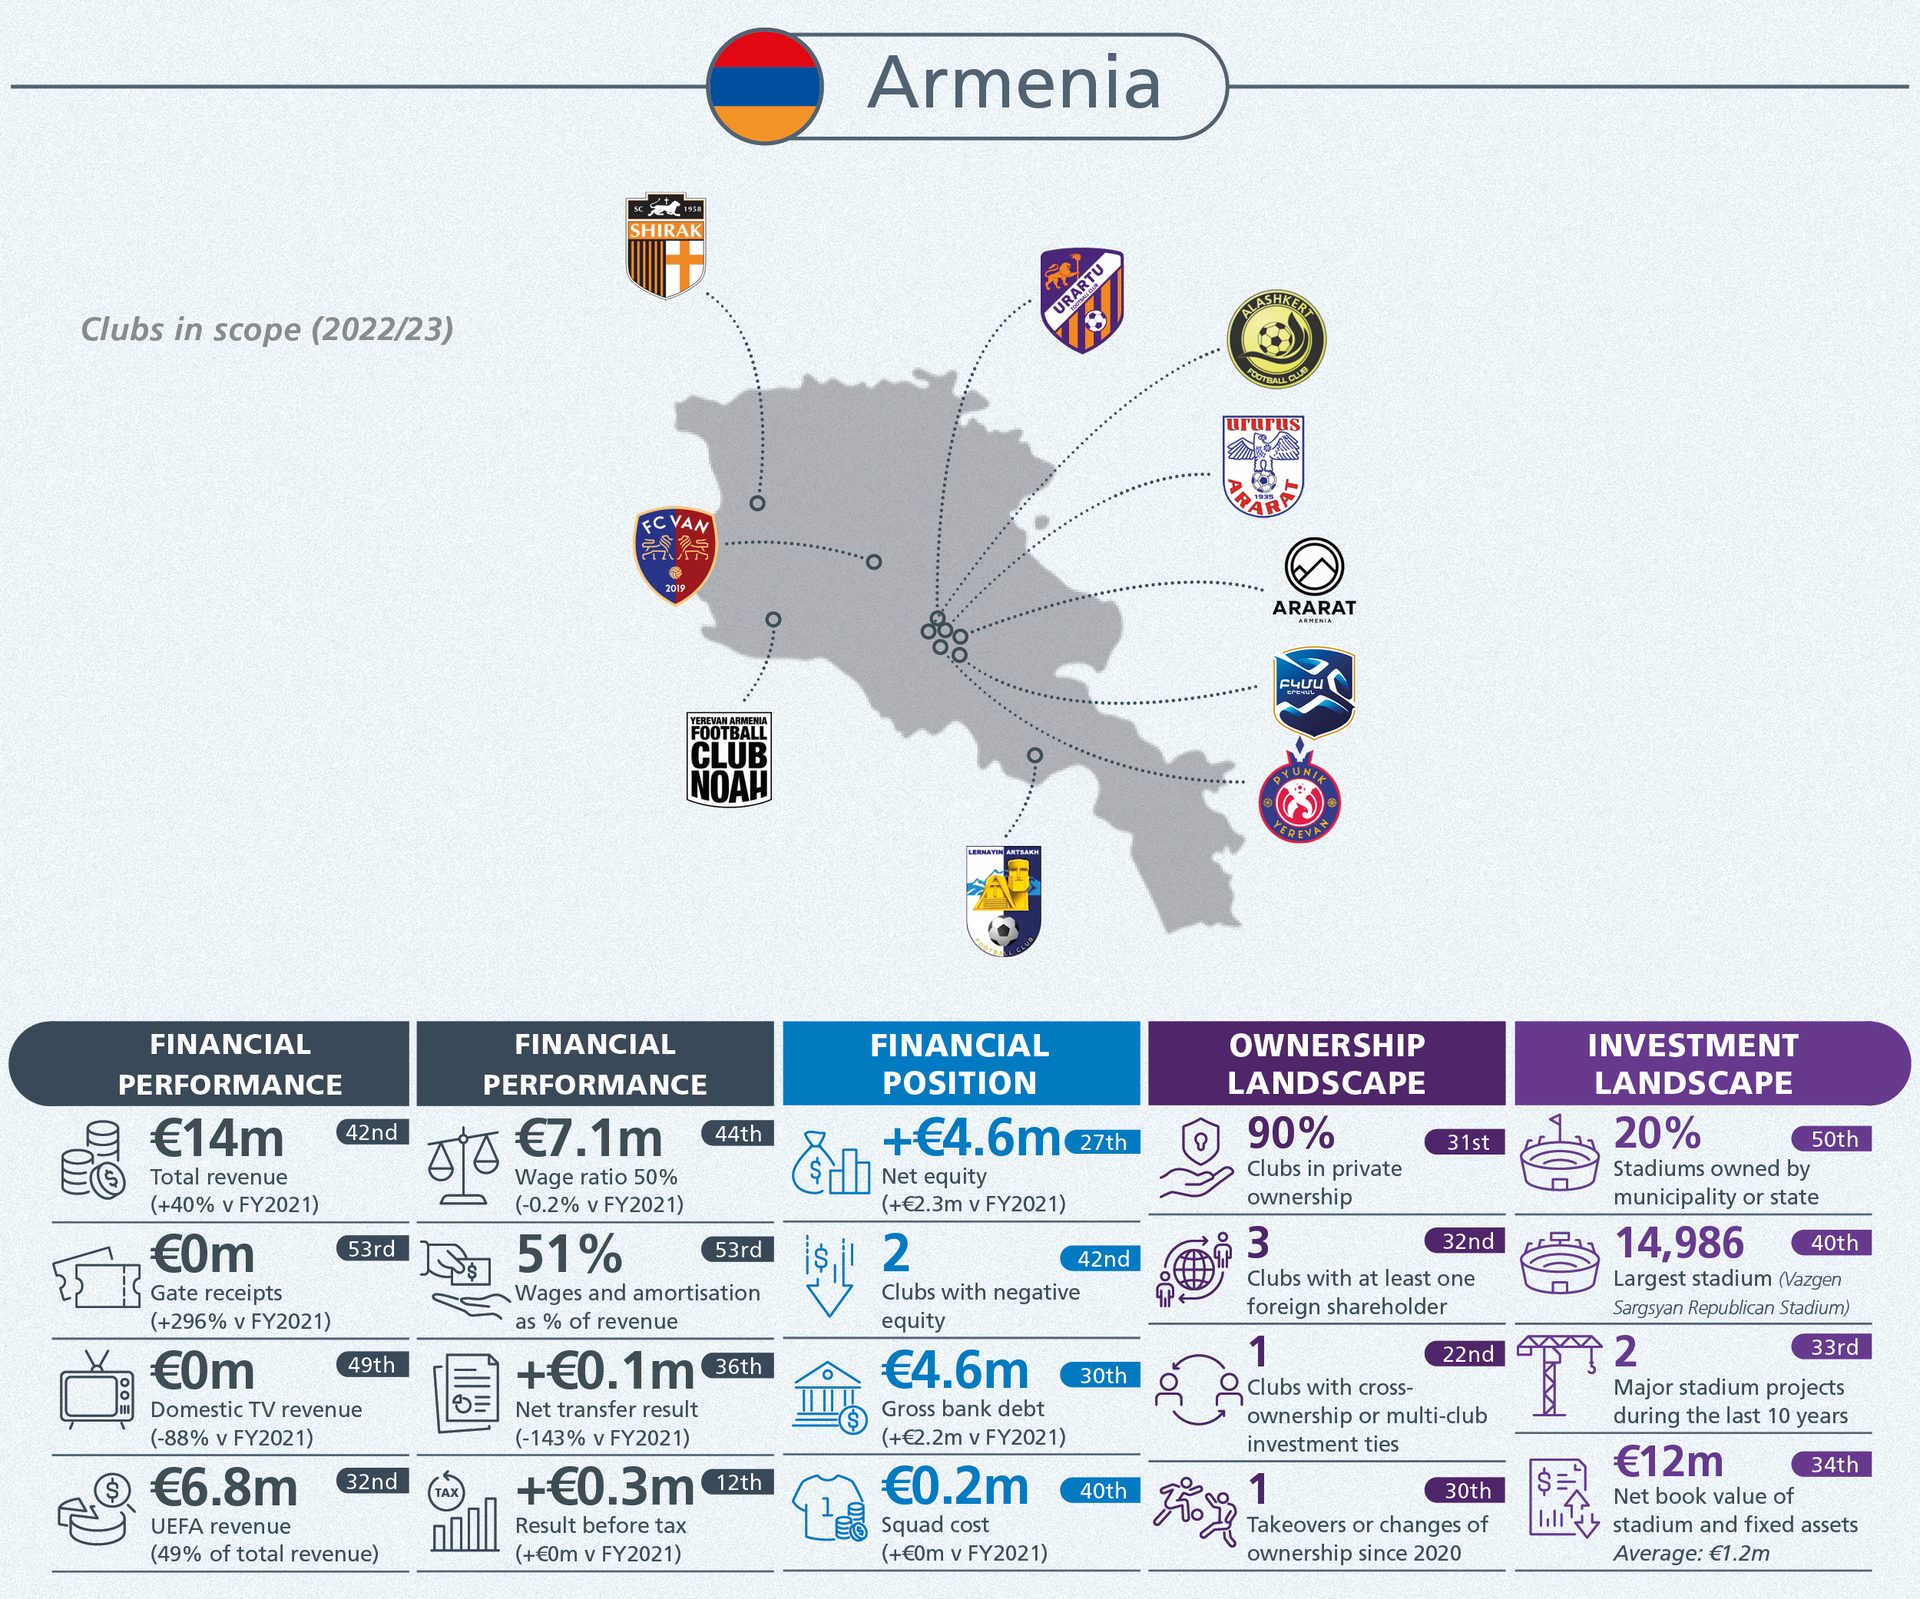
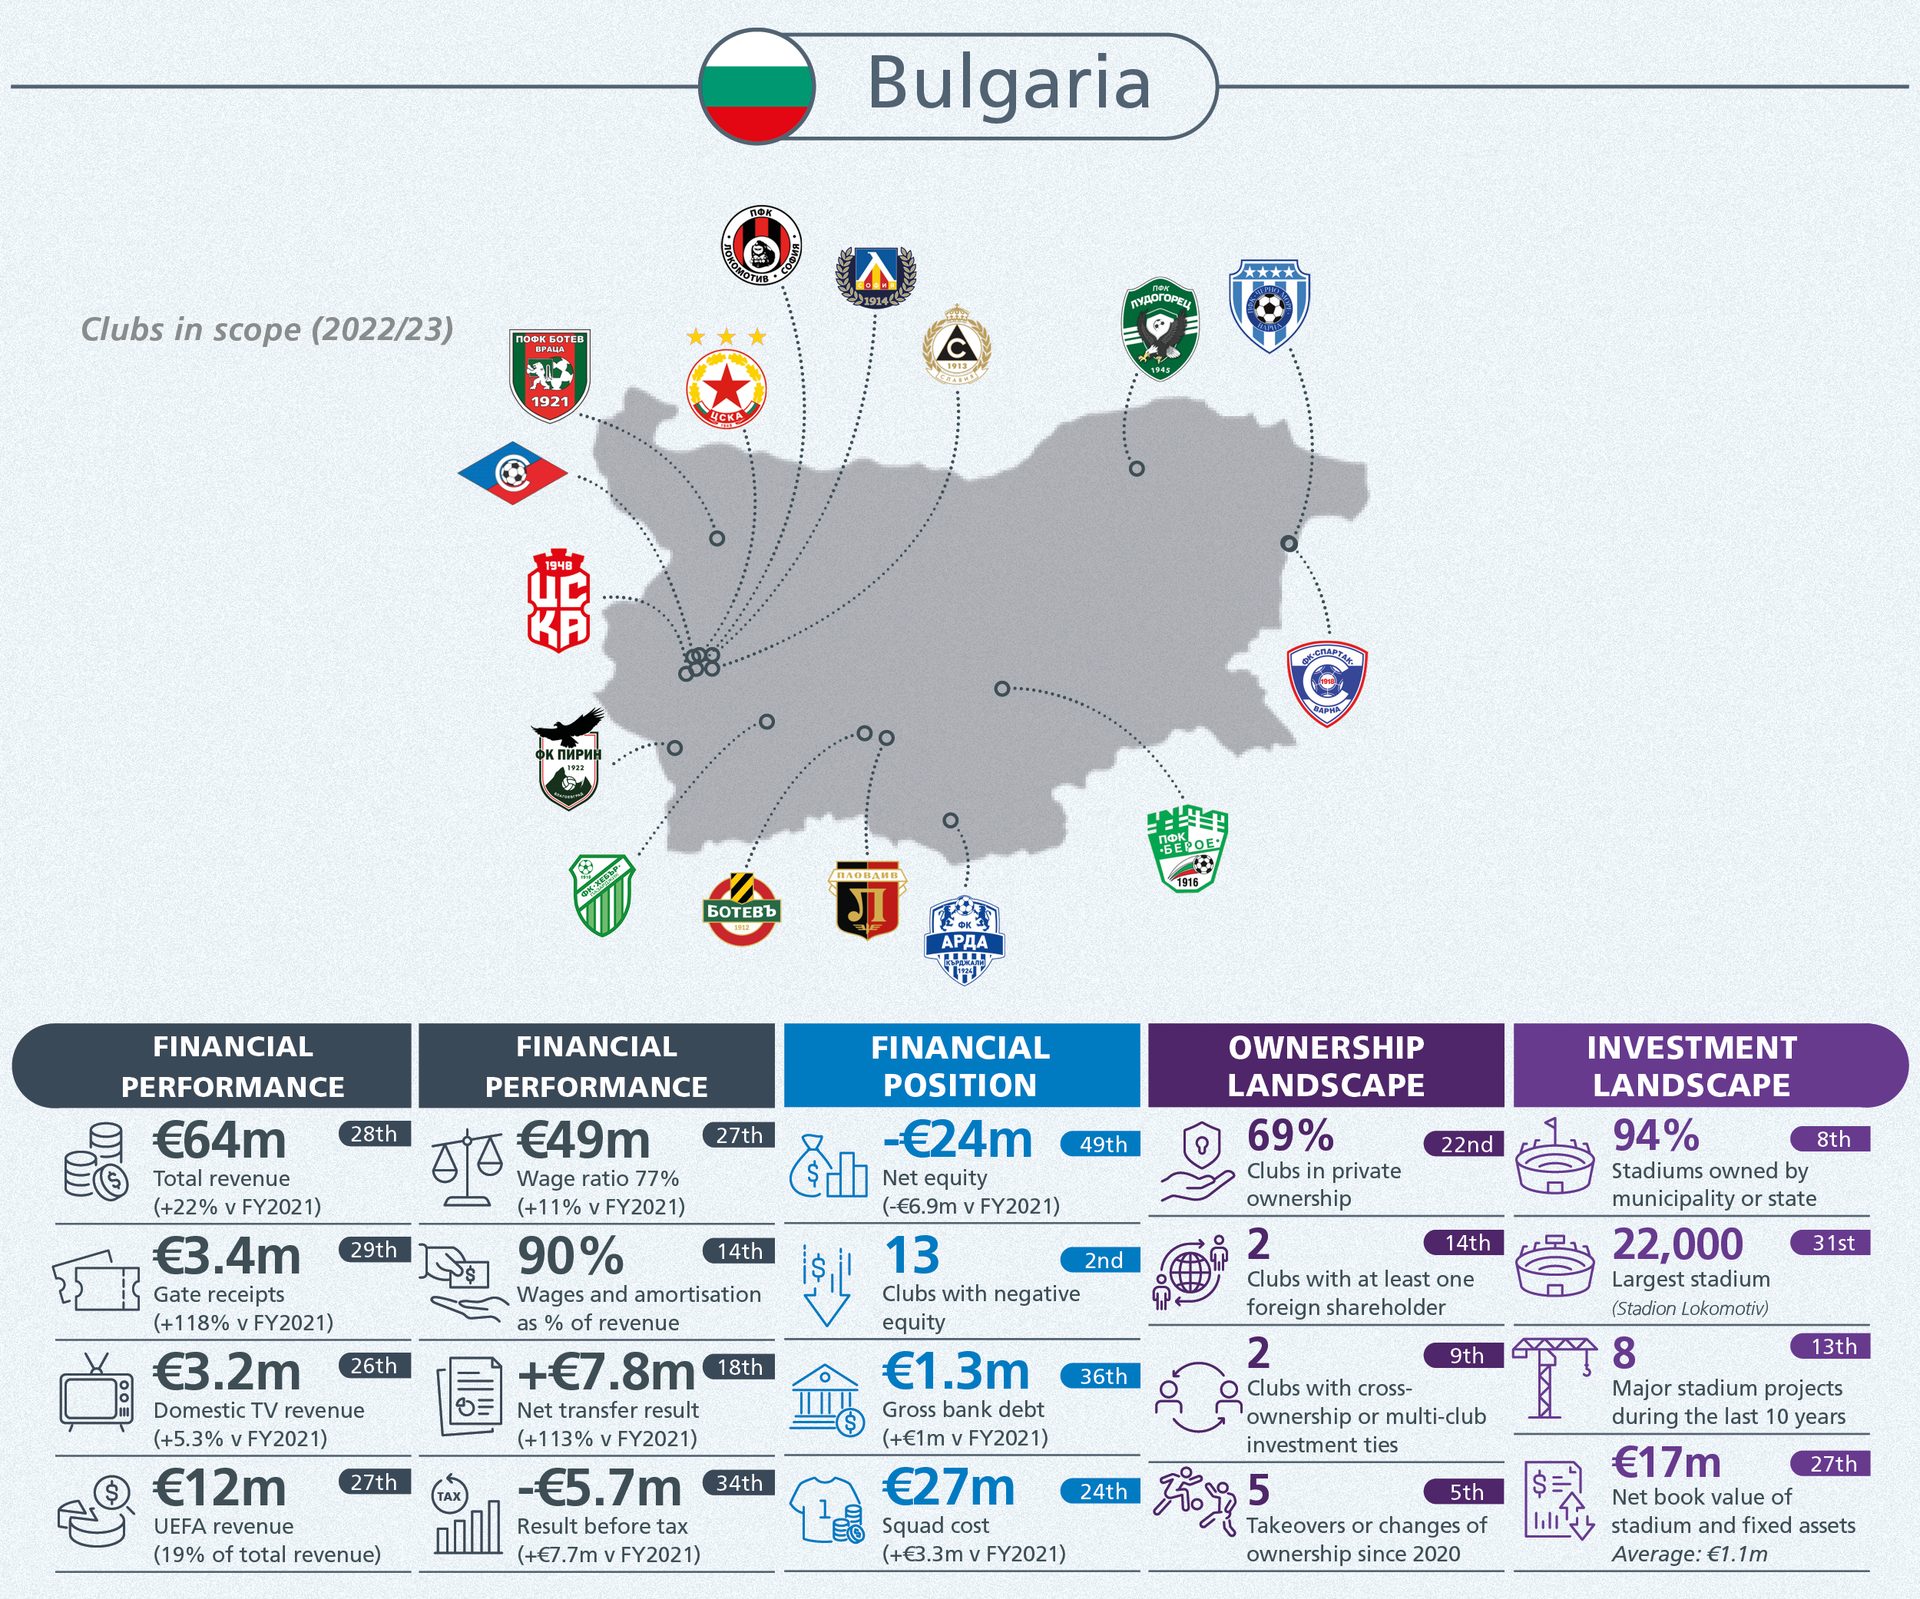
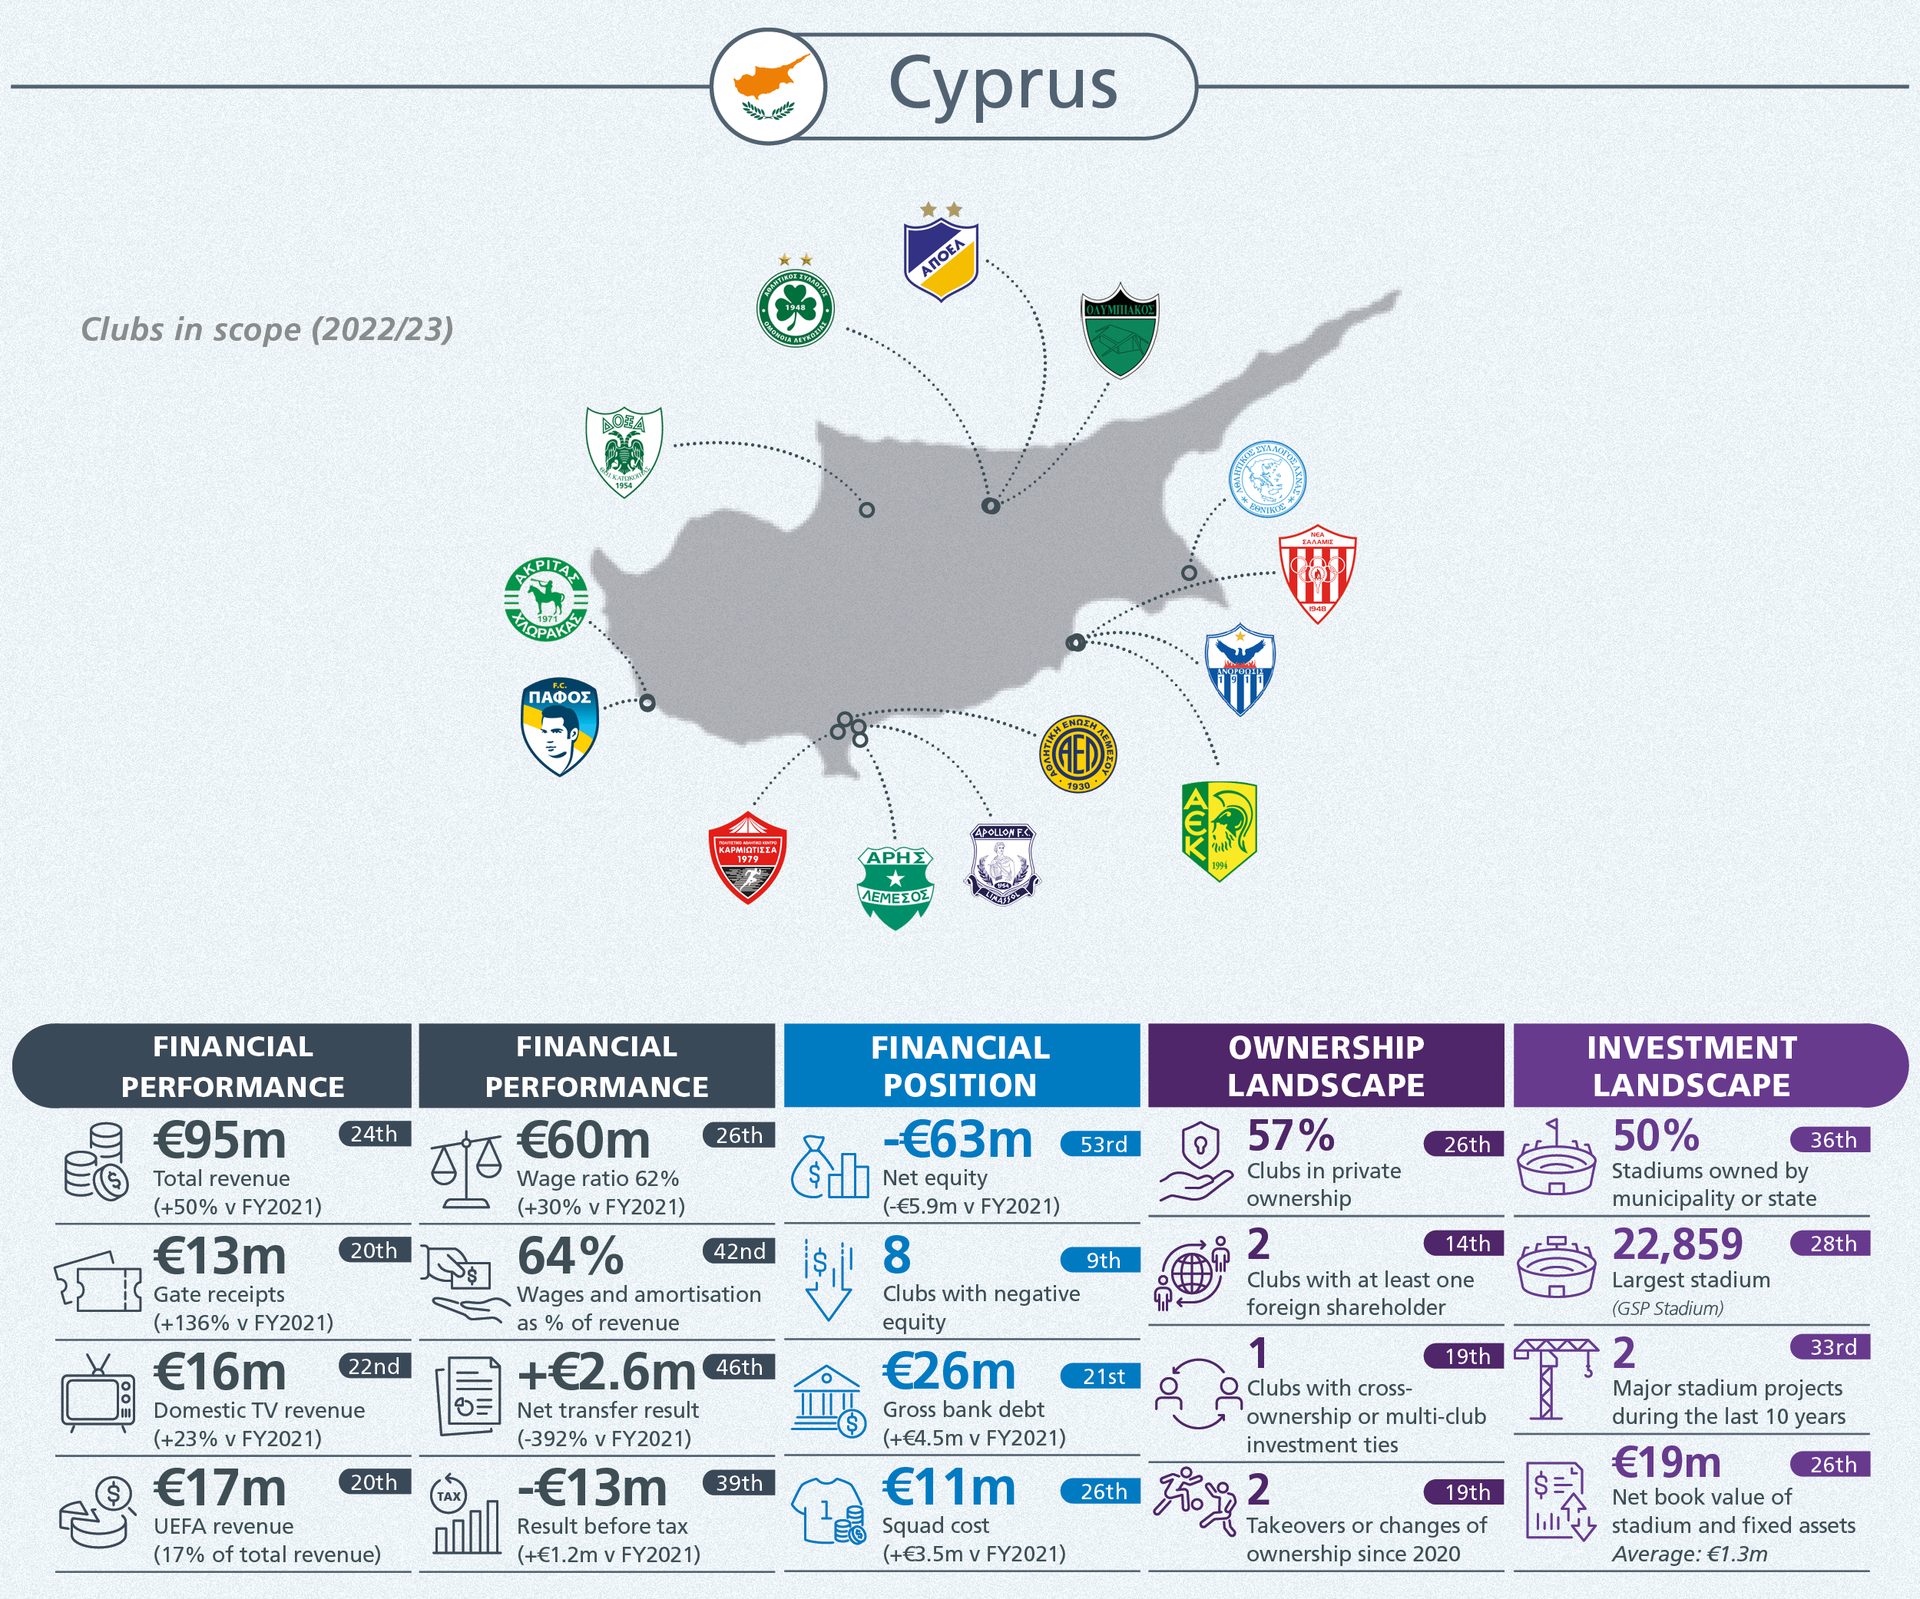
Click on each country to view revenue landscape.

The surge in wage costs evident during the pandemic is potentially slowing as sustainability rules bite.
Fast pre-pandemic revenue and wage growth, sustainable wage ratio.
2019
WAGE COST
bn
€
,
0
10

GROWTH RATE
%
+
1

WAGE RATIO

%
+
44
First ever reported wage decrease as pandemic lengthened season pushes bonuses into following year.
2020
WAGE COST
bn
€
,
0
10
GROWTH RATE
%
–
0
WAGE RATIO
%
+
51
Wage growth continued at height of pandemic despite another €3bn of lost revenues. Unsustainable peak wage ratio.
2021
WAGE COST
bn
€
,
0
11
GROWTH RATE
%
+
1
WAGE RATIO
%
+
55
As revenues return wages grow by €1 billion. Wage ratio decreases but still unsustainable.
2022
WAGE COST
bn
€
,
0
12
GROWTH RATE
%
+
1
WAGE RATIO
%
+
51
Positive signs of clubs adapting to financial realities. Wage growth slows and more sustainable wage ratio.
2023
WAGE COST
bn
€
,
0
13
GROWTH RATE
%
+
1
WAGE RATIO
%
+
45
Fast pre-pandemic revenue and wage growth, sustainable wage ratio.
2019
WAGE COST
bn
€
,
0
10
GROWTH RATE
%
+
1
WAGE RATIO
%
+
60
First ever reported wage decrease as pandemic lengthened season pushes bonuses into following year.
2020
WAGE COST
bn
€
,
0
10
GROWTH RATE
%
–
0
WAGE RATIO
%
+
67
Wage growth continued at height of pandemic despite another €3bn of lost revenues. Unsustainable peak wage ratio.
2021
WAGE COST
bn
€
,
0
10
GROWTH RATE
%
+
1
WAGE RATIO
%
+
71
As revenues return wages grow by
€1 billion. Wage ratio decreases but still unsustainable.
2022
WAGE COST
bn
€
,
0
10
GROWTH RATE
%
+
1
WAGE RATIO
%
+
67
Positive signs of clubs adapting to financial realities. Wage growth slows and more sustainable wage ratio.
2023
WAGE COST
bn
€
,
0
10
GROWTH RATE
%
+
0
WAGE RATIO
%
+
61
7,9
7,8
8,4
9,3
9,7
6,9
6,8
7,5
7,5
14.8
14.6
15.9
16.9
All Clubs
7,9
7,8
8,4
9,3
9,7
6,9
6,8
7,5
7,5
14.8
14.6
15.9
16.9
All Clubs
The full report features fourteen different club by club comparisons with a selection of these topics presented below.
You can explore how much each club makes from gate revenues, then delve further into how much this represents per match and per supporter visit.
You can also explore which clubs spend the most on wages and which clubs squads cost the most transfer fees to build.
Click on each metric to view results


54
44
57
36
58
64
59
37
81
90
€40m 48%
123
97
128
85
€60m 45%
134
100
194
177
195
167
209
178
311
289
343
369
355
294
368
330
377
324
369
266
401
371
247
204
€64m 26%
83
79
Click "1 FC UNION" to see example
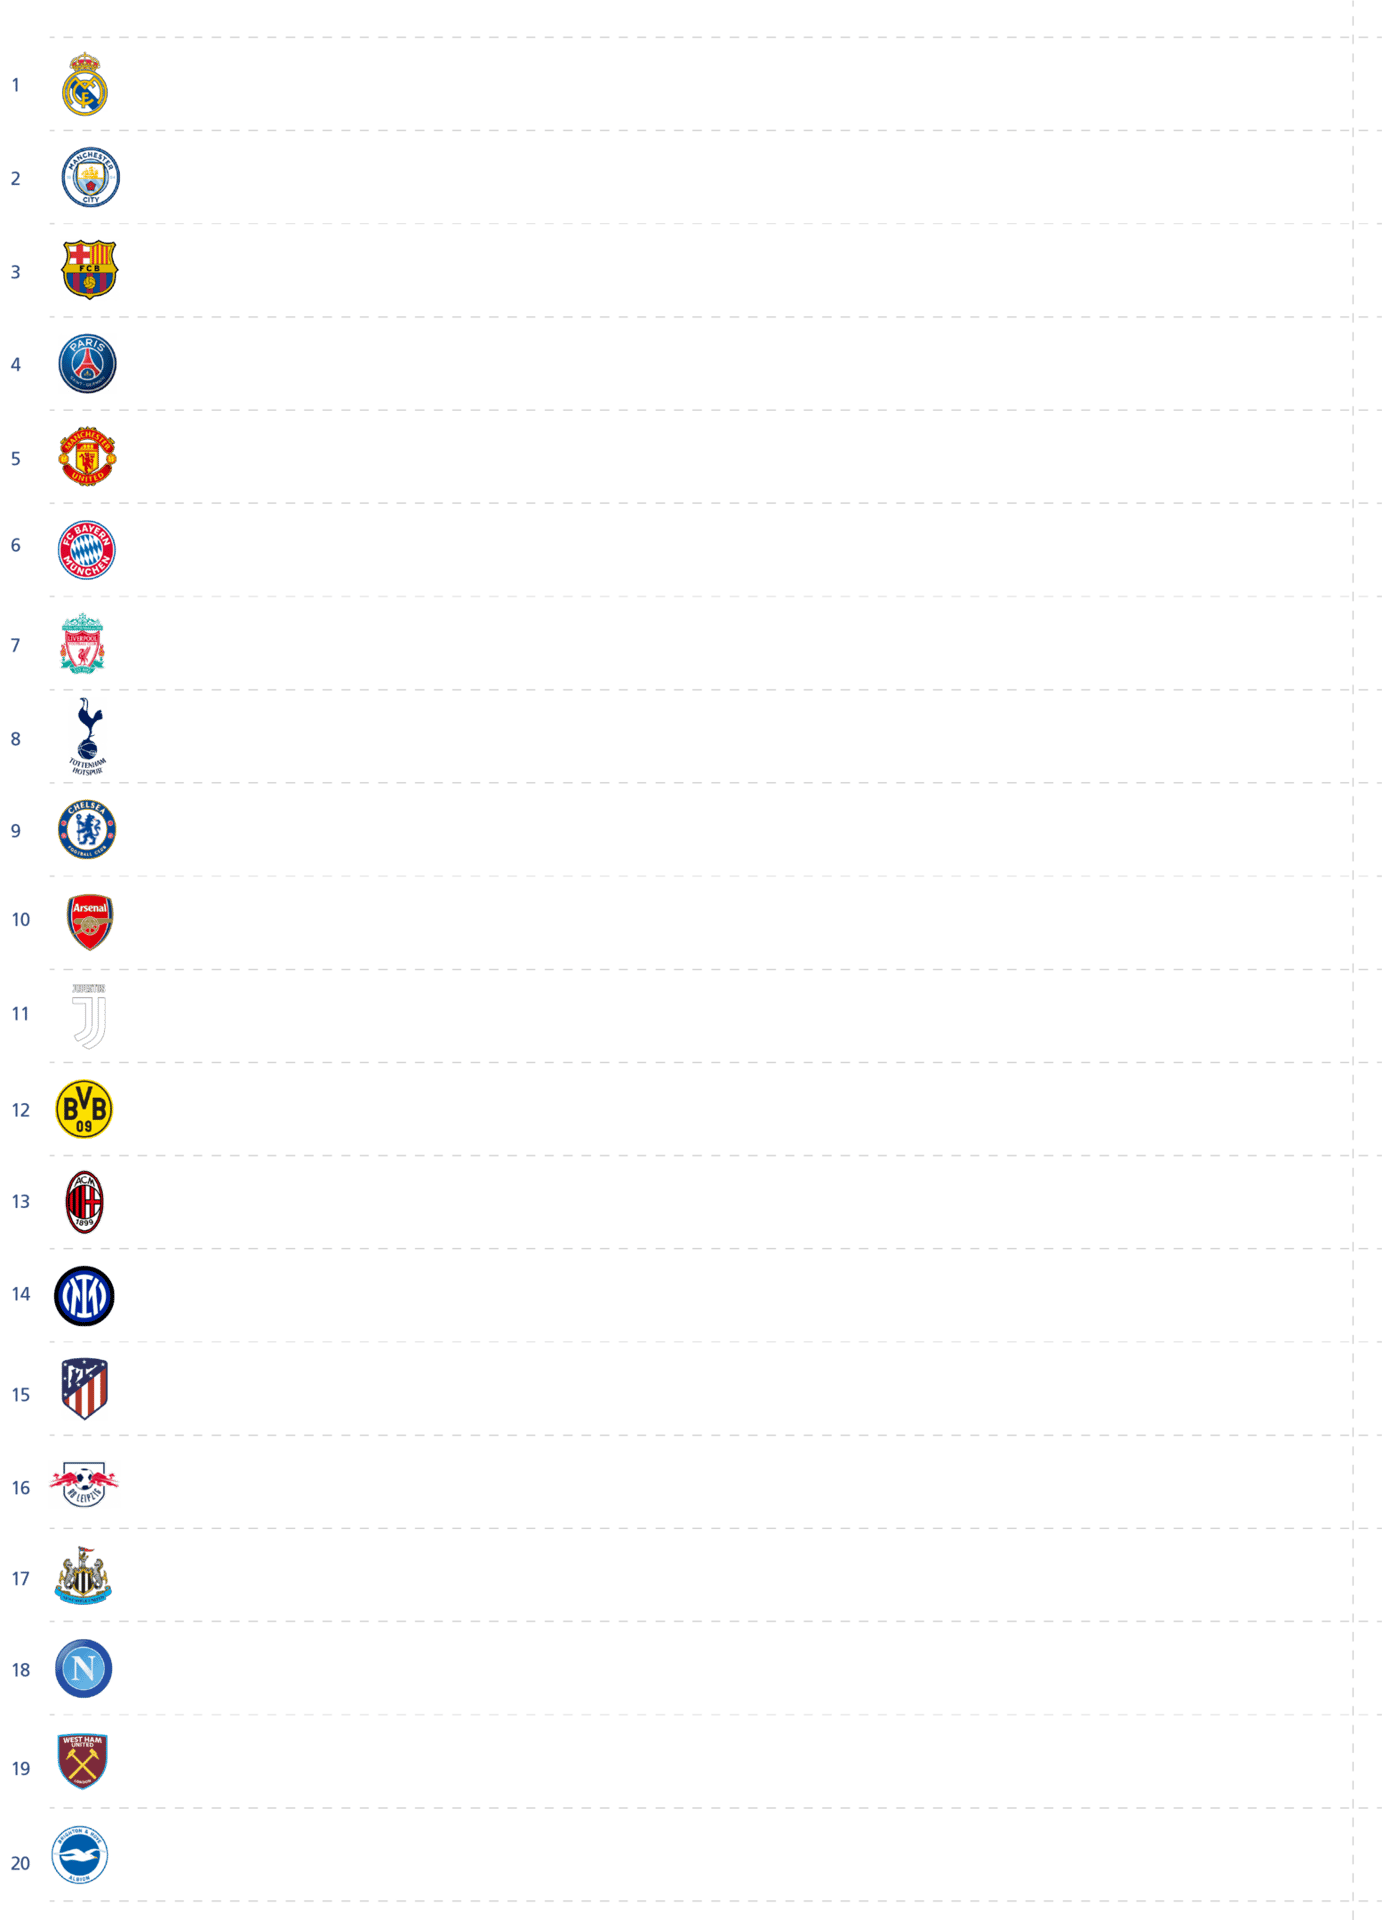
Total revenue
Gate Revenue
Gate Revenue Per Fan
Total Wages
WAGE RATIO
TRANSFER COST of squads
Balance Sheet Cost of Squads
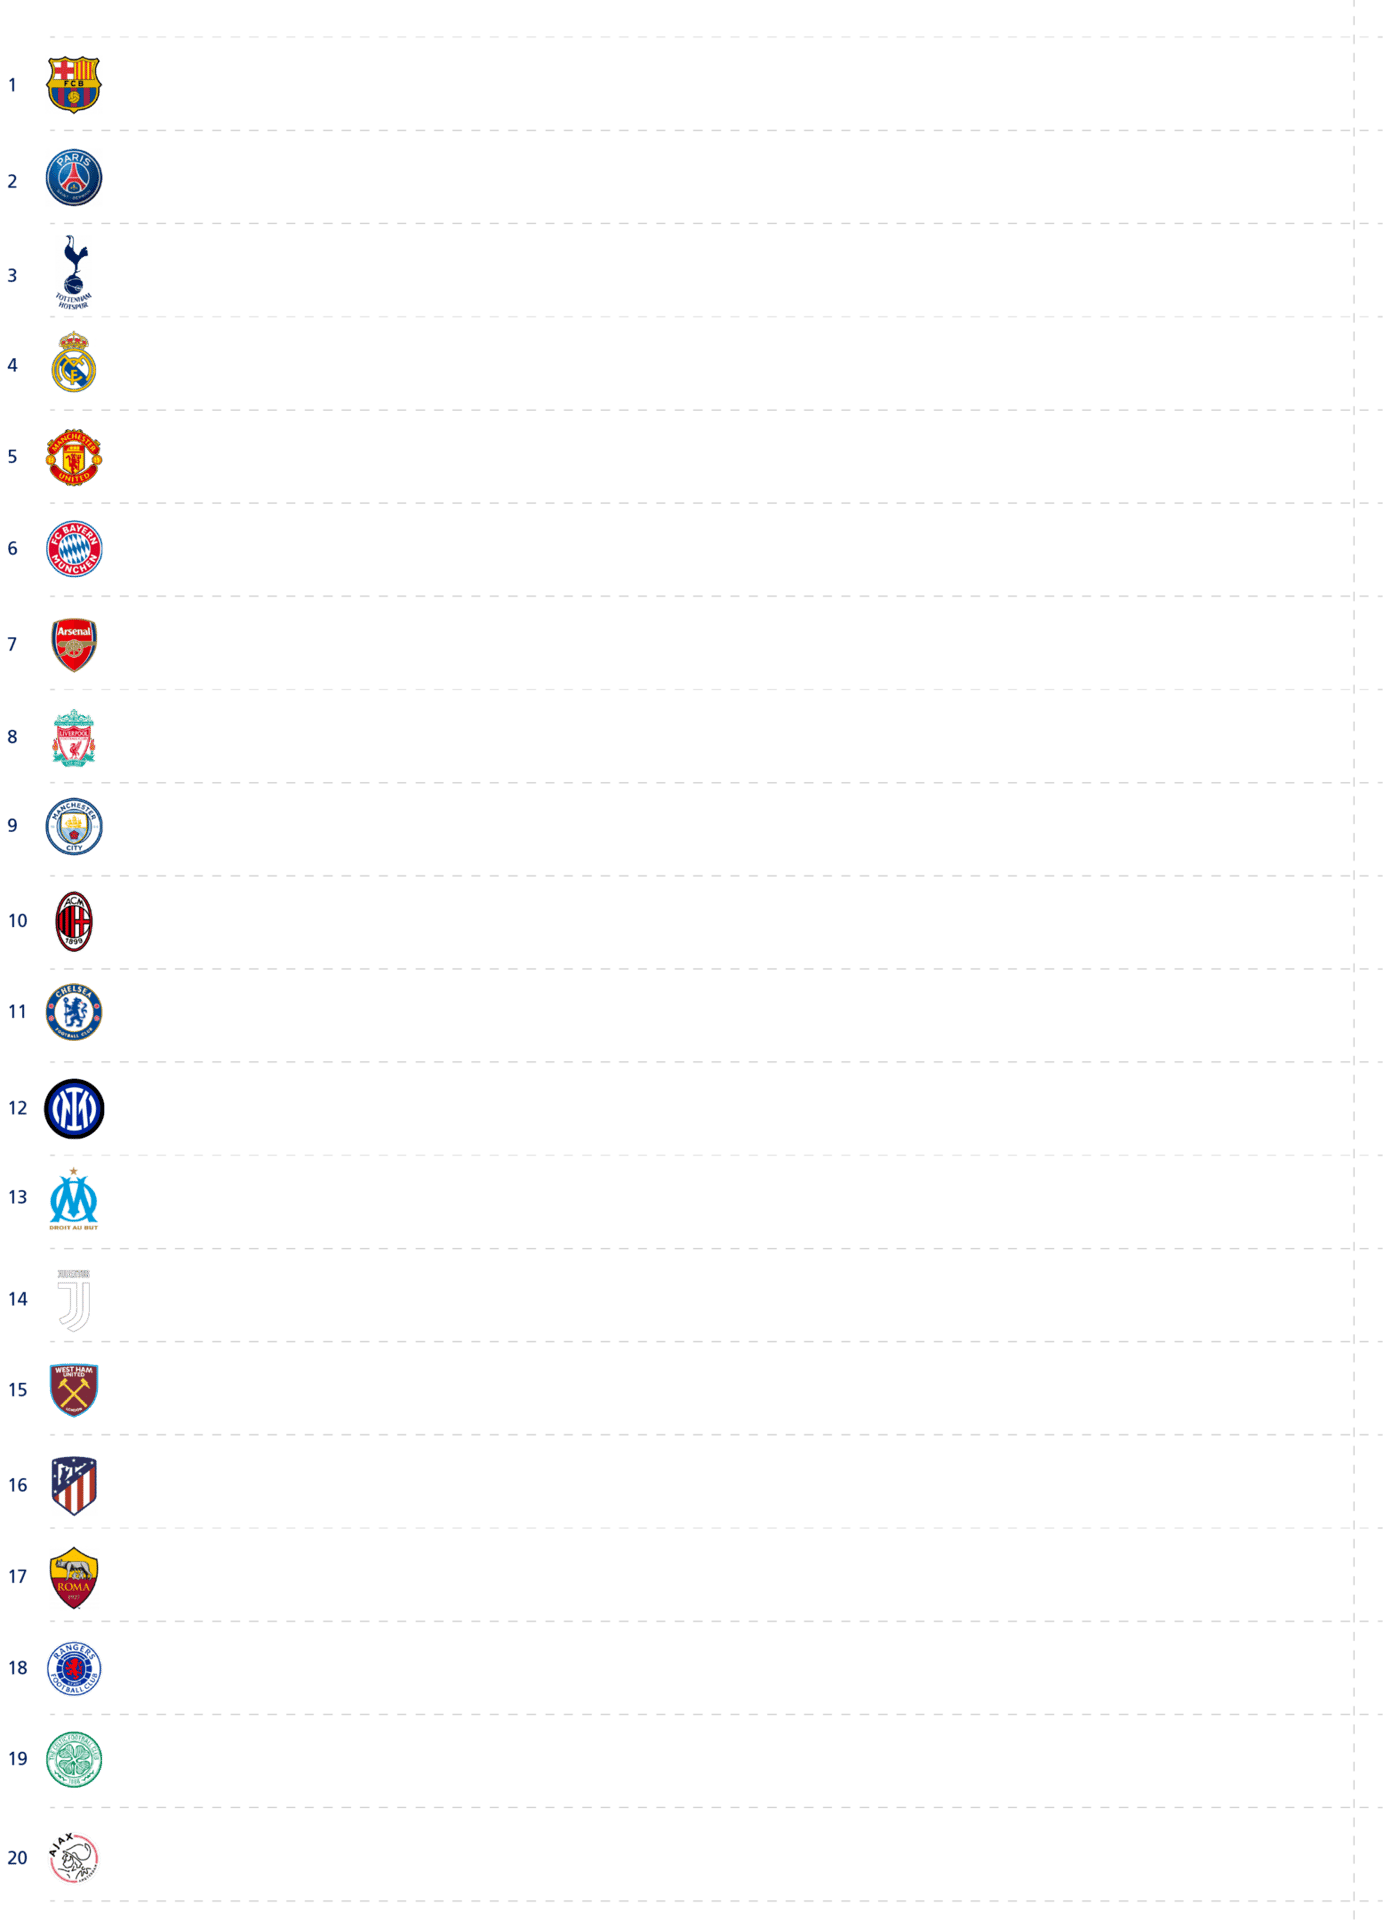
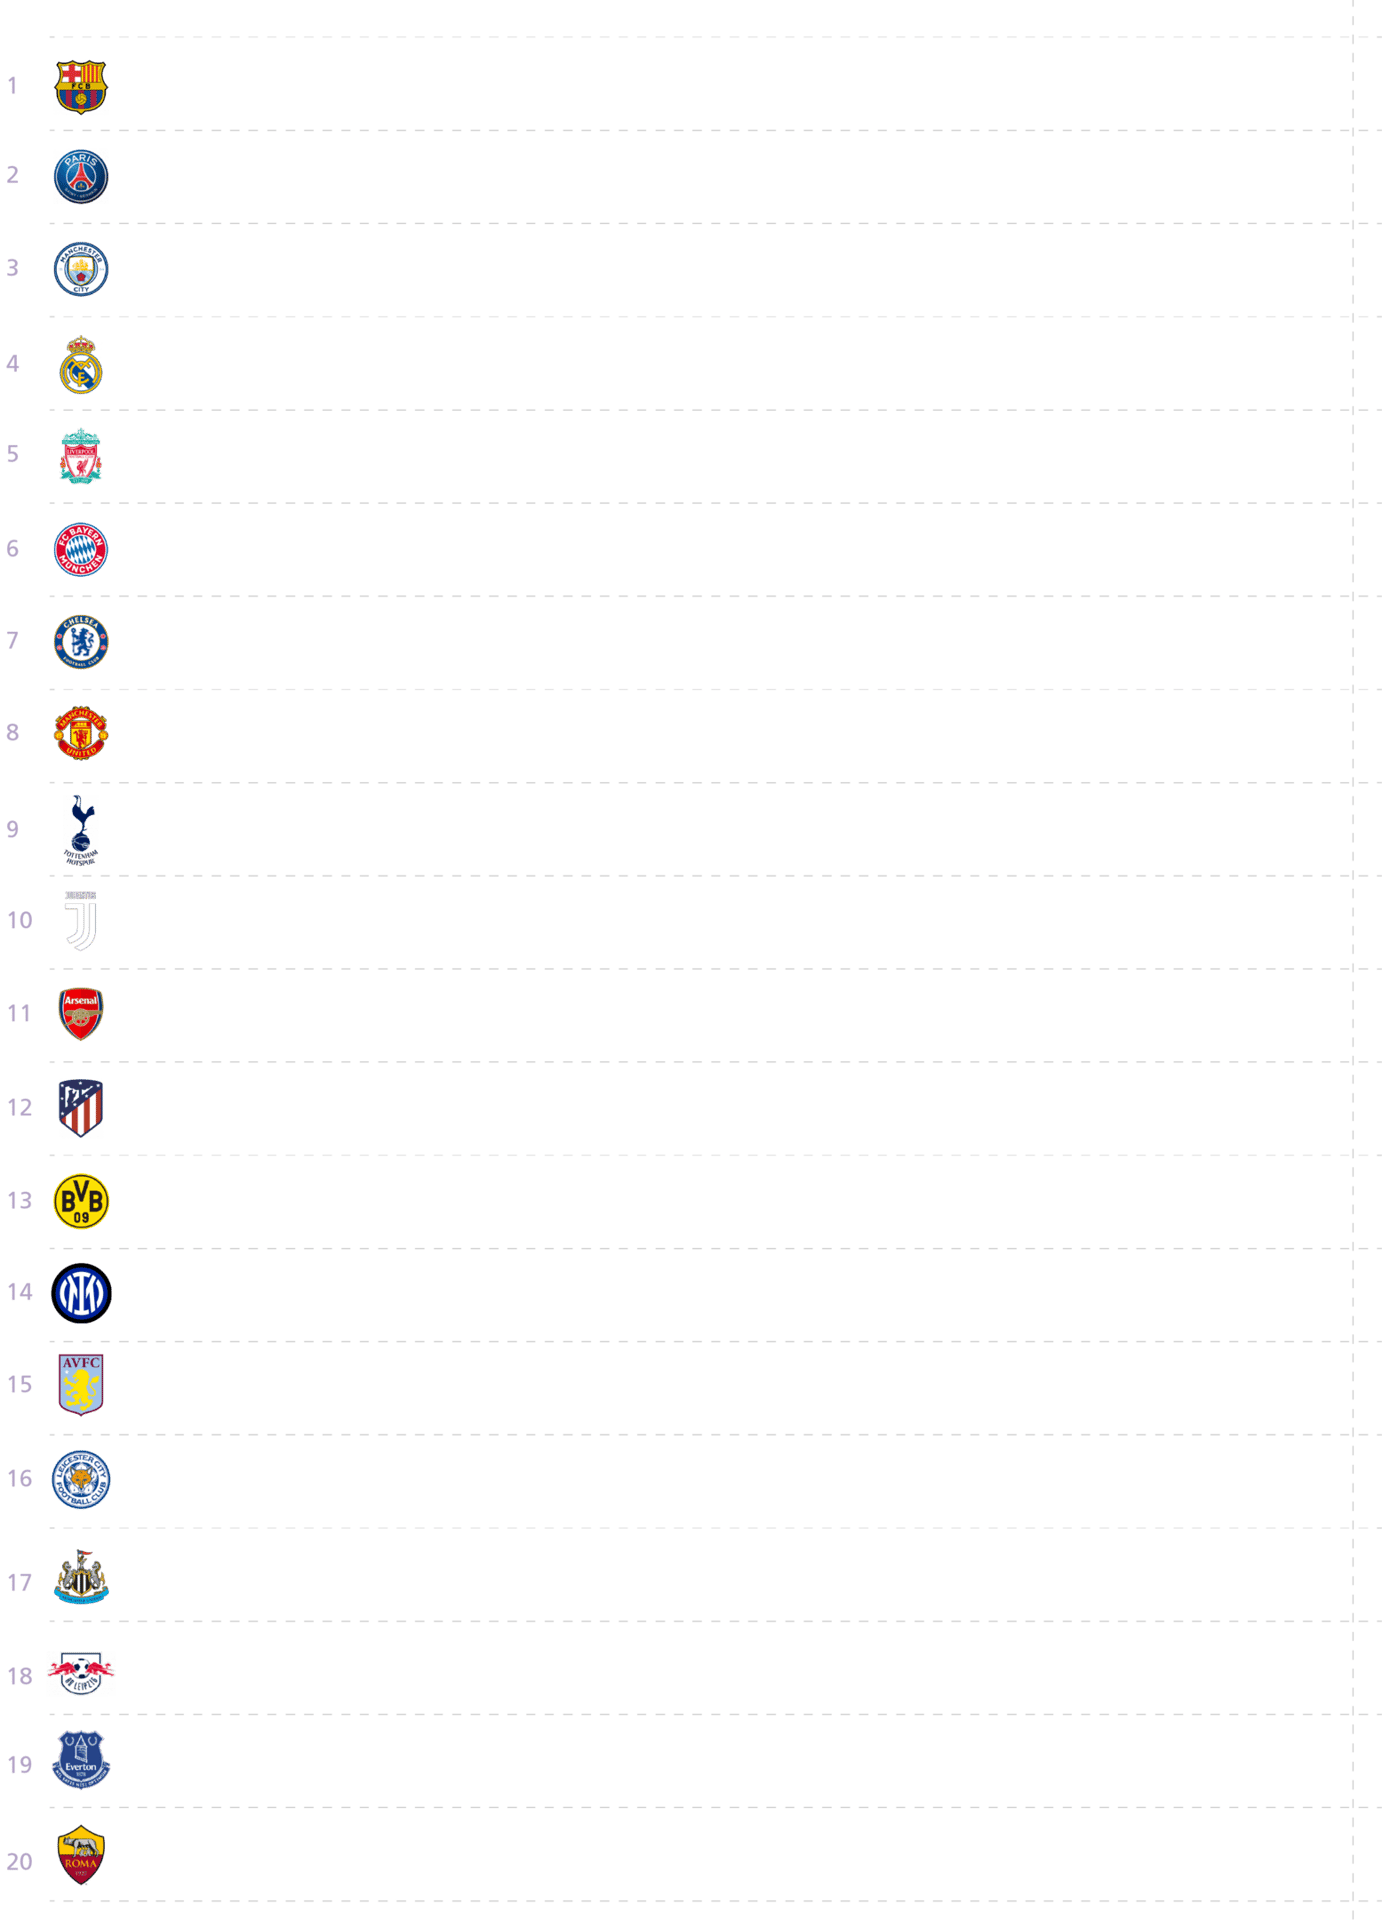
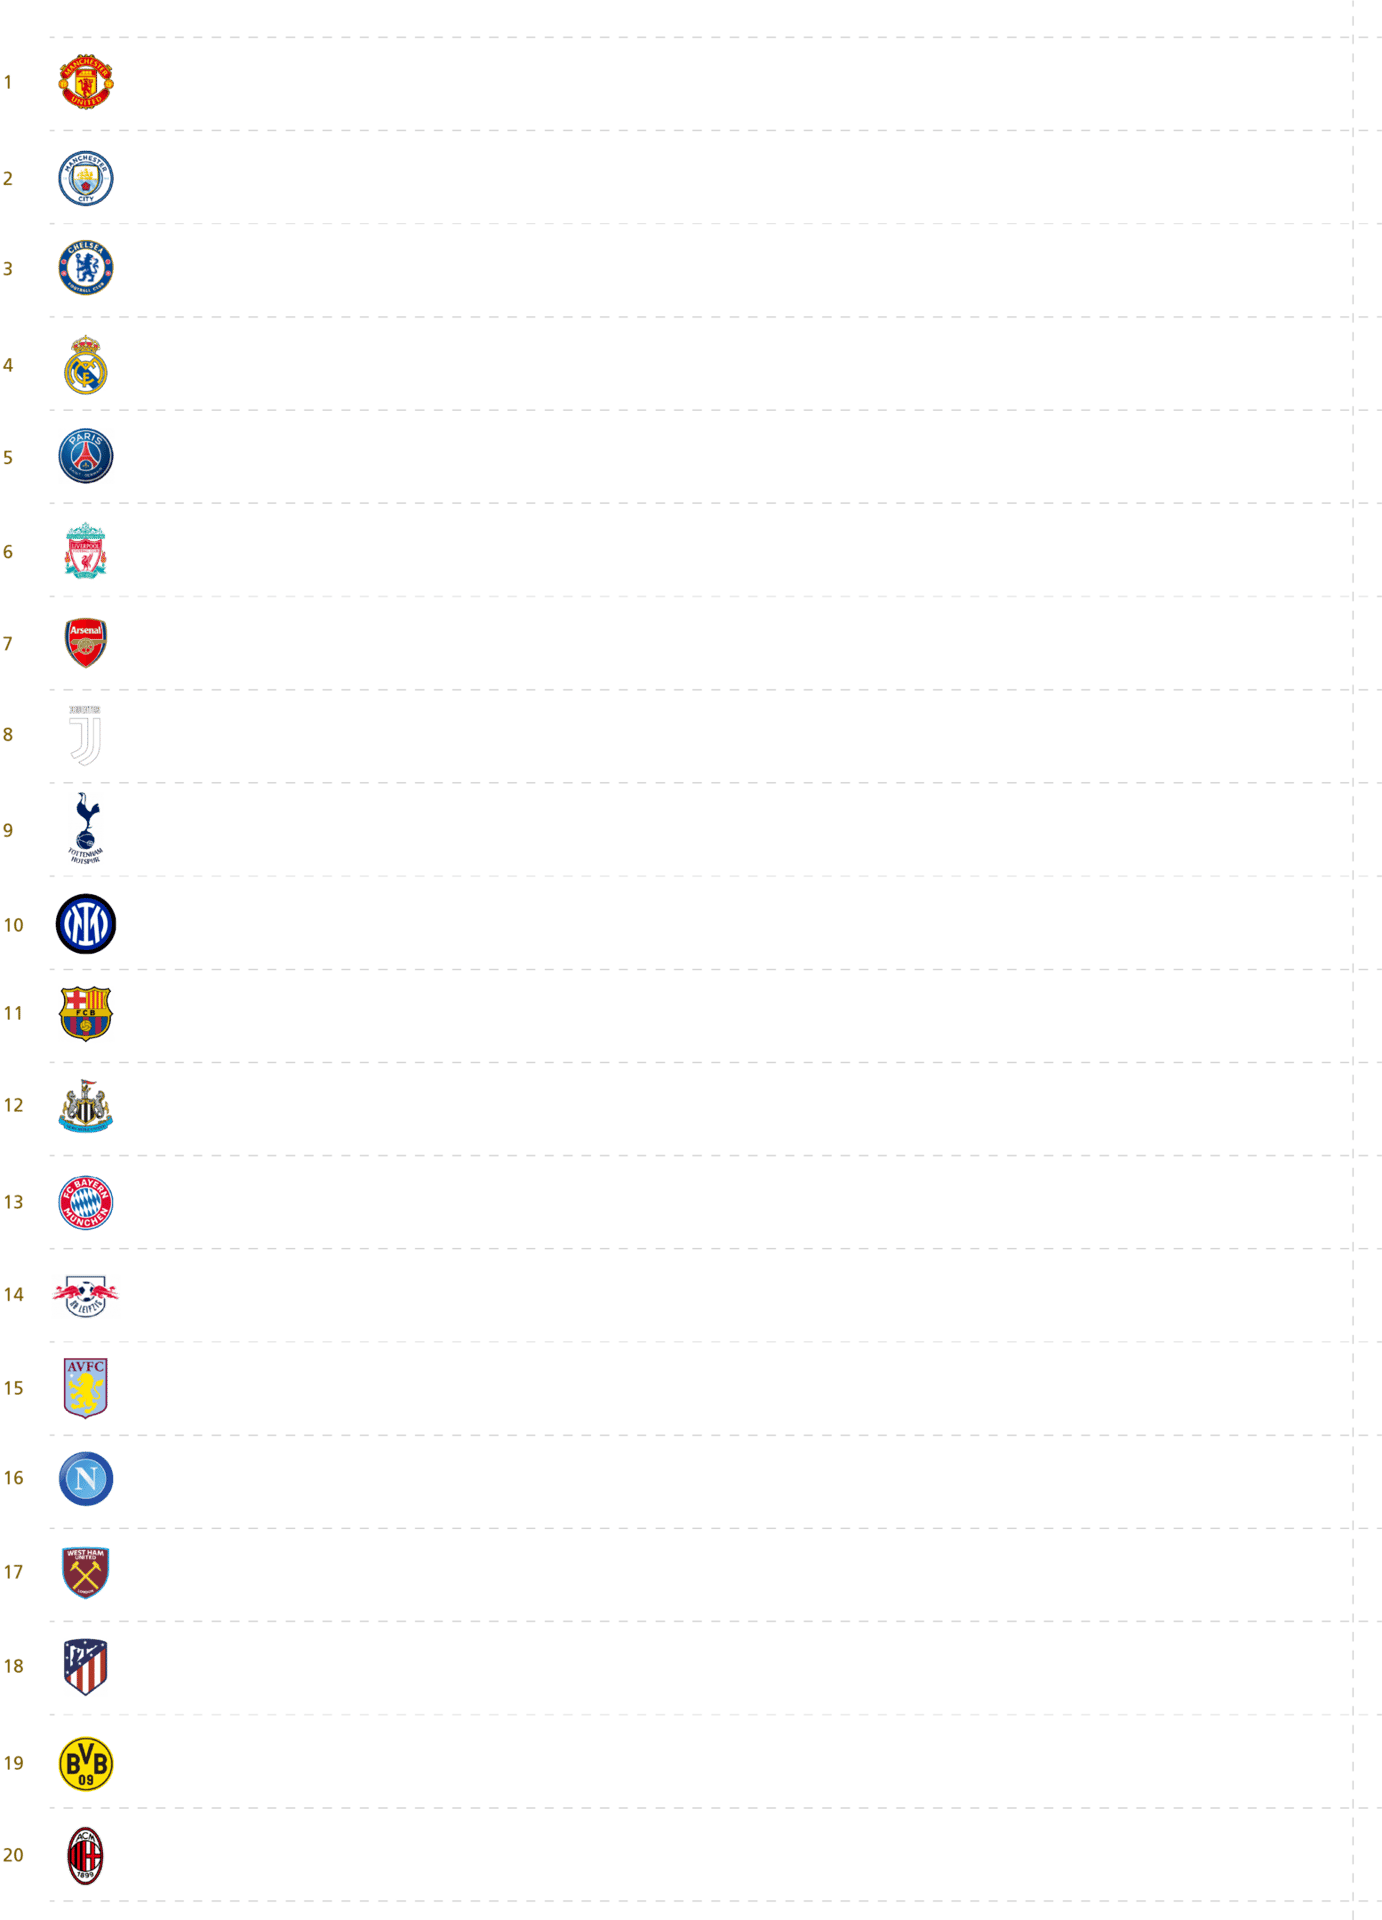
Total revenue
Gate Revenue
Balance Sheet Cost of Squads
Gate Revenue Per Fan
Total Wages
WAGE RATIO
Transfer costs of squads
Click on each metric to view results
Total revenue (€m)
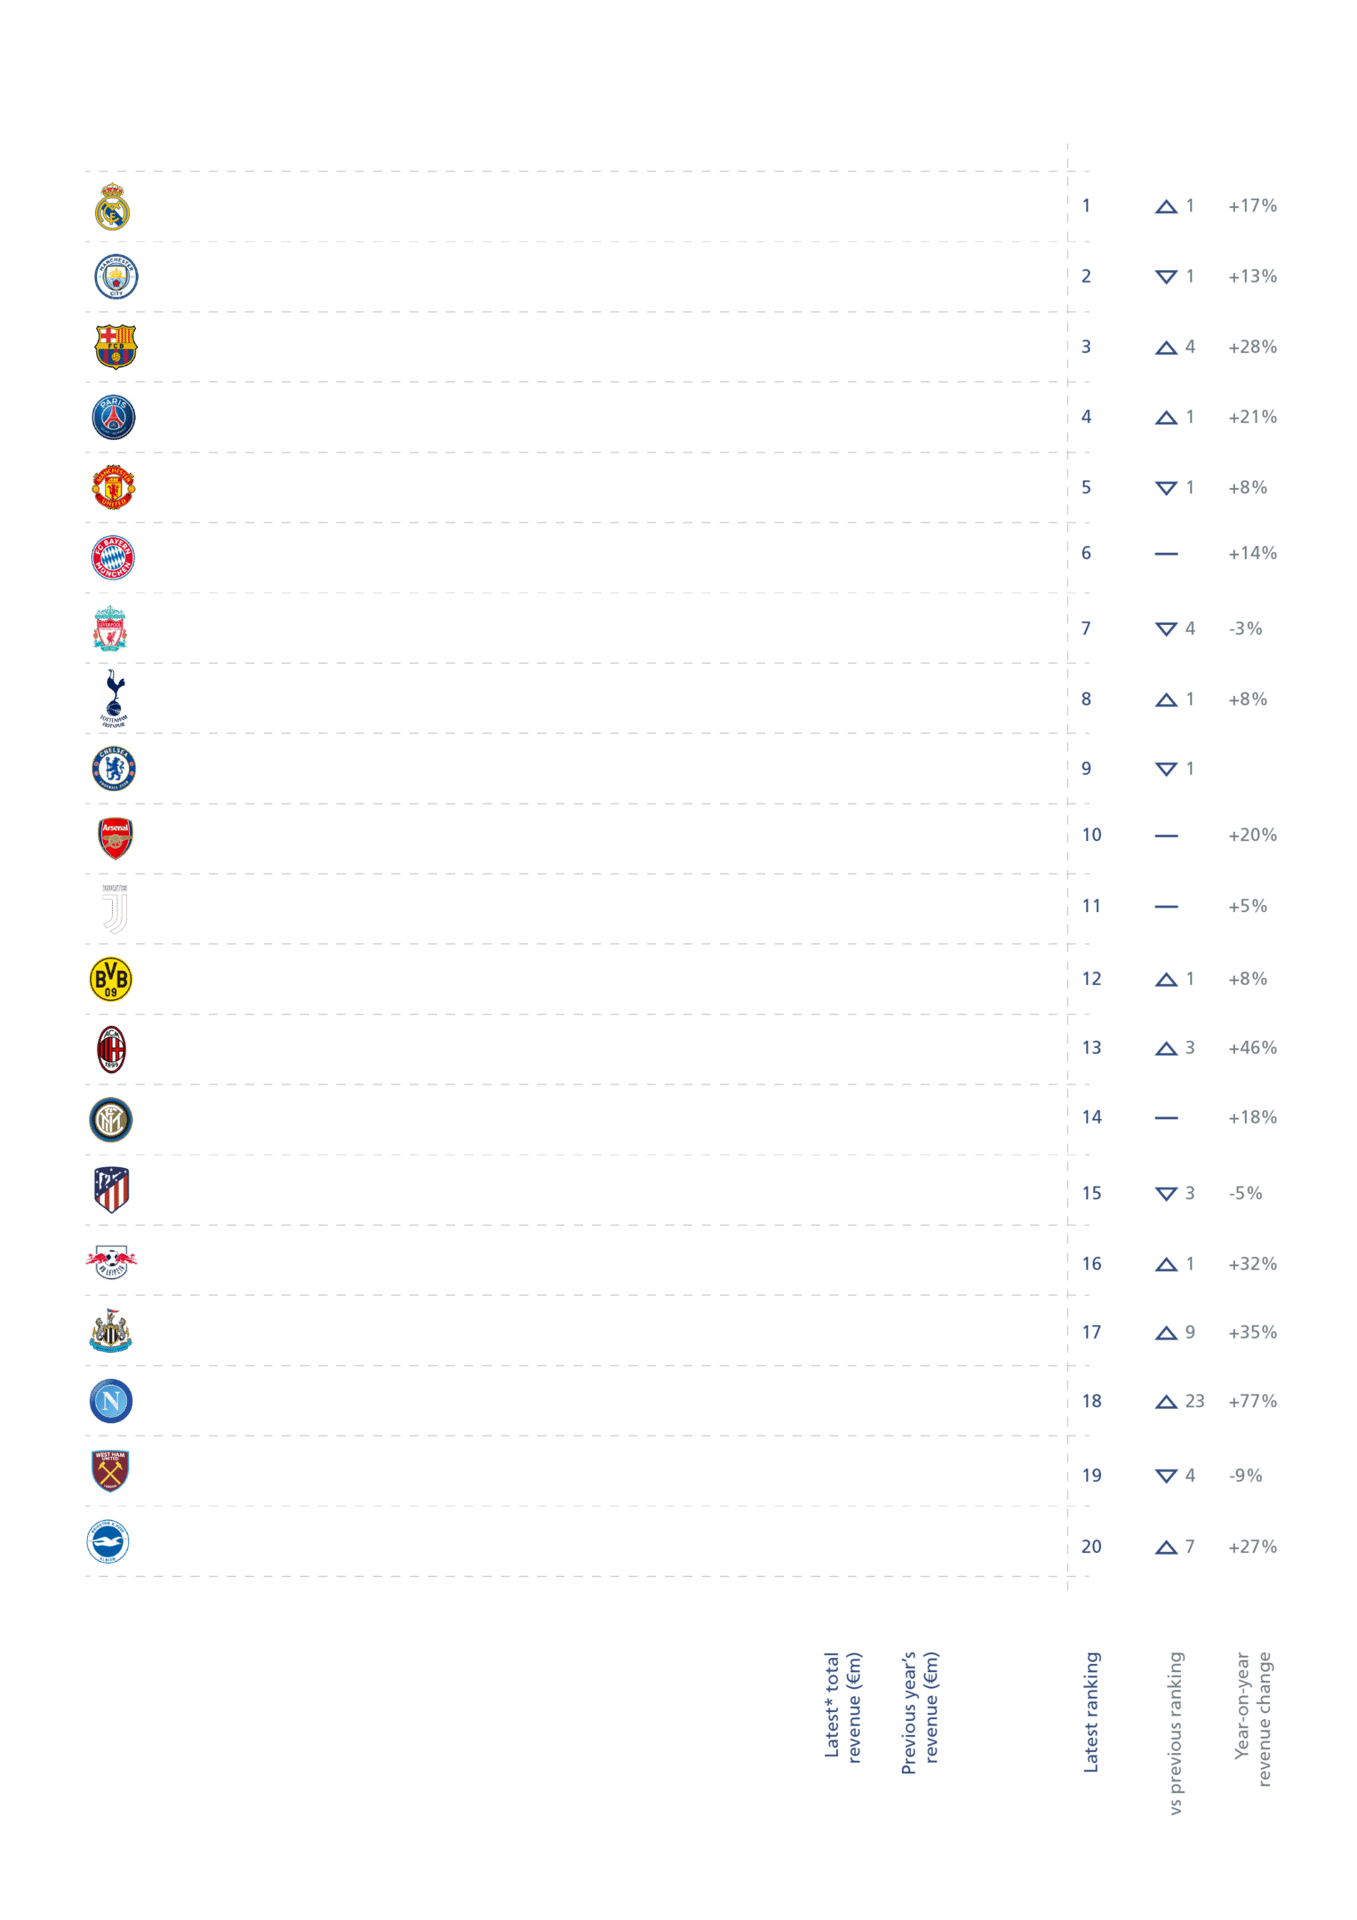
15 of the top 20 clubs reported their all-time record revenues in 2023
GATE REVENUE
Gate revenues increased 31% in 2023 among the top 20 clubs
Gate revenue per fan (€M)
The hospitality mix and ticketing prices dictate average income per match visit
total wages (€m)
Player wages declined 1% in 2023 as clubs prepare for updated financial sustainability rules
Wage ratio
The wage to revenue ratio is the most common referenced metric for wage affordability
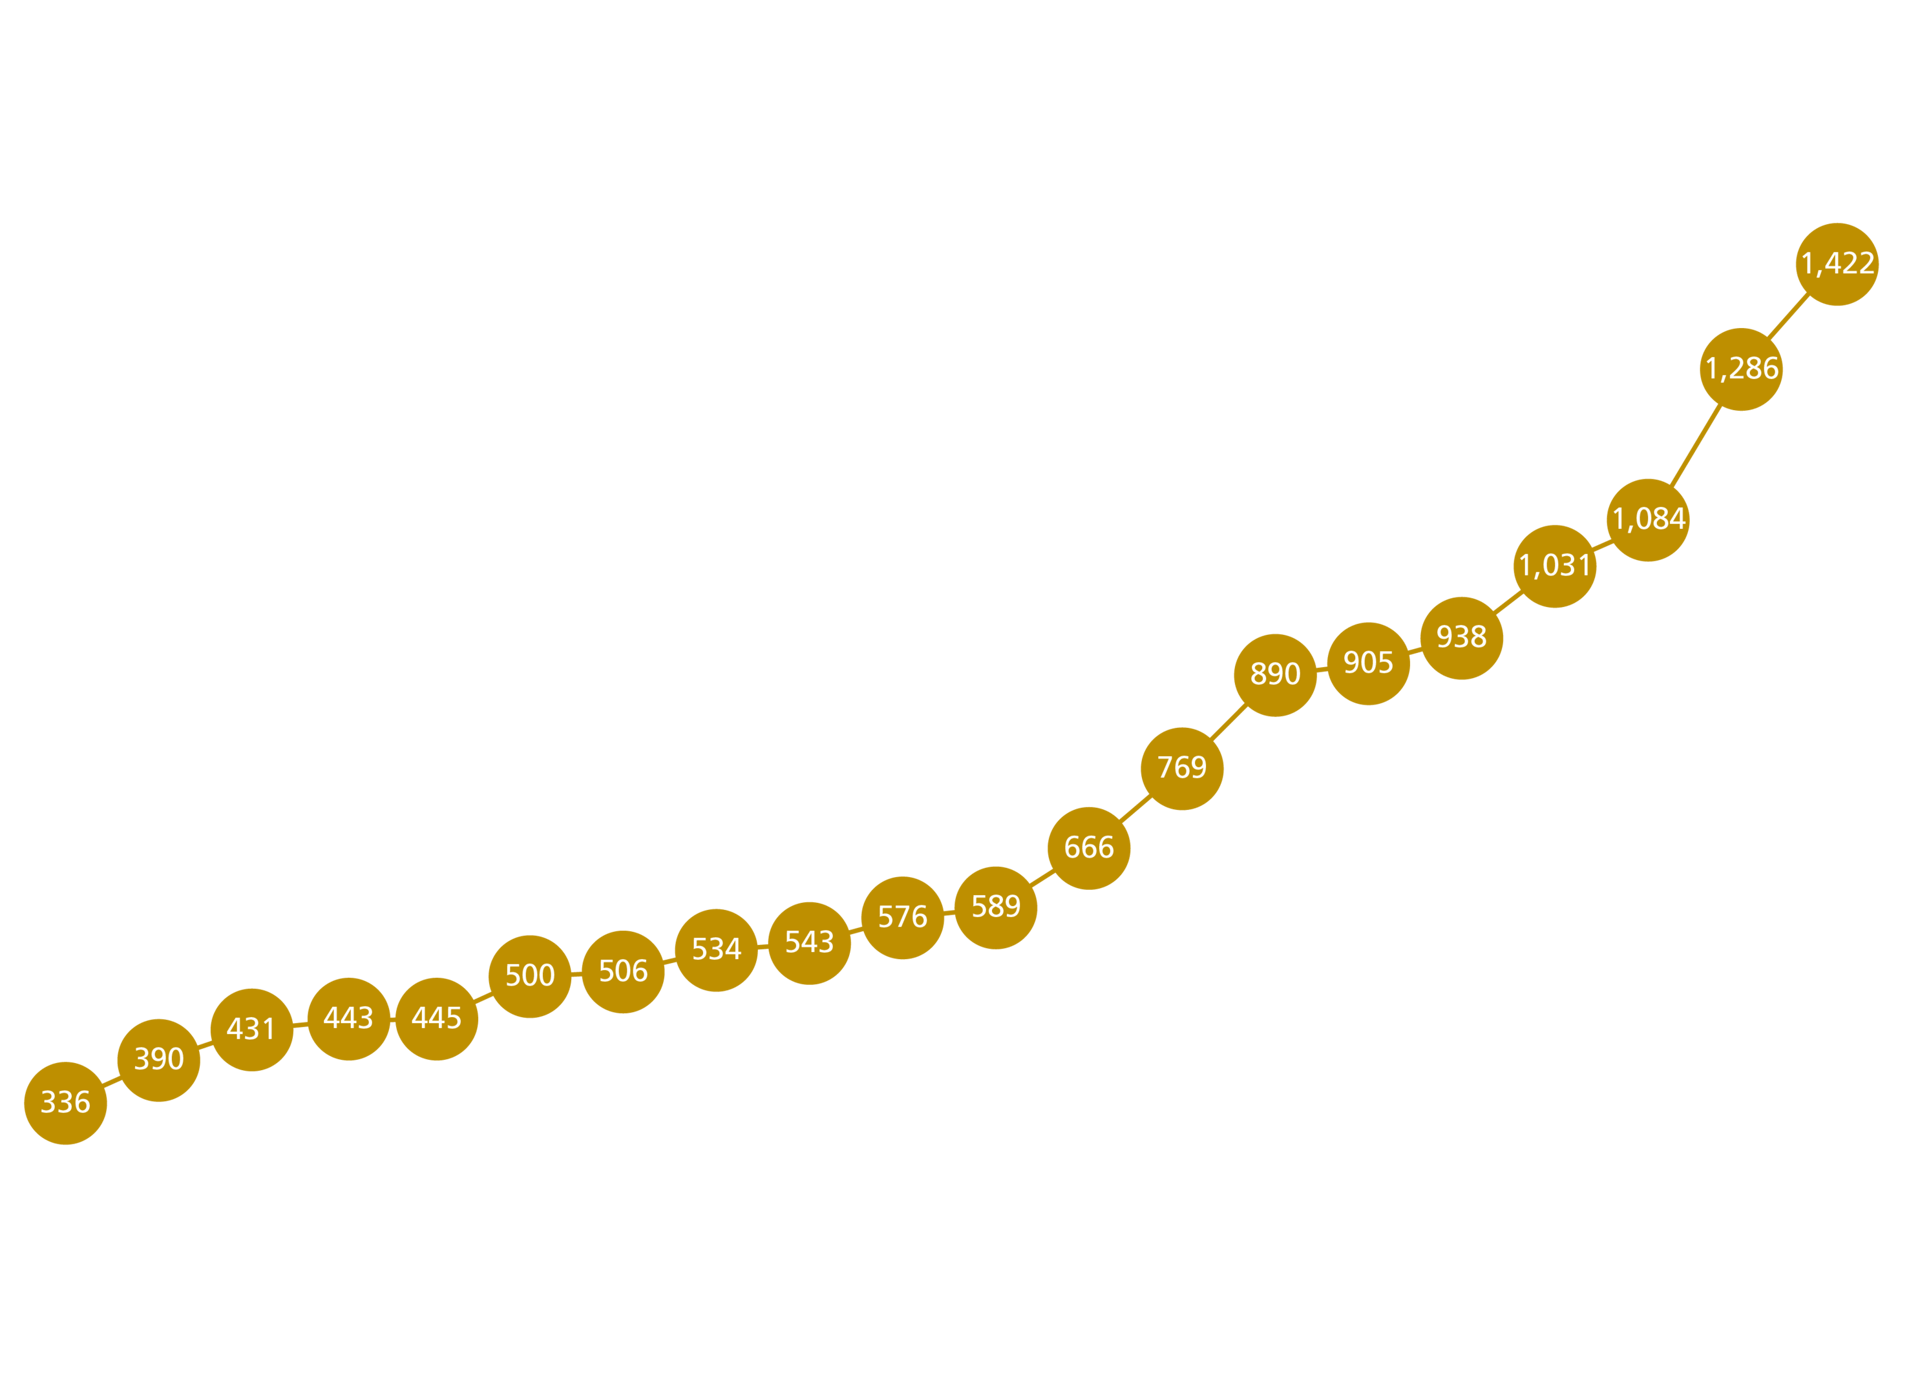
Transfer costs of squads (€m)
The 2023 year-end Manchester United squad cost €1.422m in transfer fees, beating the previous 2020 Real Madrid record.
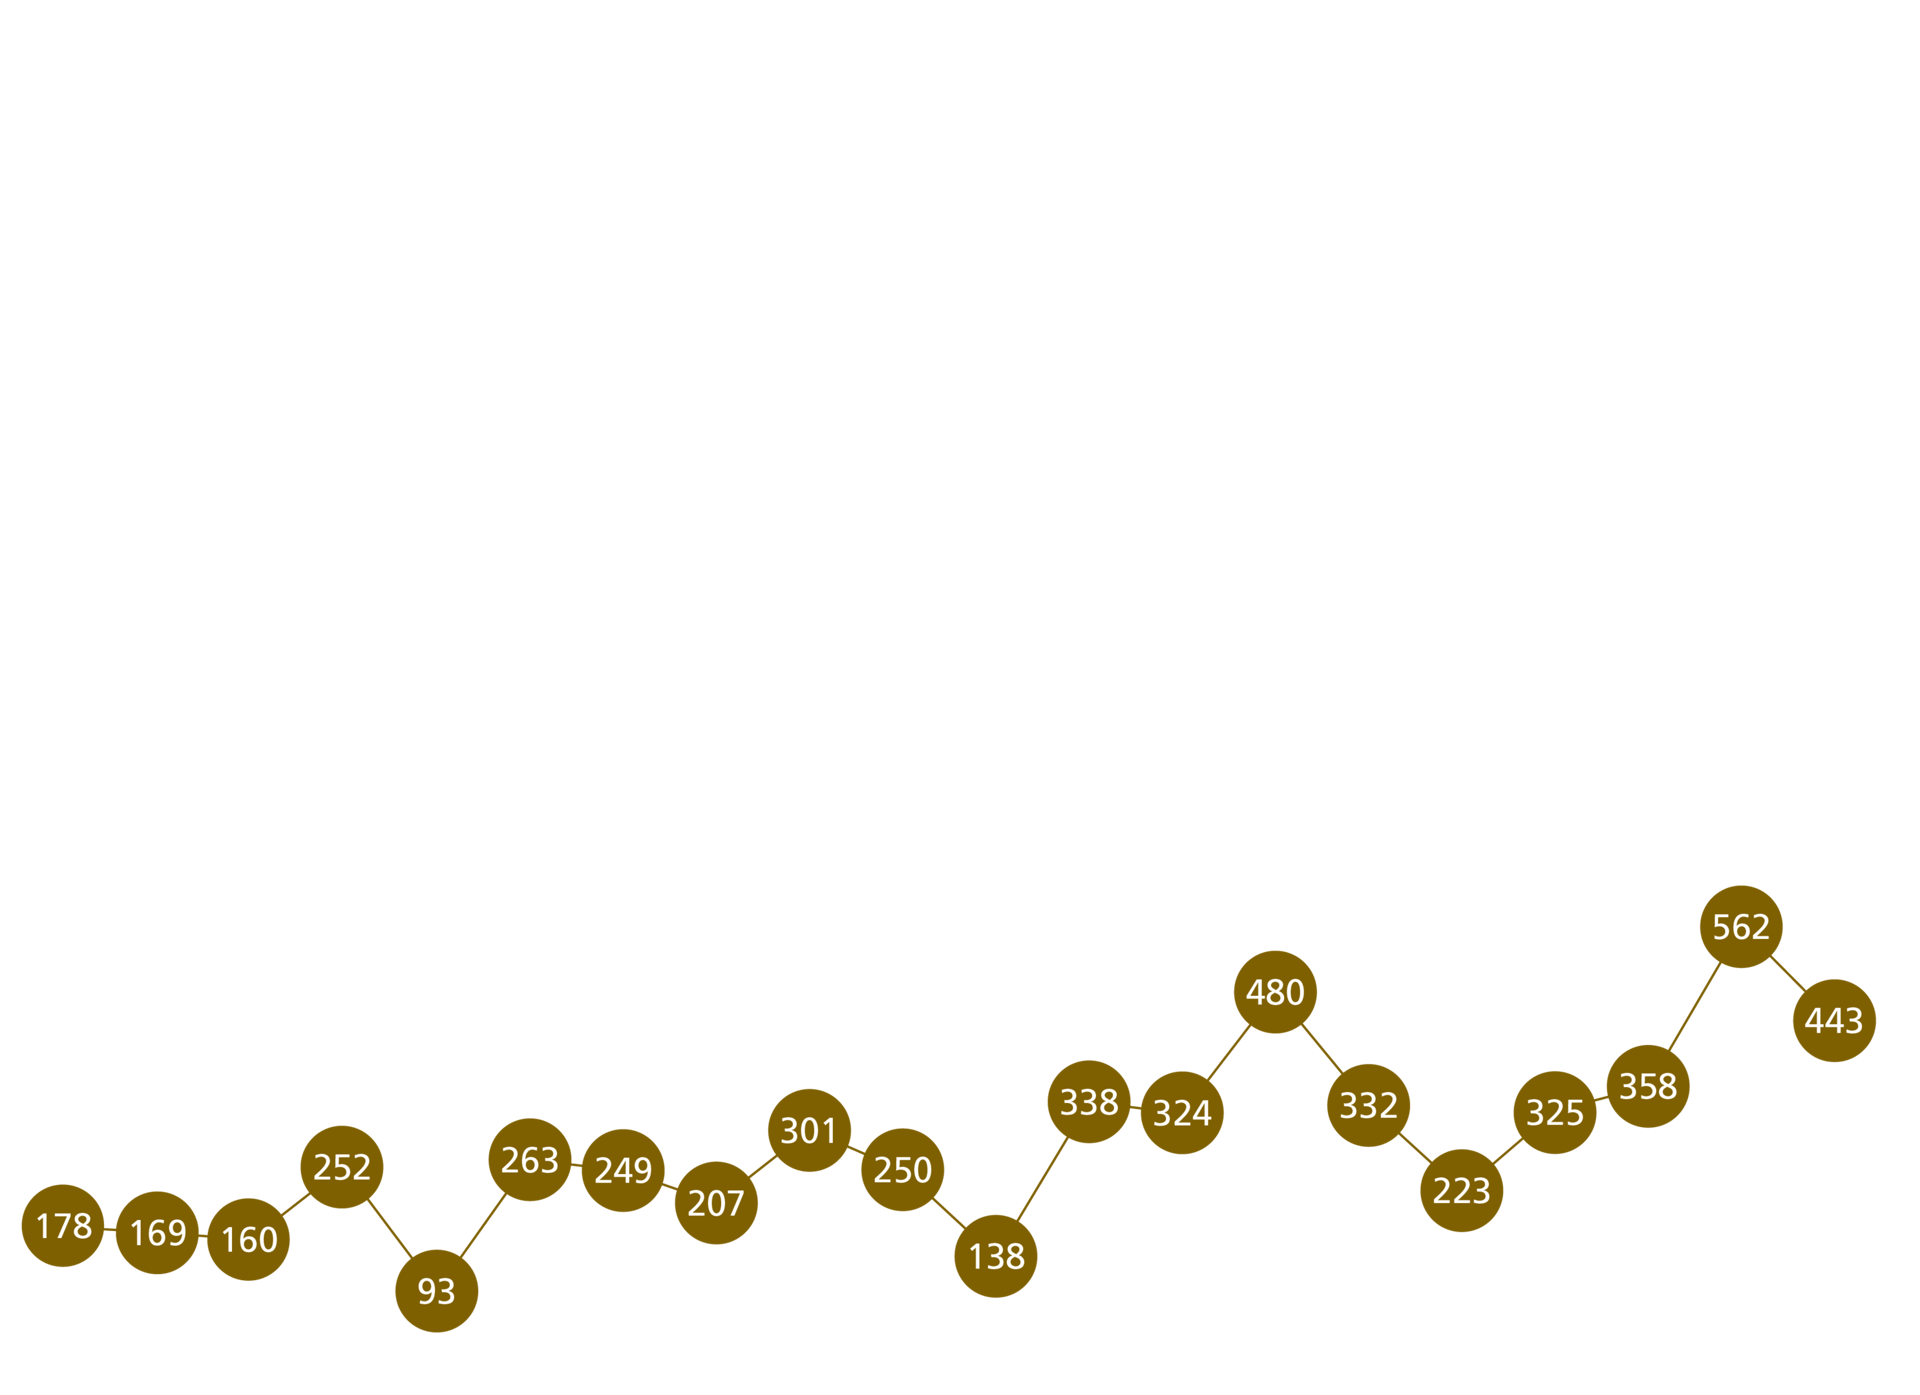
Balance Sheet Cost of Squads (€m)
The transfer fees appear as an asset of the club. The value is reduced across the contract of each player.
Total revenue (€m): 15 of the top 20 clubs reported their all-time record revenues in 2023
Gate revenue (€M): Gate revenues increased 31% in 2023 among the top 20 clubs
Gate revenue per fan (€M): The hospitality mix and ticketing prices dictate average income per match visit.
TOTAL wages €m: Player wages declined 1% in 2023 as clubs prepare for updated financial sustainability rules
Wage ratio: The wage to revenue ratio is the most common referenced metric for wage affordability
Transfer costs of squads (€m): The 2023 year-end Manchester United squad cost €1.422m in transfer fees, beating the previous 2020 Real Madrid record.
Balance Sheet Cost of Squads (€m): The transfer fees appear as an asset of the club. The value is reduced across the contract of each player.


The data is the latest available 2023 financial year-end data. The exceptions are Chelsea FC, Everton FC and Leicester City FC, for which data relates to 2022.


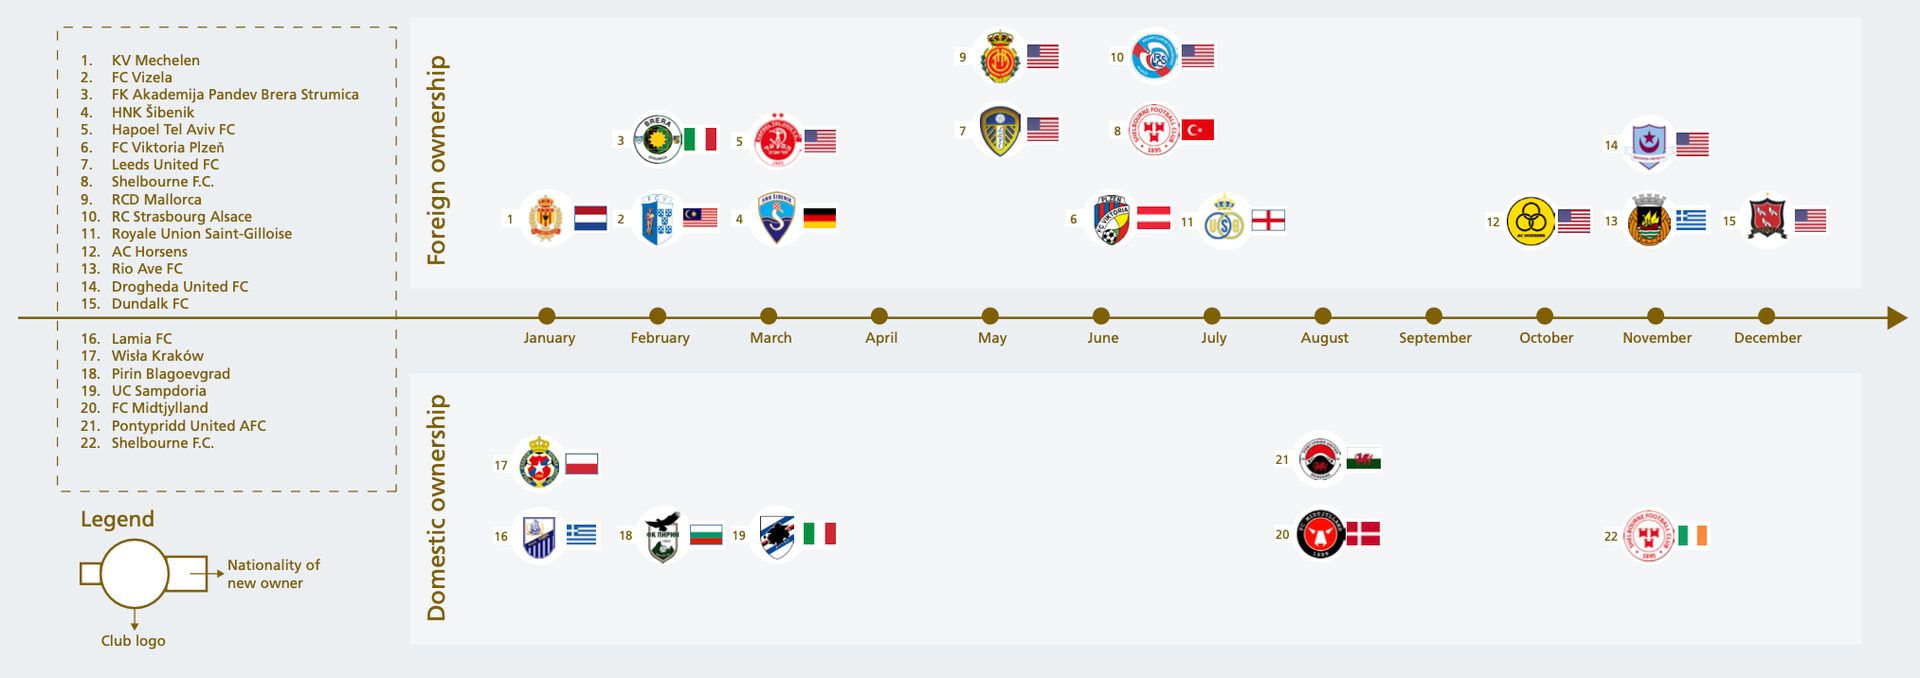
The number of changes of control / ownership at clubs reduced in 2023 after the pent-up pandemic buying frenzy in the second half of 2021 and throughout 2022.
Number of changes in European top-division clubs’ controlling ownership
9
14
8
18
15
15
18
29
Number of changes in European top-division clubs’ controlling ownership
14
9
8
18
15
15
18
29
The number of ownership changes for 2023 may edge upwards once all clubs submit their ownership information.
Nonetheless strong demand to buy into the authenticity of European club football continued from all corners of the world.
Timeline of top-division club takeovers in 2023
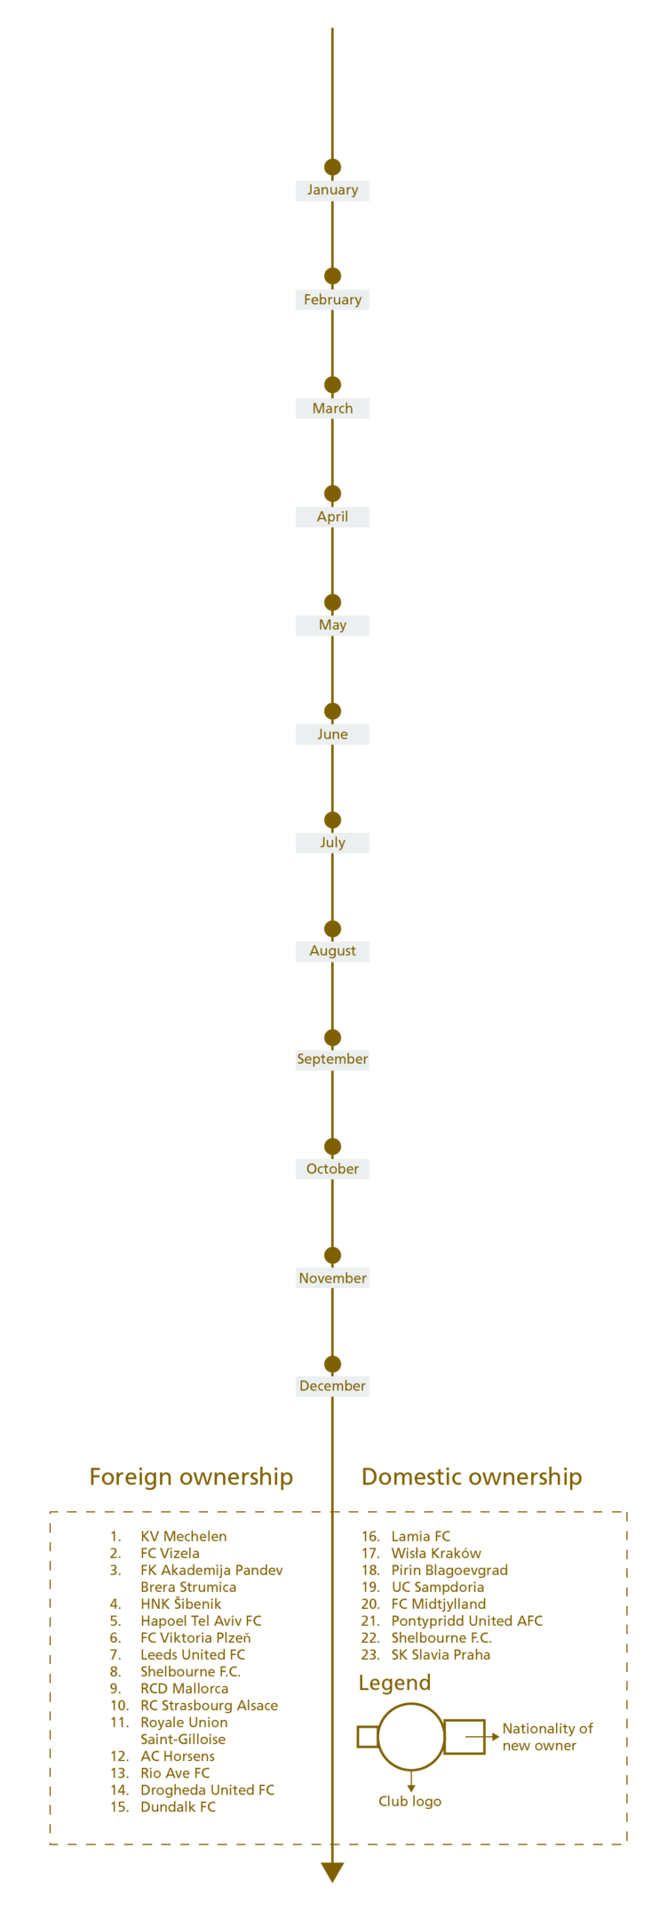


Nonetheless strong demand to buy into the authenticity of European club football continued from all corners of the world.


Every club failure is a local tragedy but the sheer resilience of European club football and the positive impact of tougher financial regulation, has never been better demonstrated with less than 0.5% club failure rate during the last two years despite the €7bn of lost revenues from the pandemic.
15
23
17
35
25
24
16
30
23
8
20
6
20
10
7
7
Annual average insolvency events across the four-year period
14
11
23
24
6
20
10
7
7
15
23
17
35
25
24
16
30
23
8
20
Annual average insolvency events across the four-year period
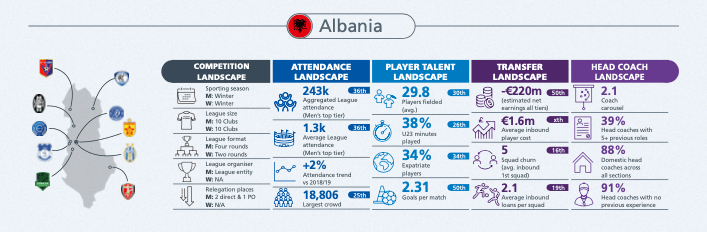
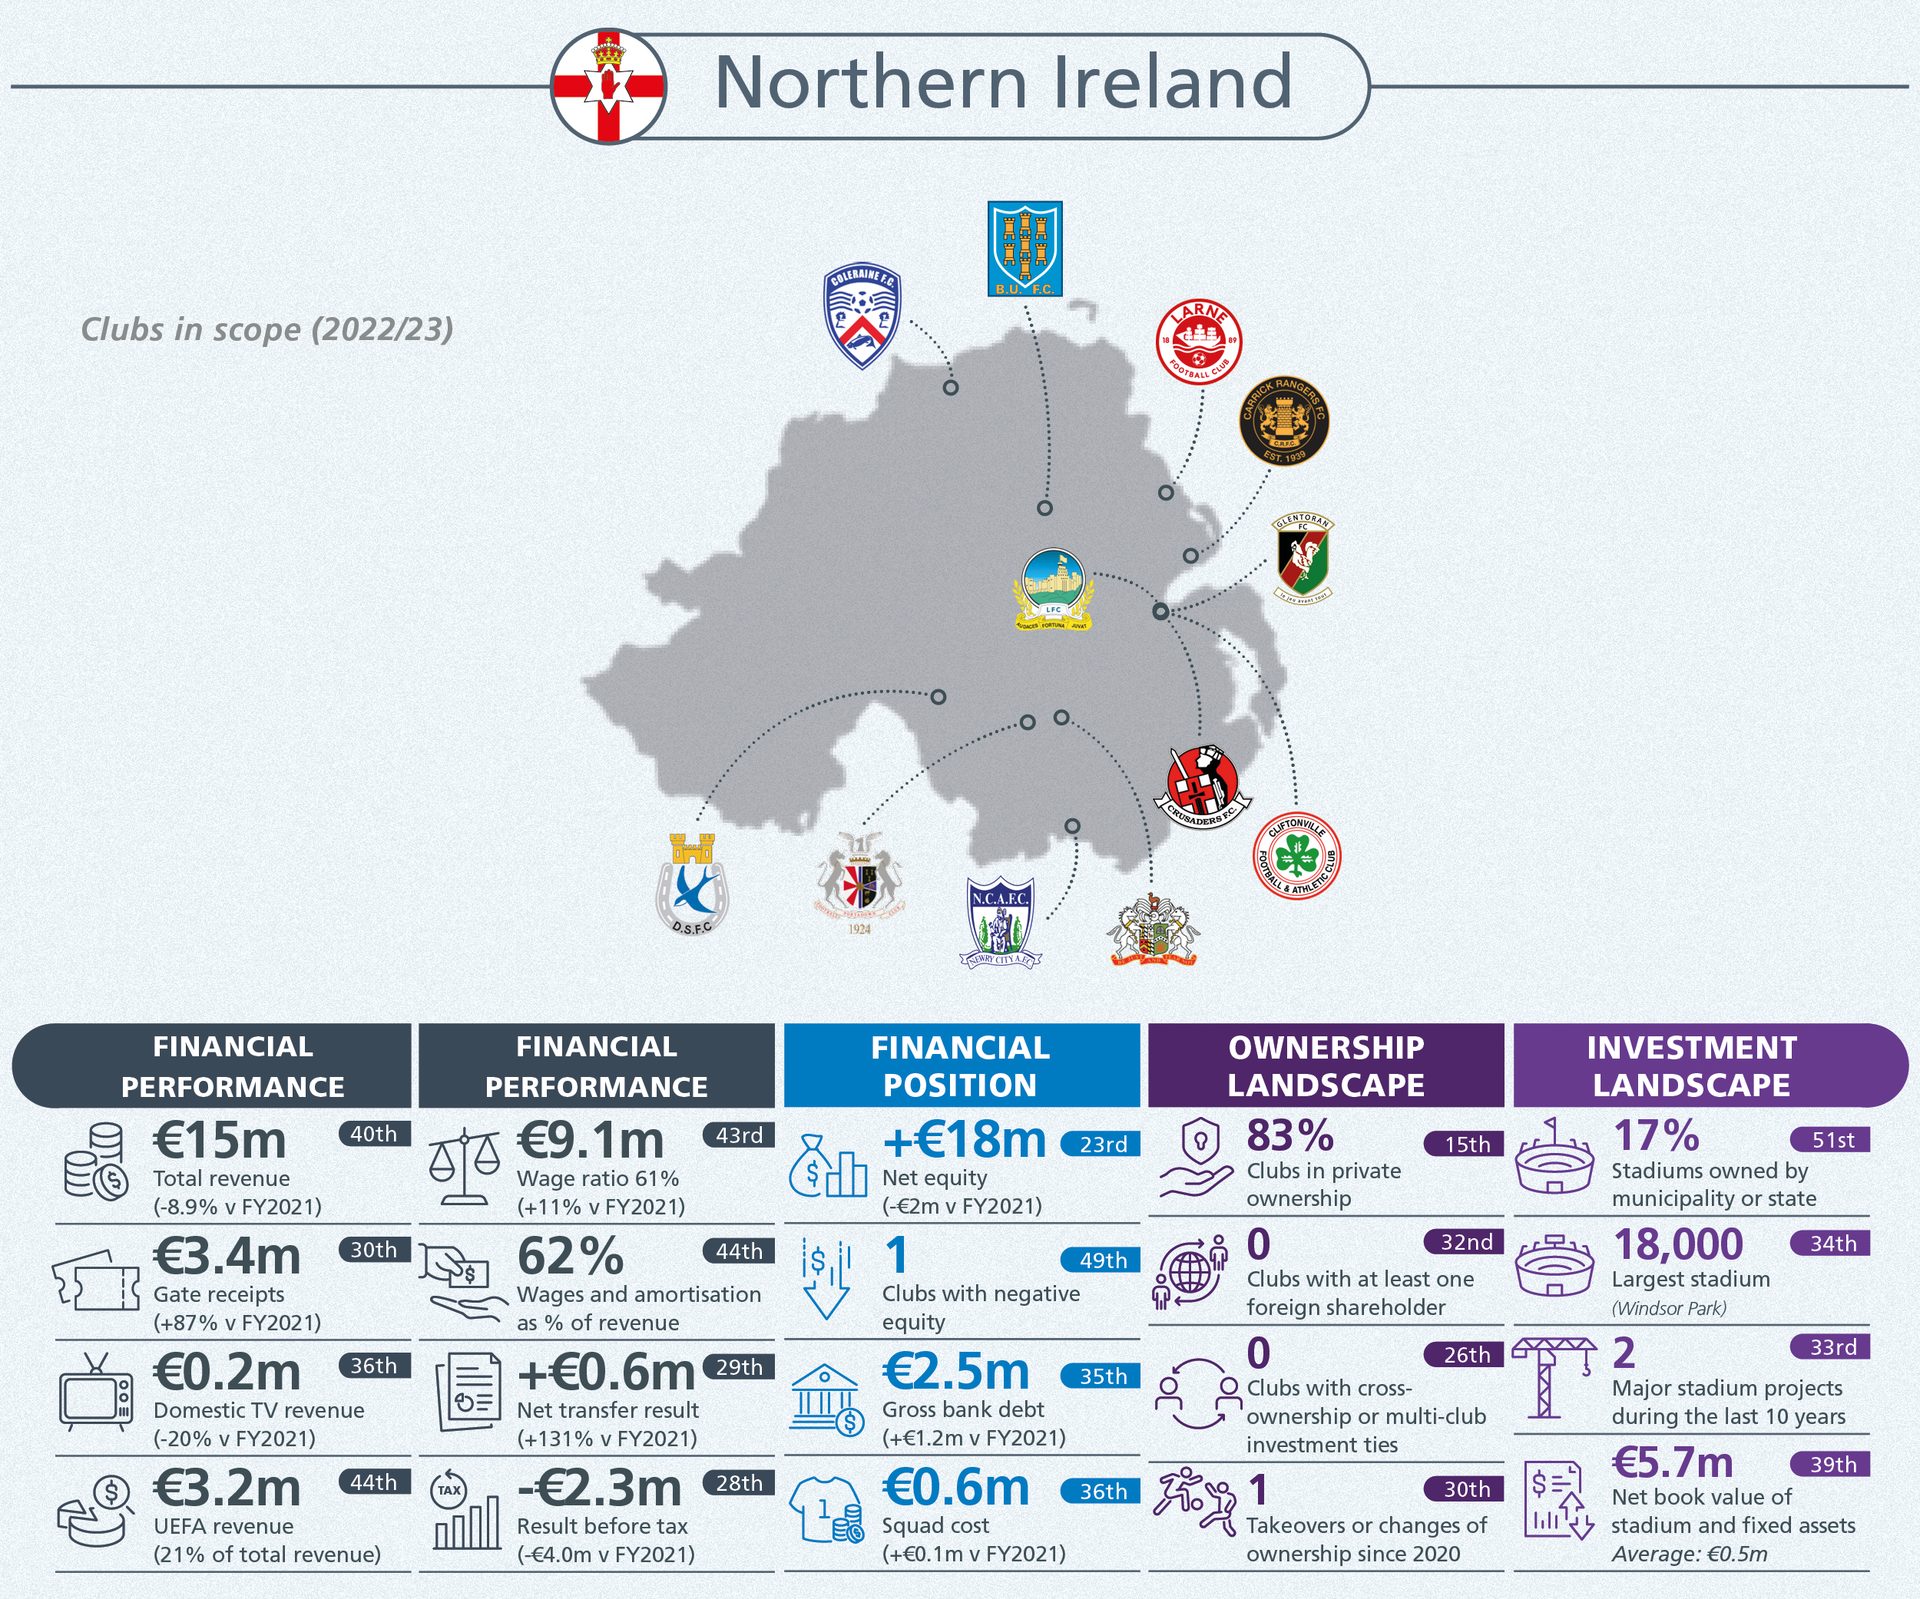
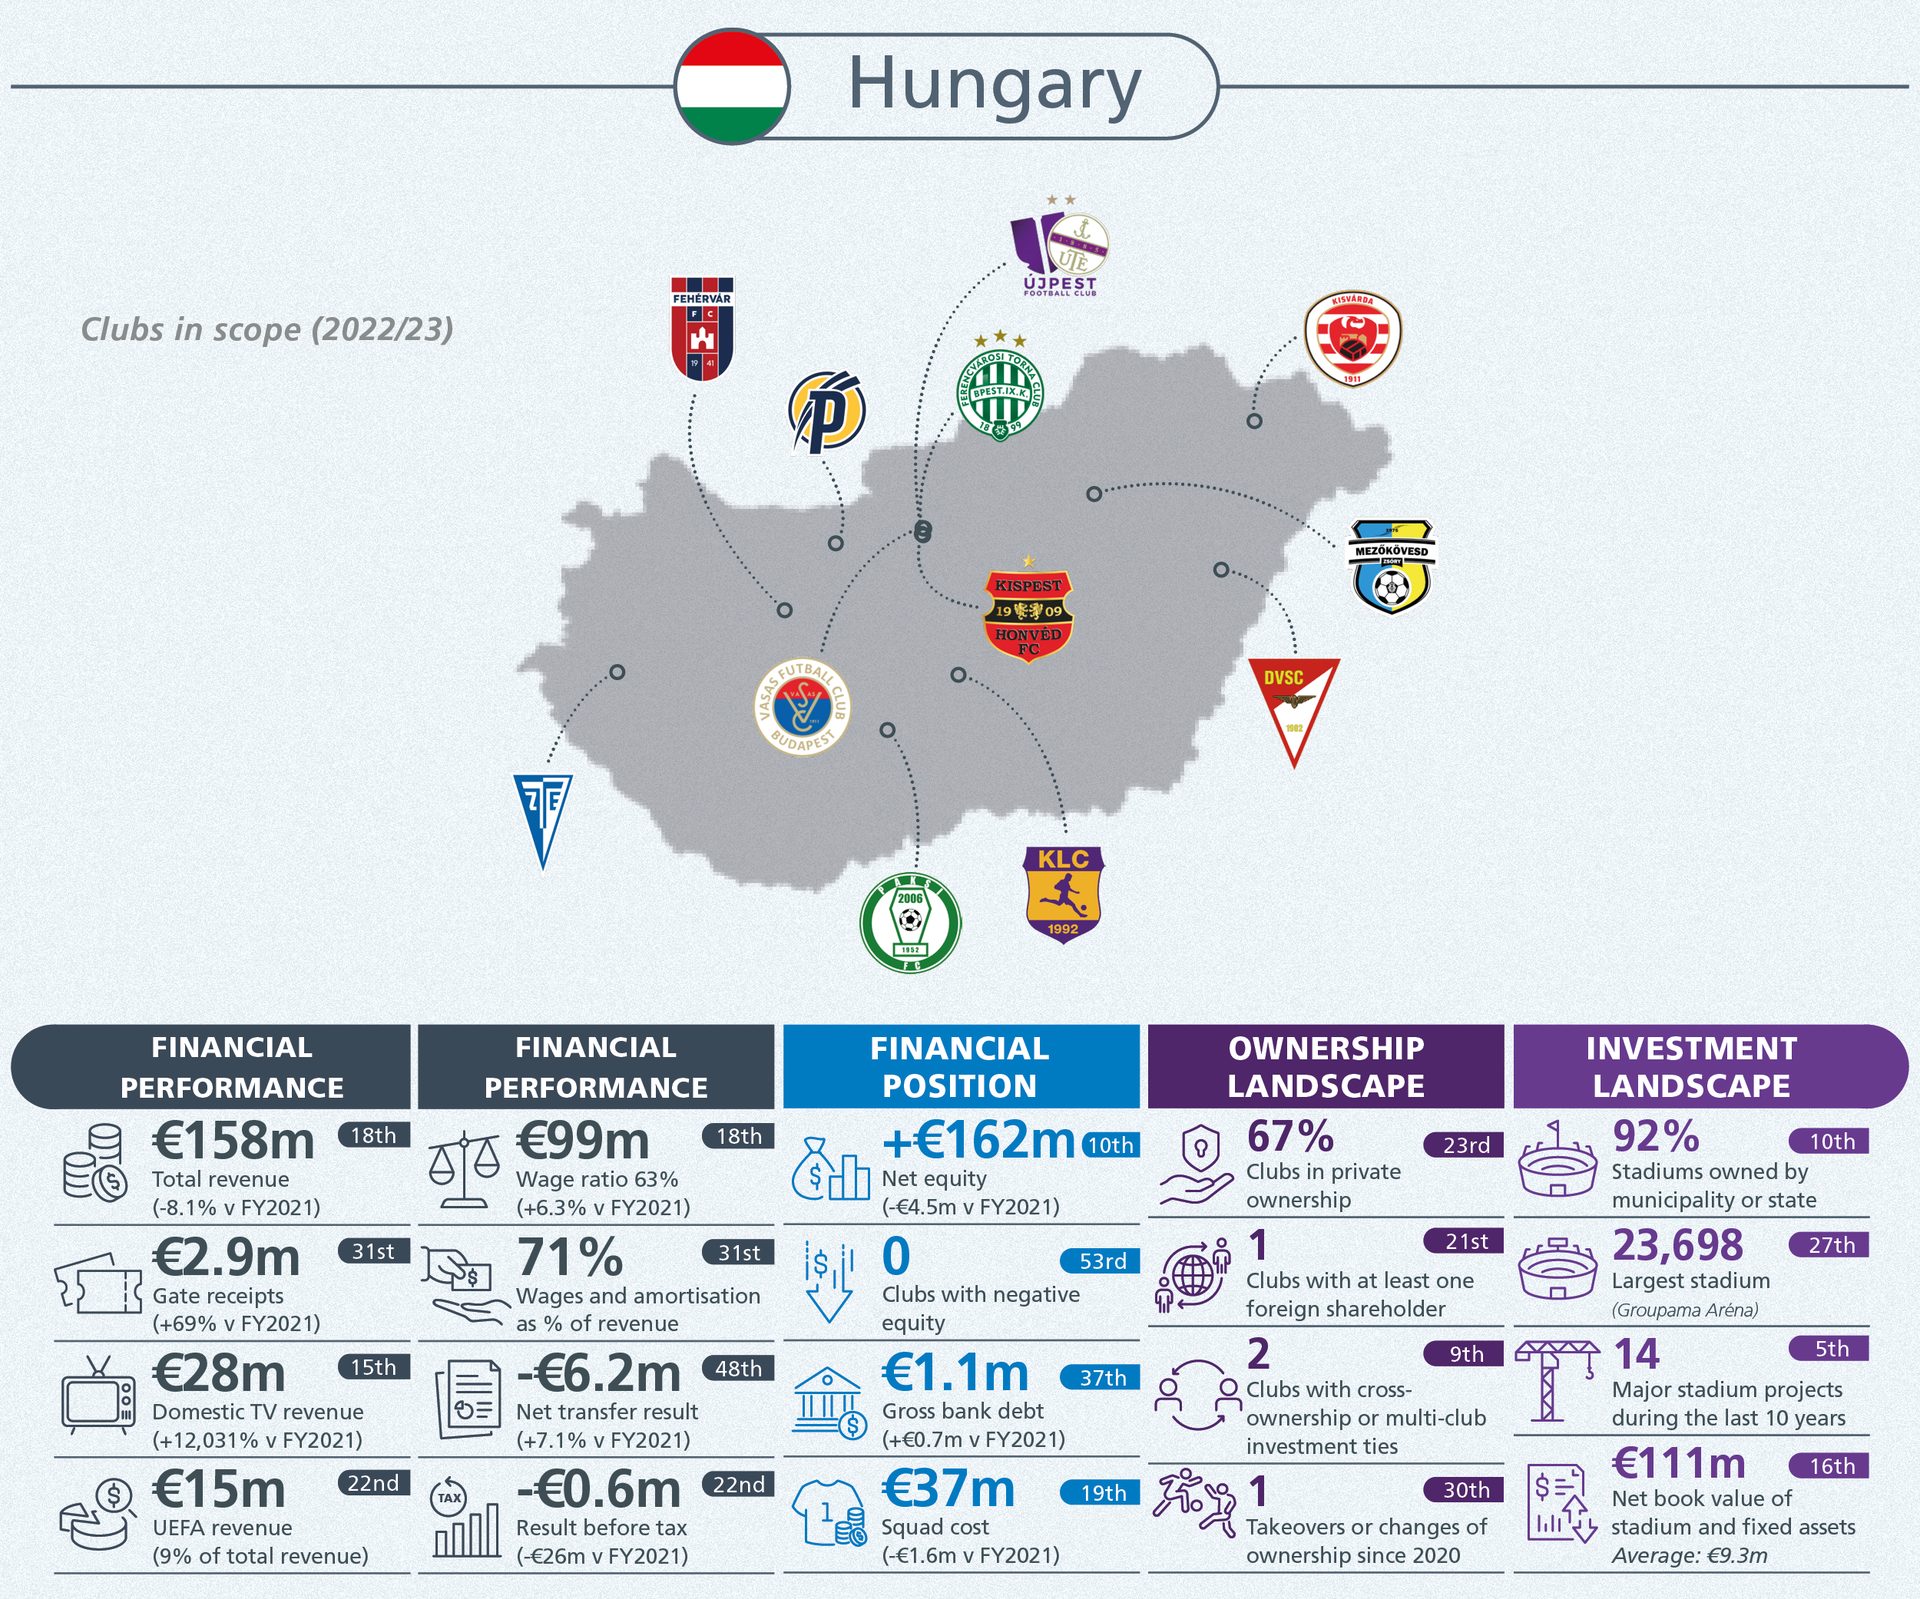
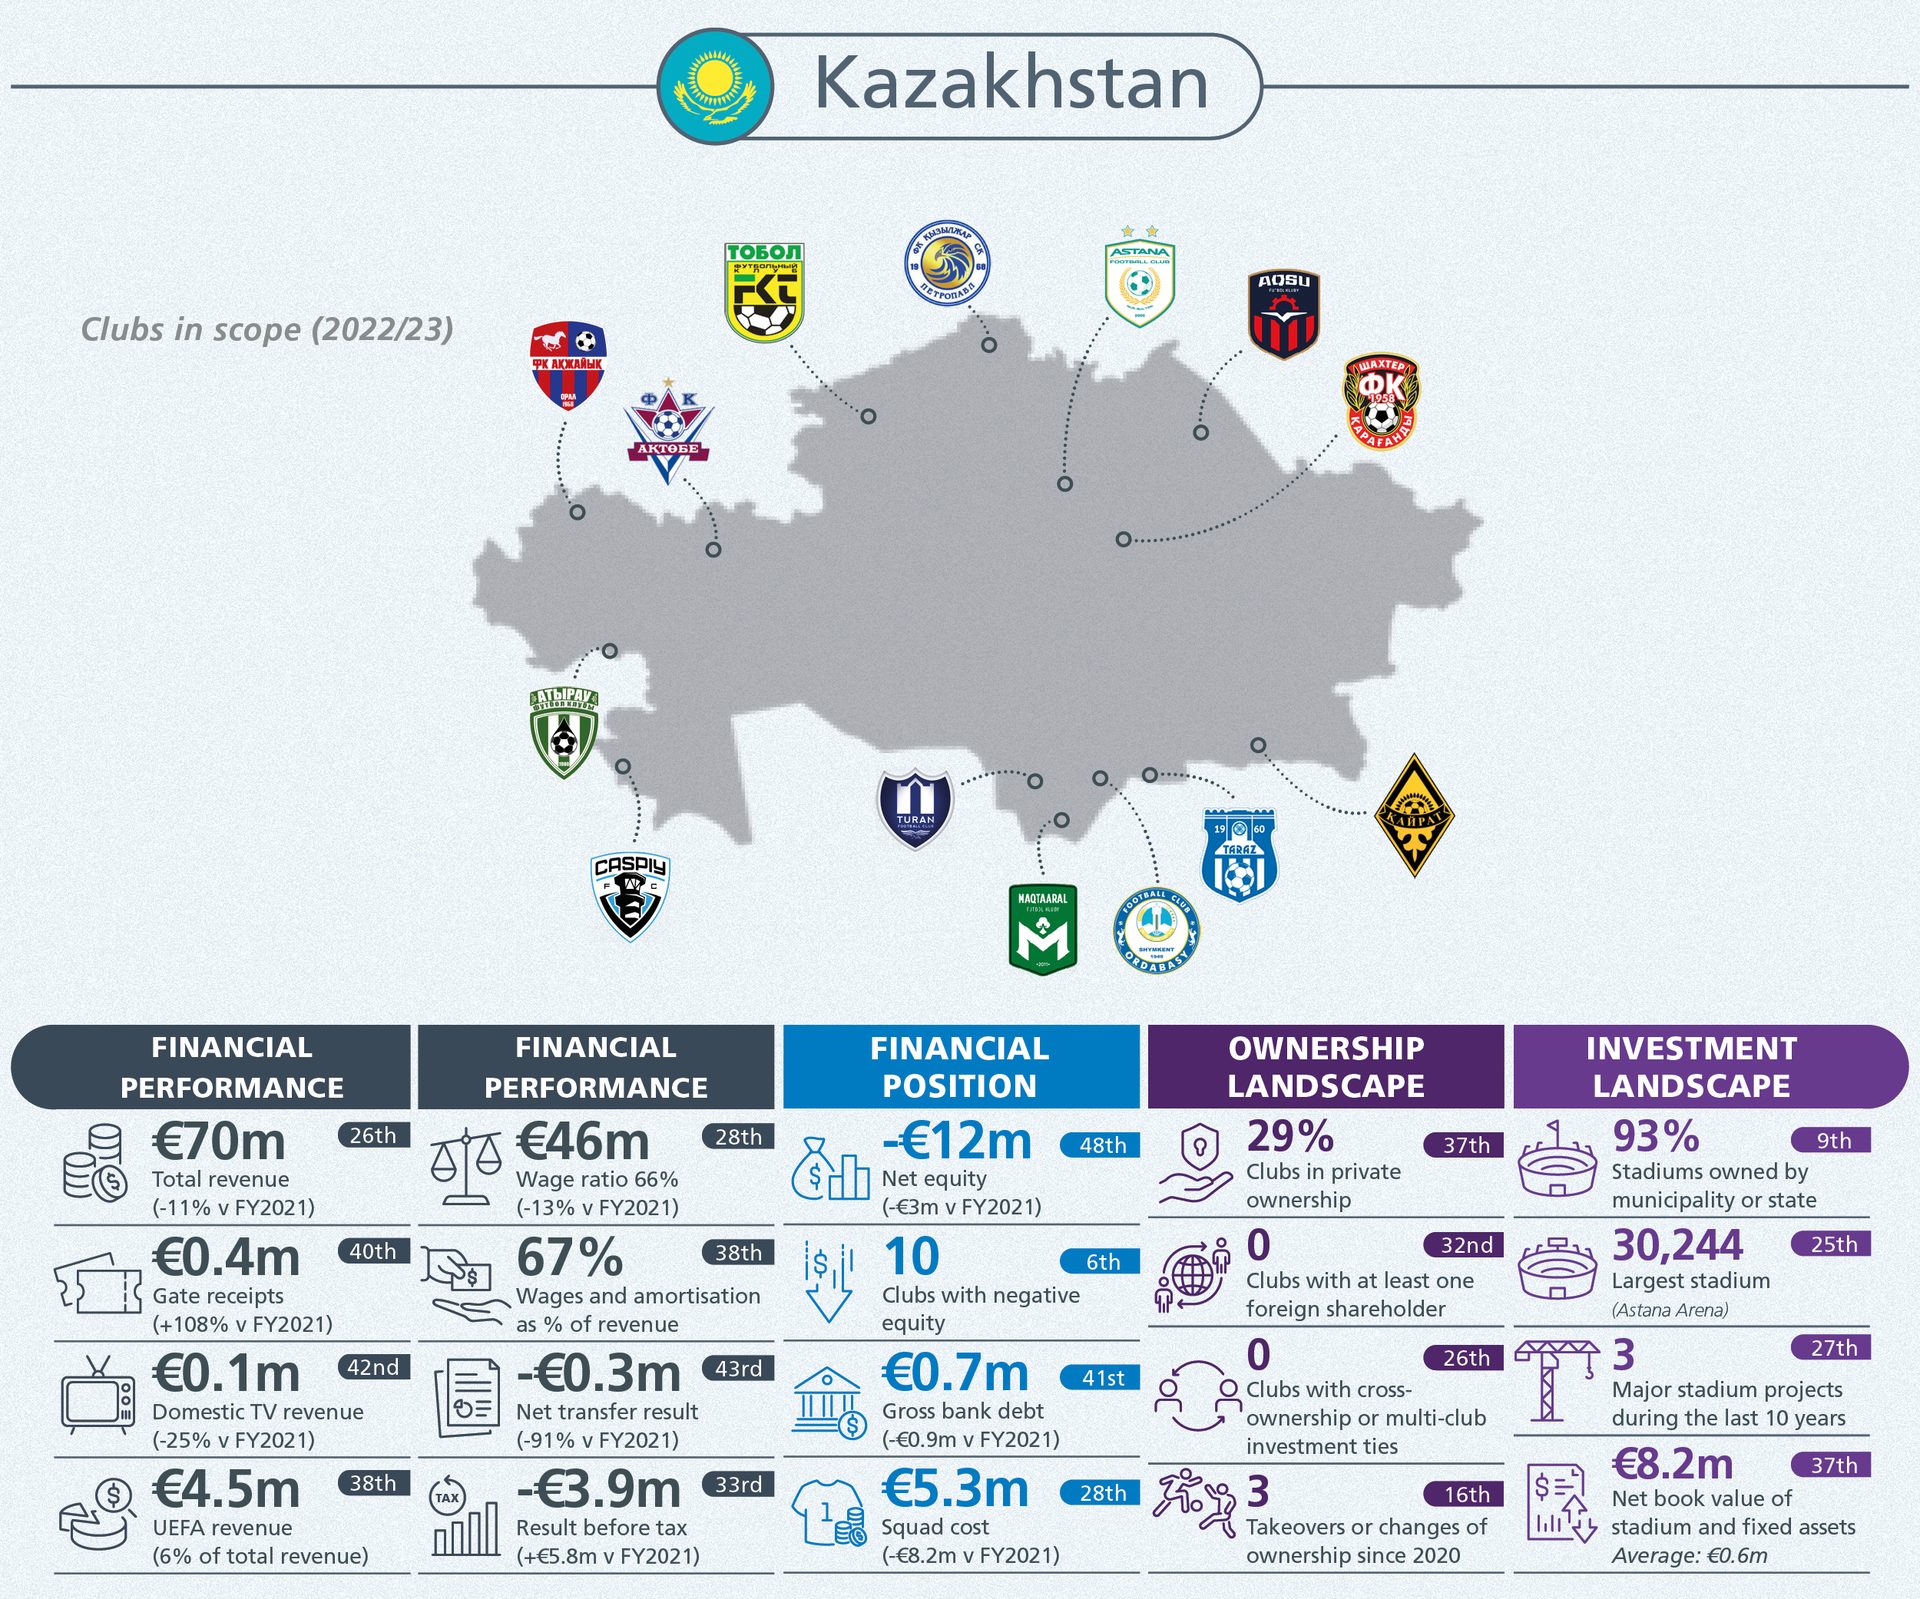
The report covers much more than just the biggest clubs and leagues. More than 700 clubs per year are analysed providing a 360 degree snapshot that is aggregated and can be explored below.
Click on each country to view benchmark statistics.