Финансово-инвестиционная ситуация в европейском клубном футболе
Листайте дальше, чтобы узнать больше
Представляем основные выводы из последнего отчета о финансовом состоянии европейских футбольных клубов.

Подробный анализ, в том числе обзор 25 ведущих клубов по каждому финансовому показателю и данные по всем 55 ассоциациям-членам УЕФА, см. в полном тексте отчета.

Скачать отчет

По прогнозам, выручка клубов высших дивизионов превысила
30 млрд €
30 млрд €
в 2025 году
Все потоки выручки продолжают расти


Выручка от коммерческой деятельности
рост на
Выручка от продажи билетов
рост на
Выручка от телетрансляций
рост на
Выручка от УЕФА
также значительно выросла:
прогнозируемый рост

Выручка клубов

Из 25 ведущих клубов:
клубов сообщили в 2025 году о рекордной выручке от коммерческой деятельности
клубов сообщили о годовом росте выручки от коммерческой деятельности на более чем 10%
В полном тексте отчета представлены 12 сравнений клубов по различным показателям, включая общую выручку, заработную плату игроков и совокупные трансферные расходы на команду.
25
24
23
22
21
20
19
18
17
16
15
14
13
12
11
10
9
8
7
6
5
4
3
2
1
74
80
80
81
83
90
122
123
124
138
141
158
159
162
223
237
298
313
349
382
384
402
426
499
568
Выручка от коммерческой деятельности в 2025 году (млн €)
Однако эти общие цифры скрывают всю правду…
Качество источников выручки варьируется. Рост выручки в значительной степени обусловлен трудо- и ресурсоемкими направлениями получения выручки, такими как продажа атрибутики, лицензирование, продажа билетов премиум-класса и проведение мероприятий на стадионах.
Диверсификация, безусловно, приветствуется, однако зачастую такие потоки выручки сопряжены с более высокими затратами и их сложнее гарантировать.
Расходы клубов
Рост операционных расходов, не связанных с заработной платой, в очередной раз опережает рост выручки.
Теперь они поглощают 36% выручки клубов, что является самым высоким показателем за последние 15 лет.
Расходы на заработную плату неигрового персонала также увеличились (на 8%). Это обусловлено увеличением числа штатных сотрудников и соответствующей инфляцией заработной платы.
С периода пандемии расходы на финансирование выросли более чем на 50%.
Клубы лучше, чем в прошлом, осуществляют управление своим главным активом — игроками.
Заработная плата игроков выросла в 2025 году всего на 1,8%.
Клубы стали лучше управлять контрактами игроков для предотвращения убытков.
Отслеживание более 4000 игроков свидетельствует о том, что лишь 3–4% стоимости активов в виде игроков теряется при их уходе из клубов в качестве свободных агентов.
В пяти из двадцати ведущих лиг, включая Испанию и Францию, расходы на заработную плату игроков снизились.


Неблагоприятные тенденции

Расходы клубов
Прибыльность
Такое давление со стороны затрат означает, что рекордная выручка и прибыль от трансферов необязательно приводят к прибыльности клубов.
Нажмите здесь, чтобы подробно изучить показатели прибыльности клубов
В 2024 году был зафиксирован рекордный трансферный доход в размере
en 2024.
Кроме того…
Чистые трансферные расходы существенно снизились |
С
в 2023
году
До
в 2024
году
Однако значительные убытки сохраняются… |
Совокупные убытки клубов высших дивизионов до уплаты налогов в 2024 году сократились лишь незначительно |
С
в 2023
году
До
в 2024
году
Mais la situation générale tend à s’améliorer. |
Процент клубов высших дивизионов, отчитавшихся о прибыли до уплаты налогов:
2021
2022
2023
2024
2025*

Прибыльность
*Клубы, предоставляющие отчетность досрочно
Доля клубов высших дивизионов, сообщивших о прибыли до уплаты налогов (в 20 ведущих лигах)
Клубы, сообщившие о прибыли
Клубы, сообщившие об убытках
Доля клубов высших дивизионов, сообщивших о прибыли до уплаты налогов (в 20 ведущих лигах)
Инвестиции
В 2025 году европейский футбол продолжал привлекать устойчивый интерес инвесторов, однако динамика изменилась.
После рекордных показателей, наблюдавшихся во время пандемии, количество сделок по поглощению клубов высших дивизионов стабилизировалось. |
Для получения доли в европейском футболе инвесторы все чаще обращают внимание на команды низших дивизионов и миноритарные пакеты. |
В 2025 году были приобретены контрольные пакеты акций 29 европейских клубов высших дивизионов
В 2025 году контрольные пакеты клубов высших дивизионов получили девять новых американских инвесторов
В общей сложности в Европе в 2025 году было выявлено 111 сделок
Объемы вливаний капитала и инвестиций в инфраструктуру также достигли рекордных уровней. |

Инвестиции
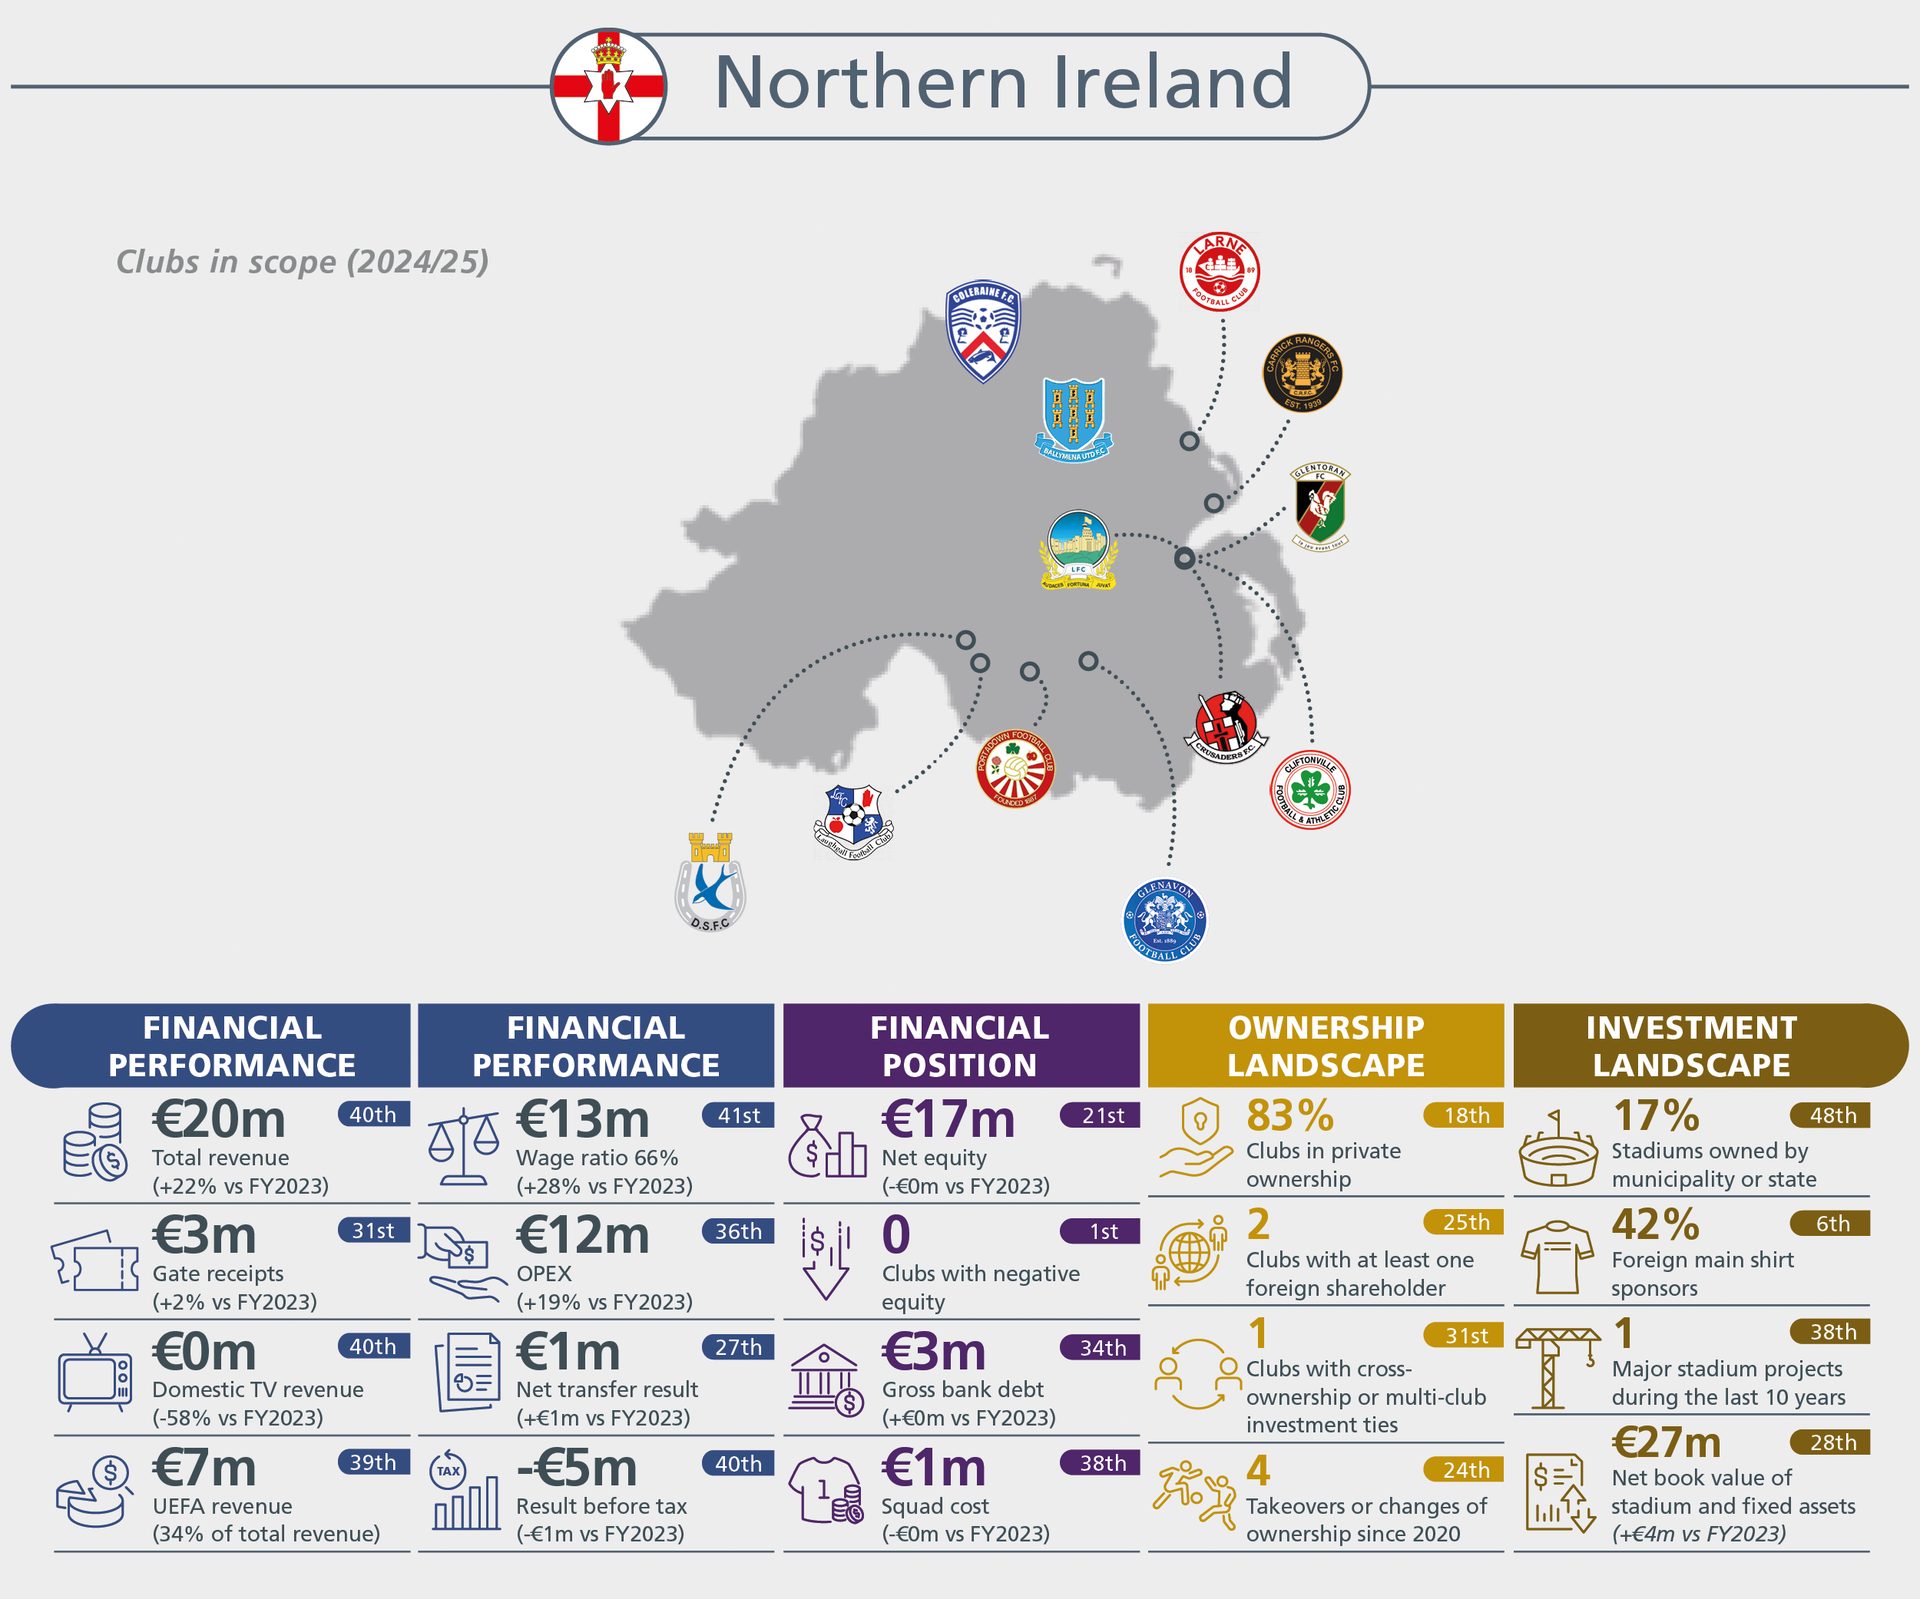
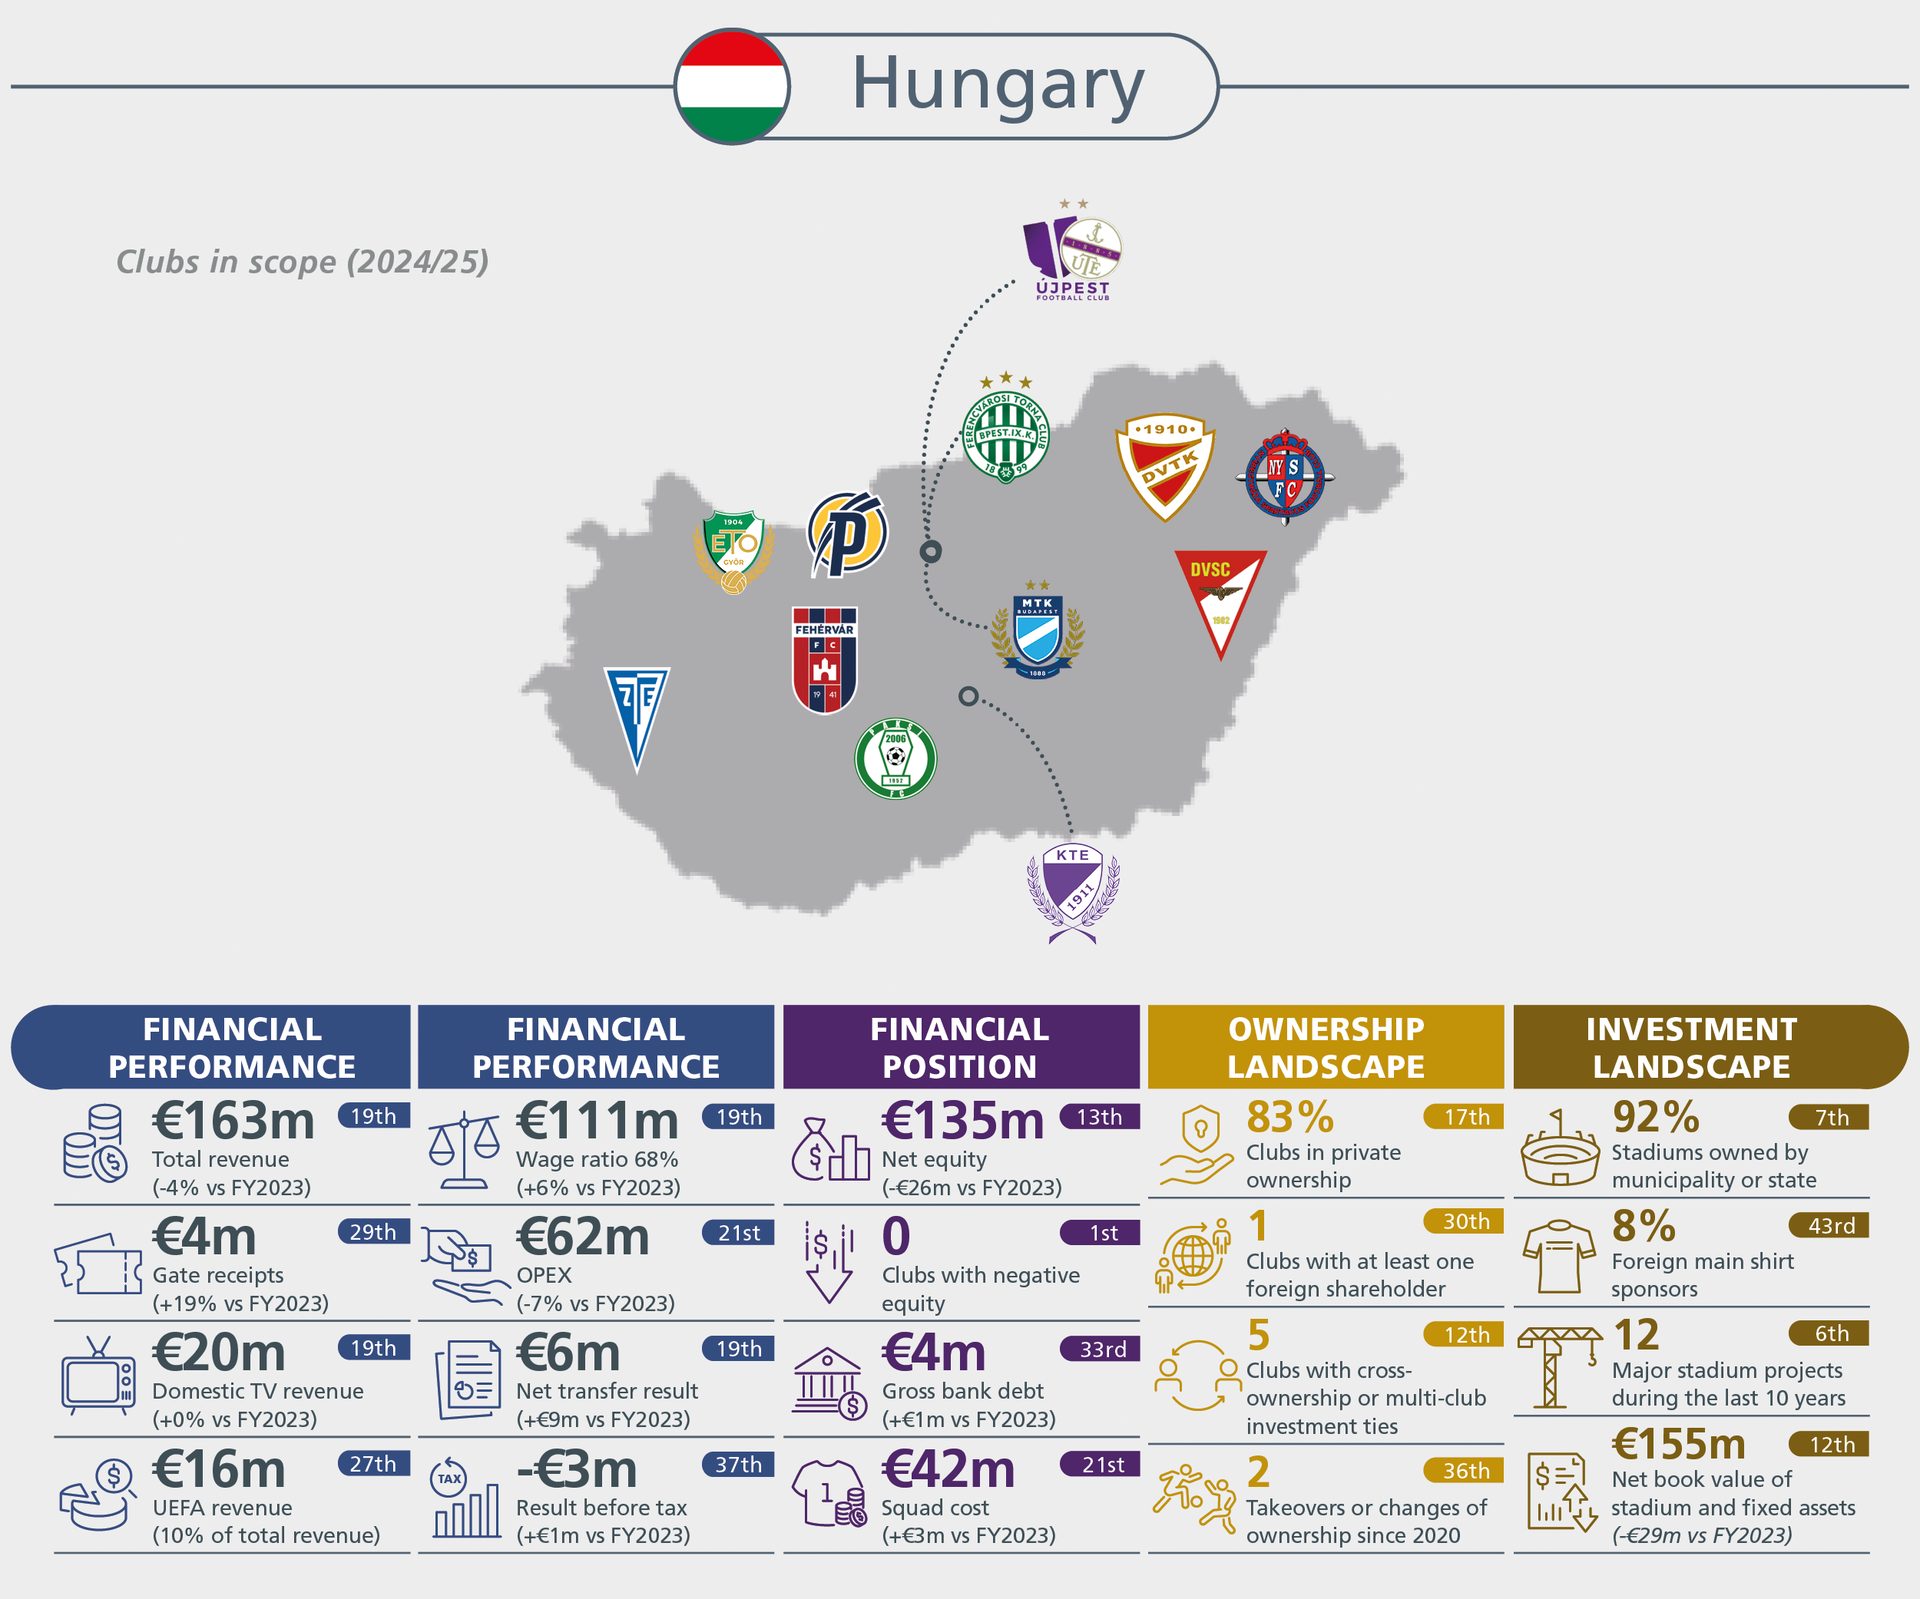
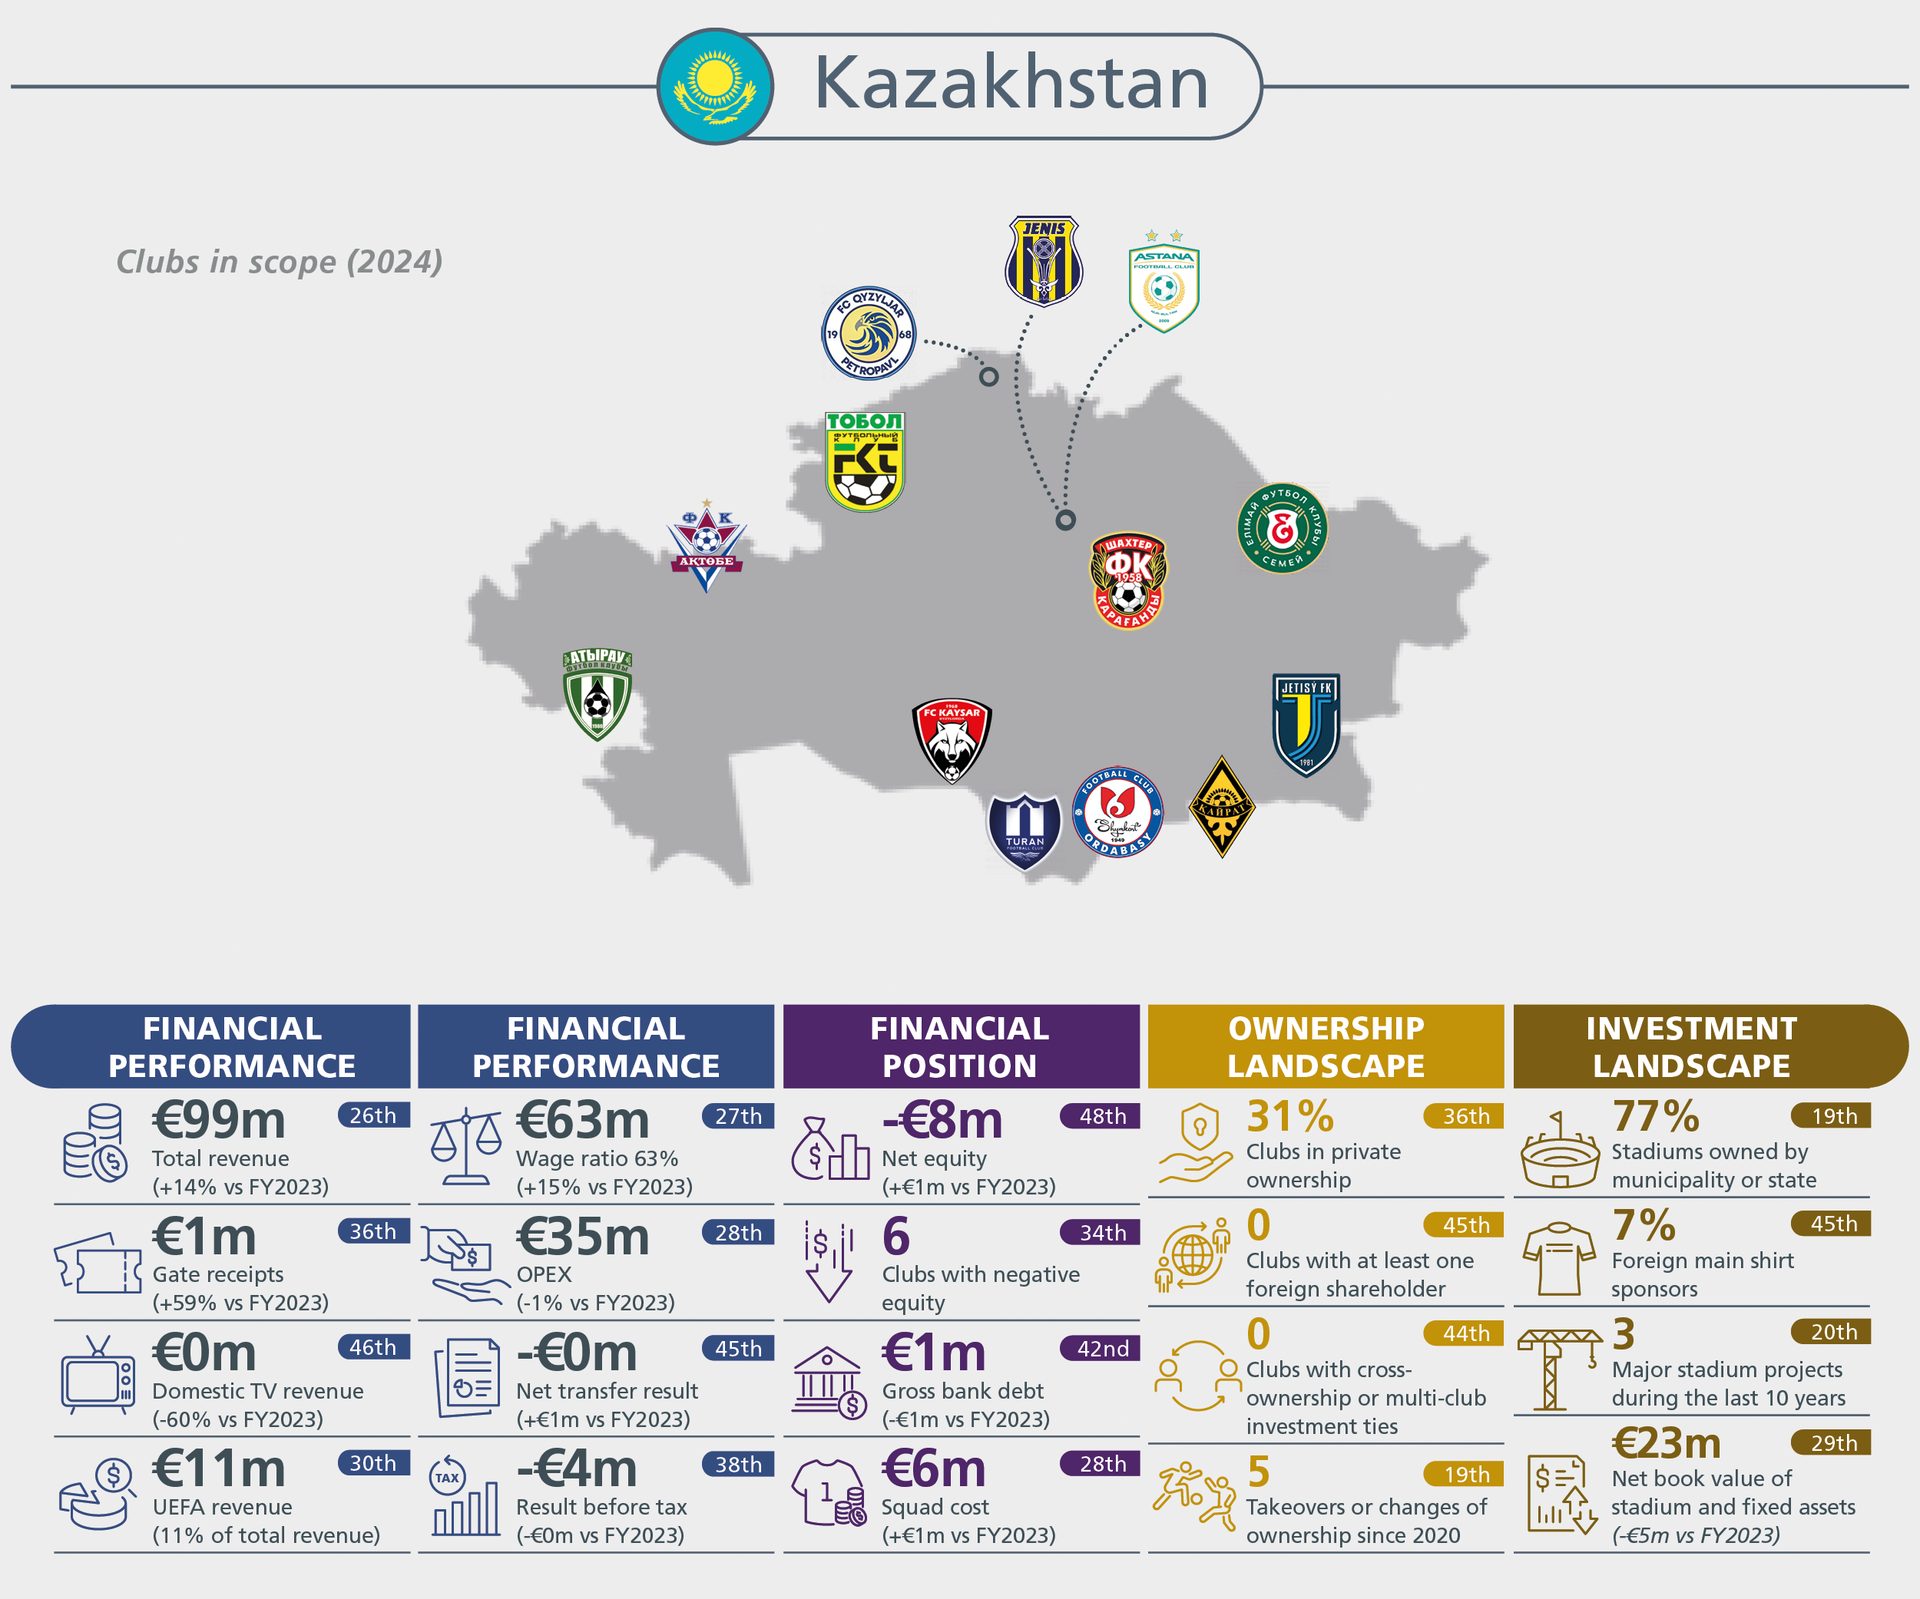
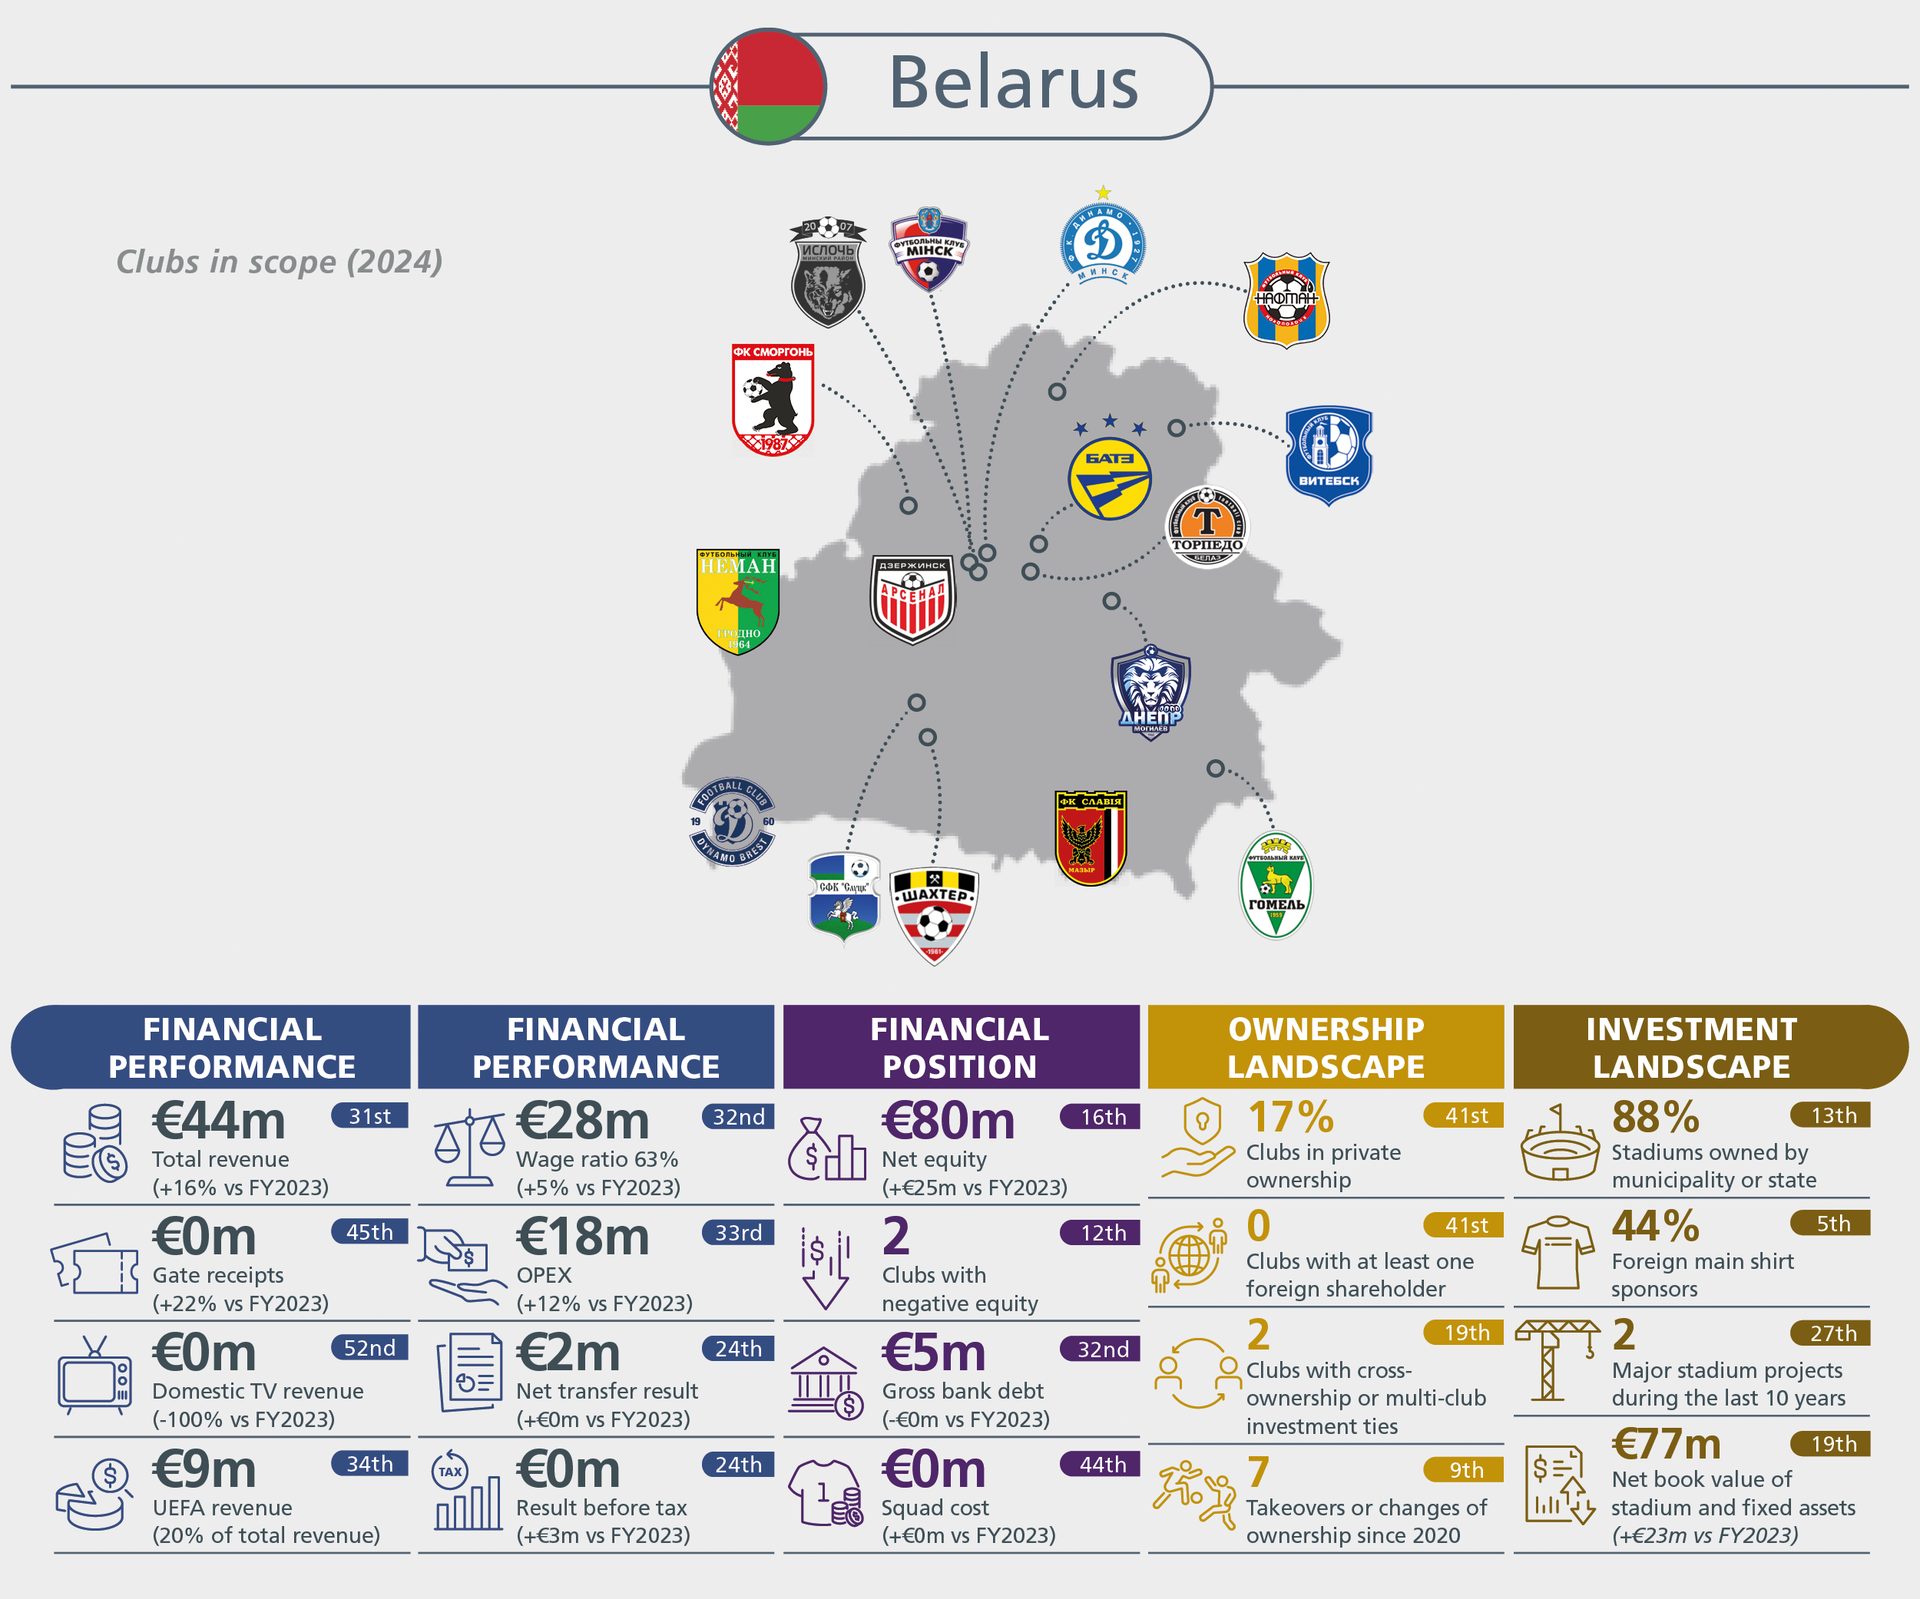
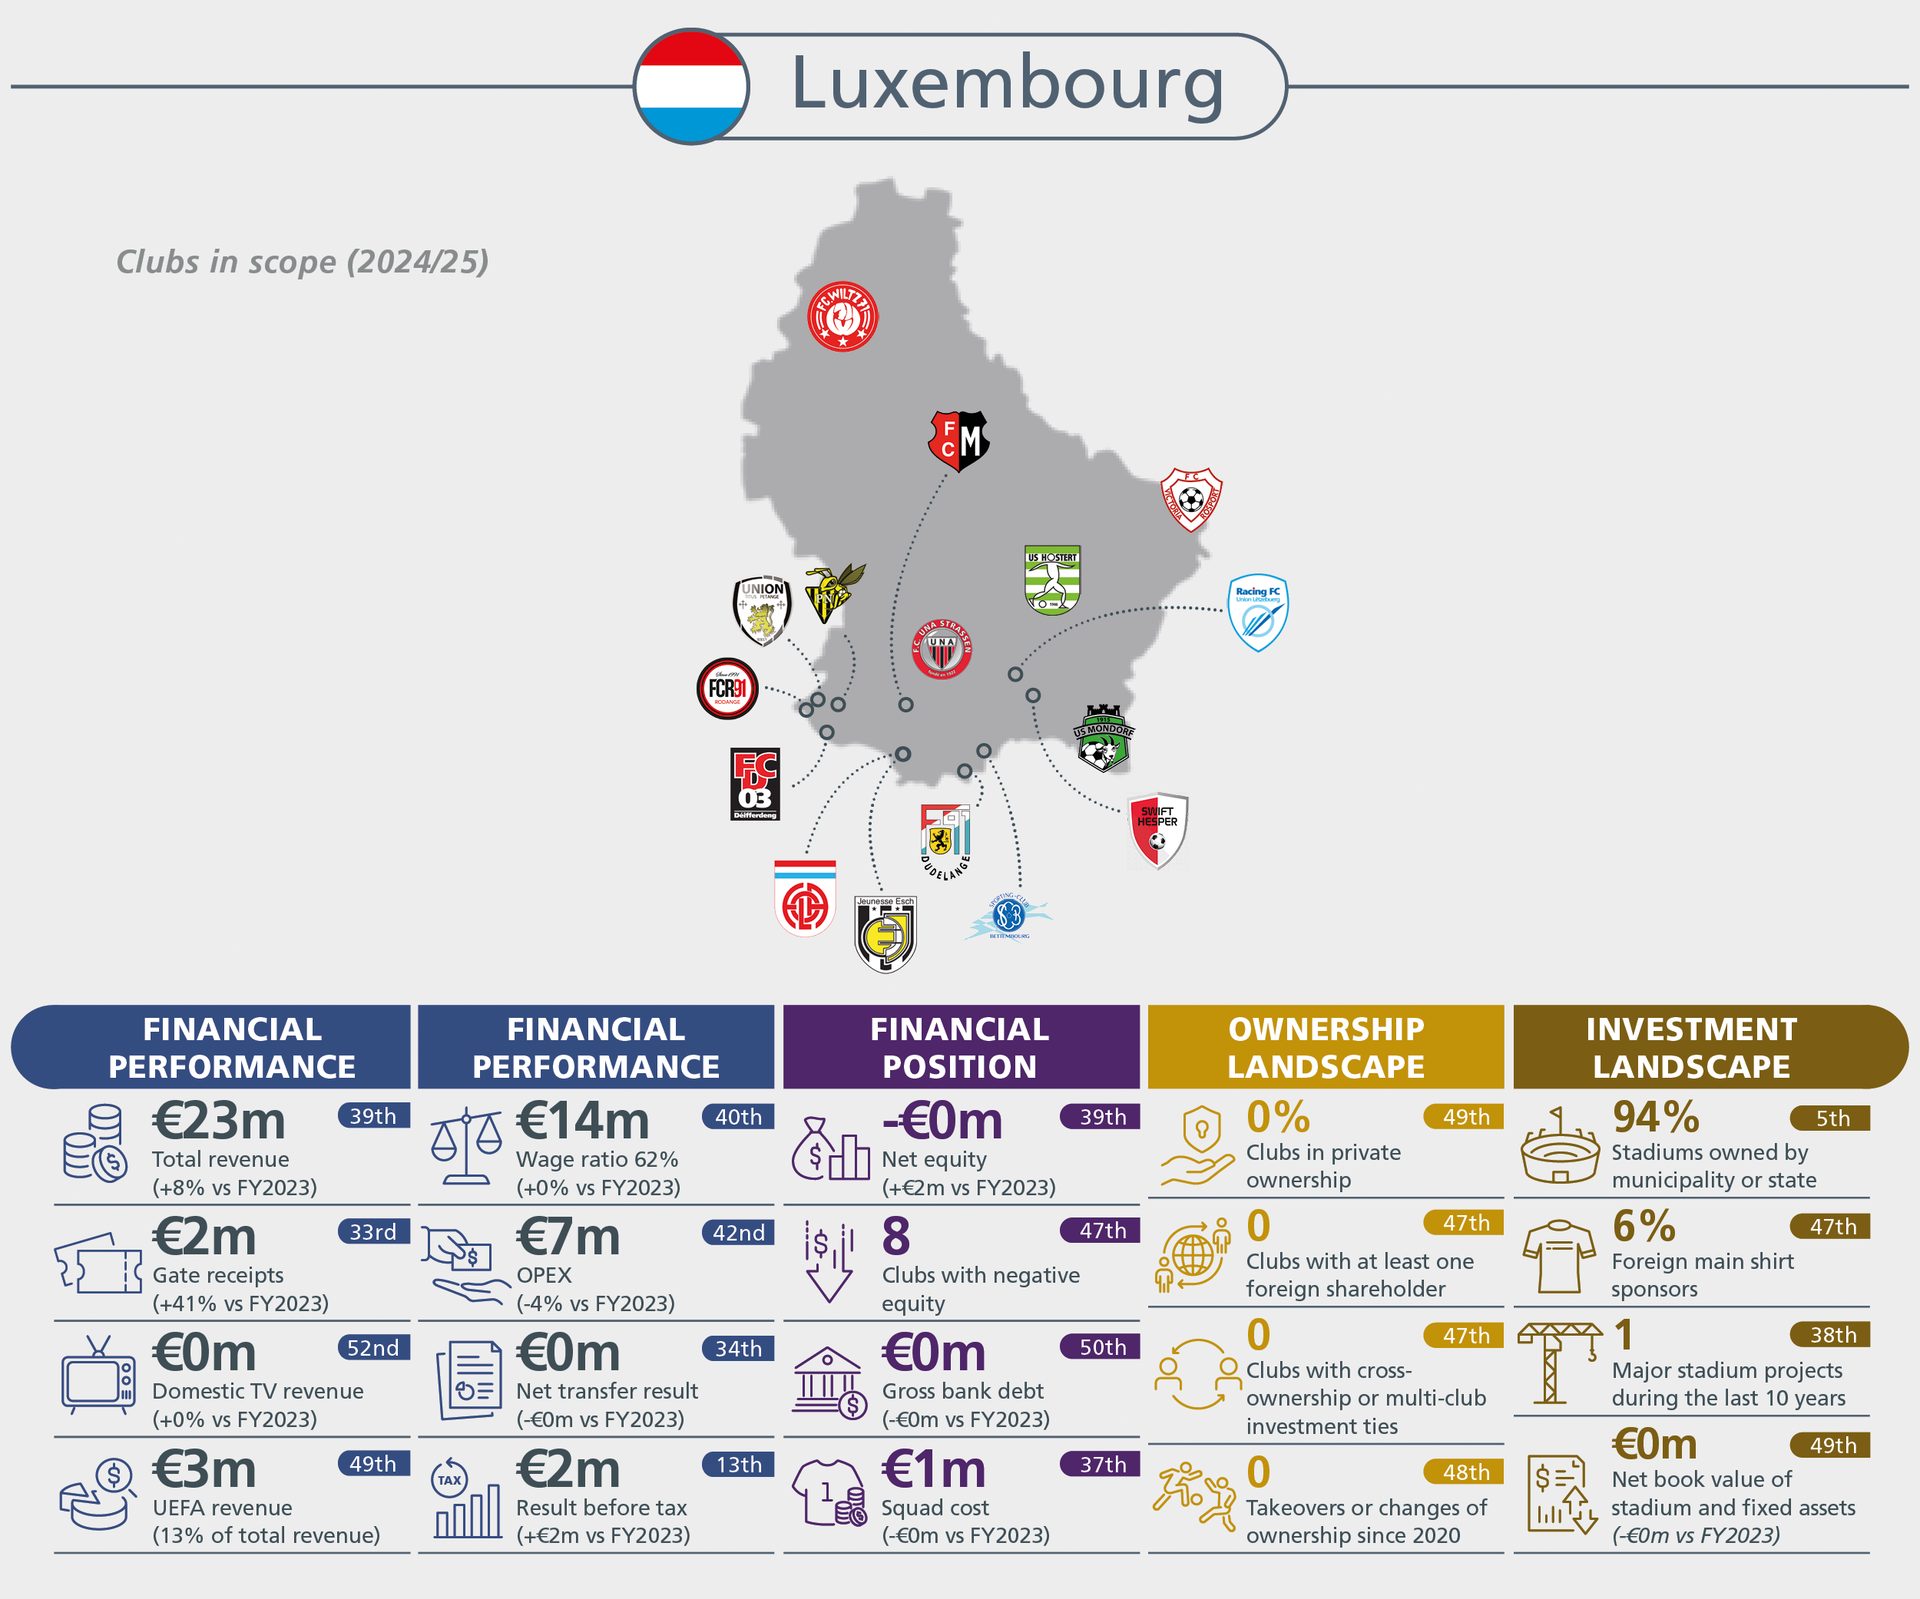
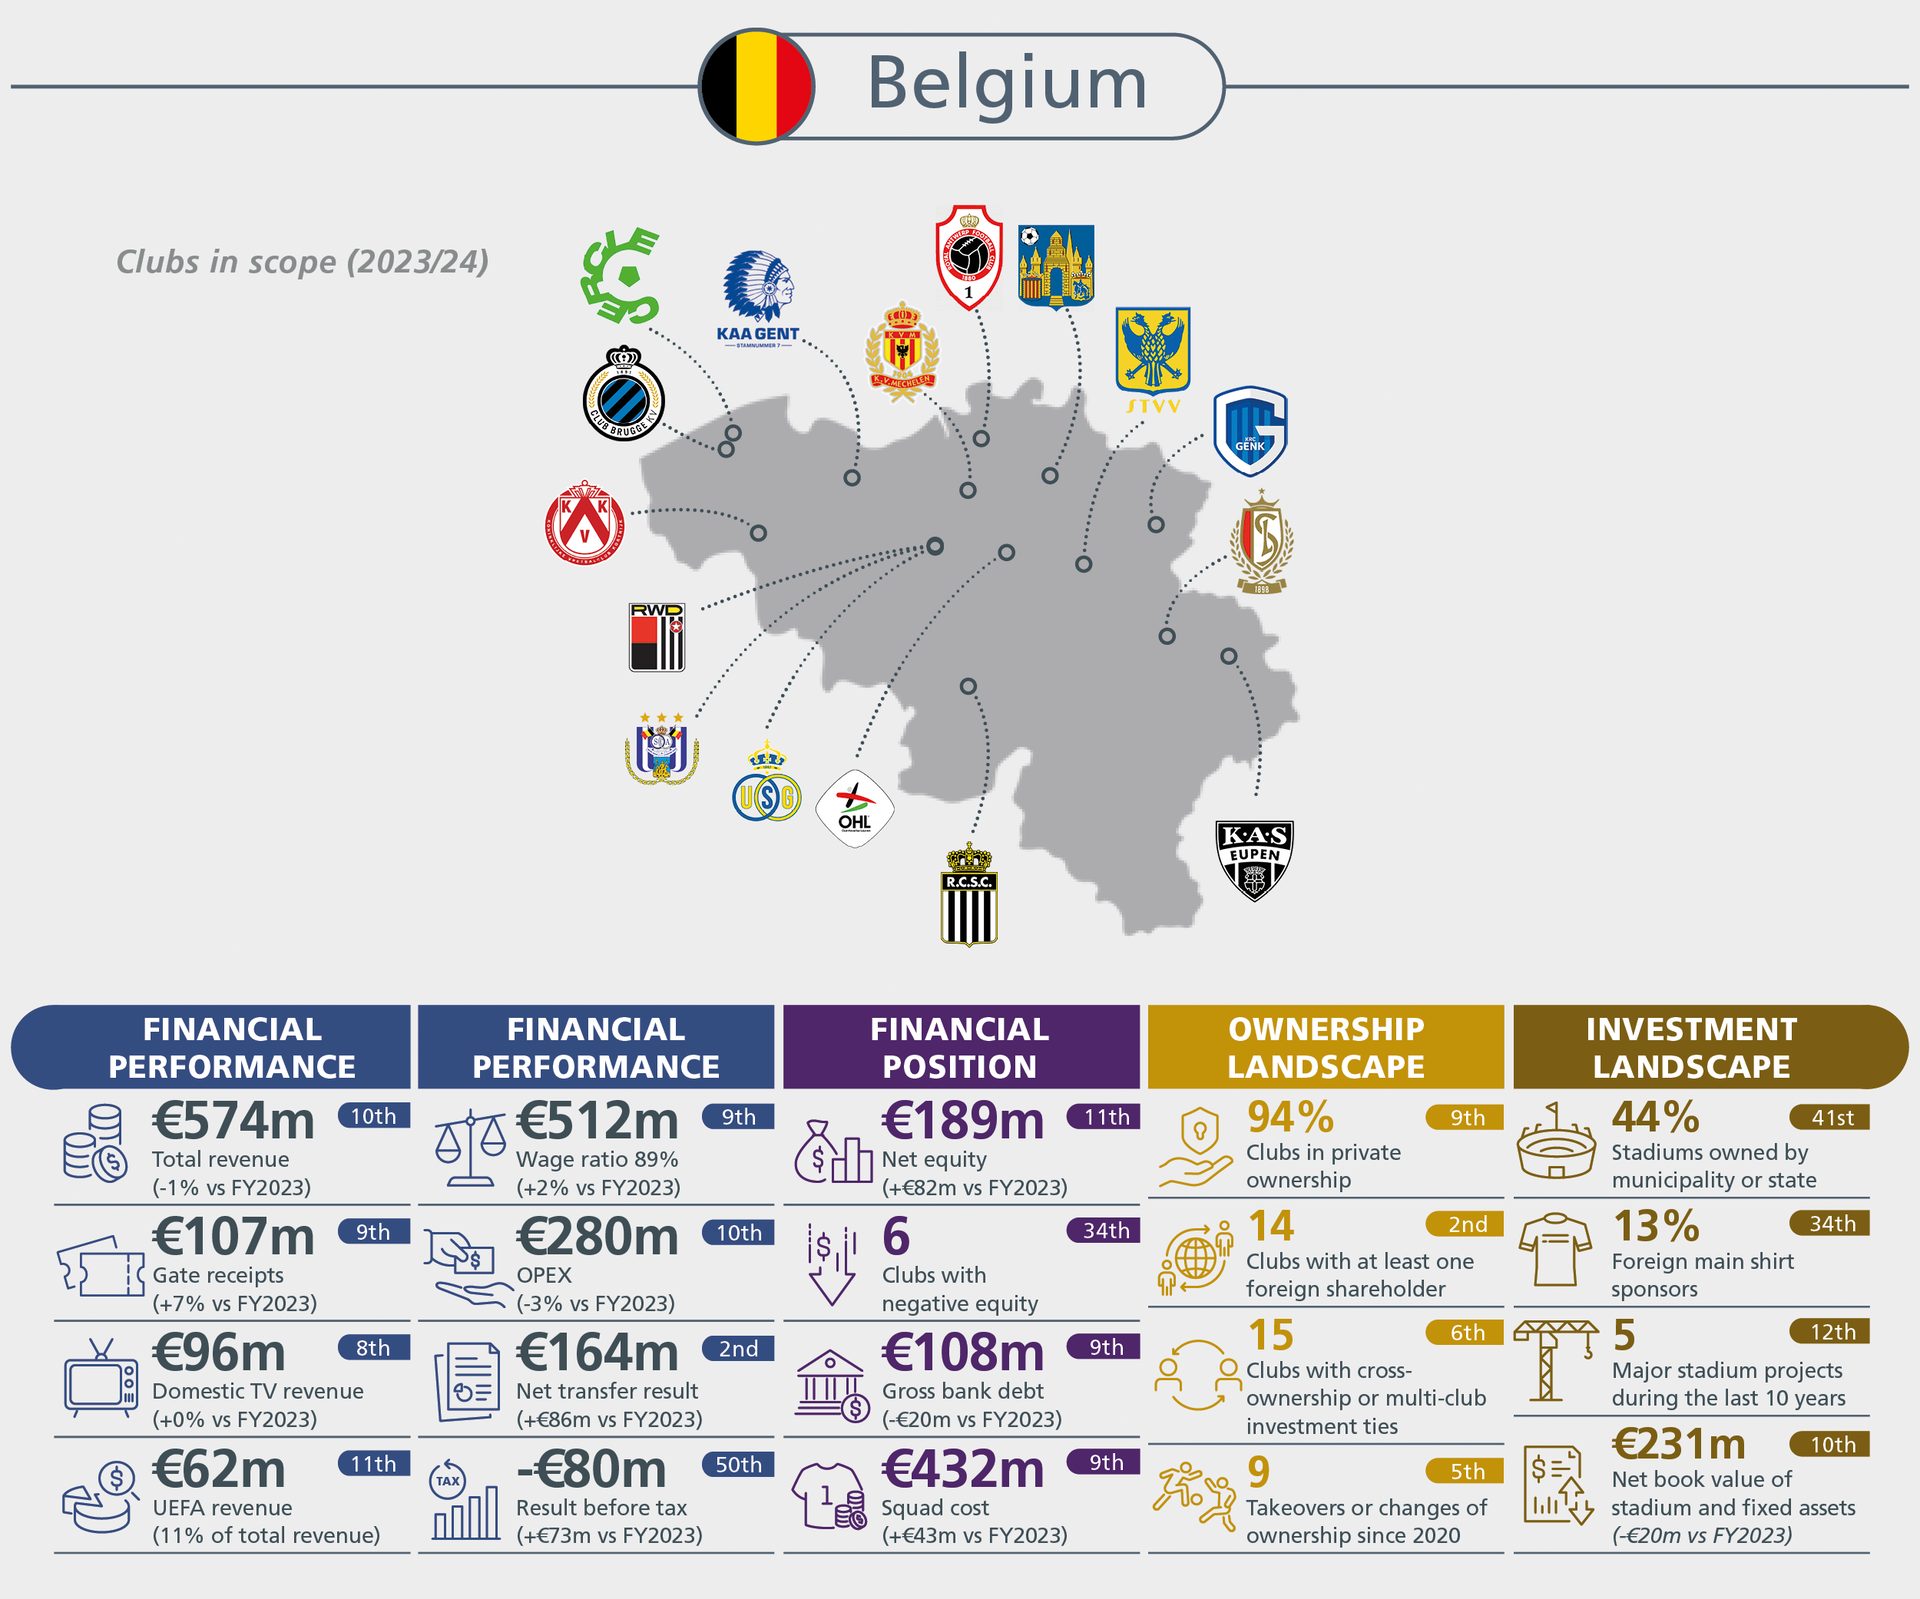
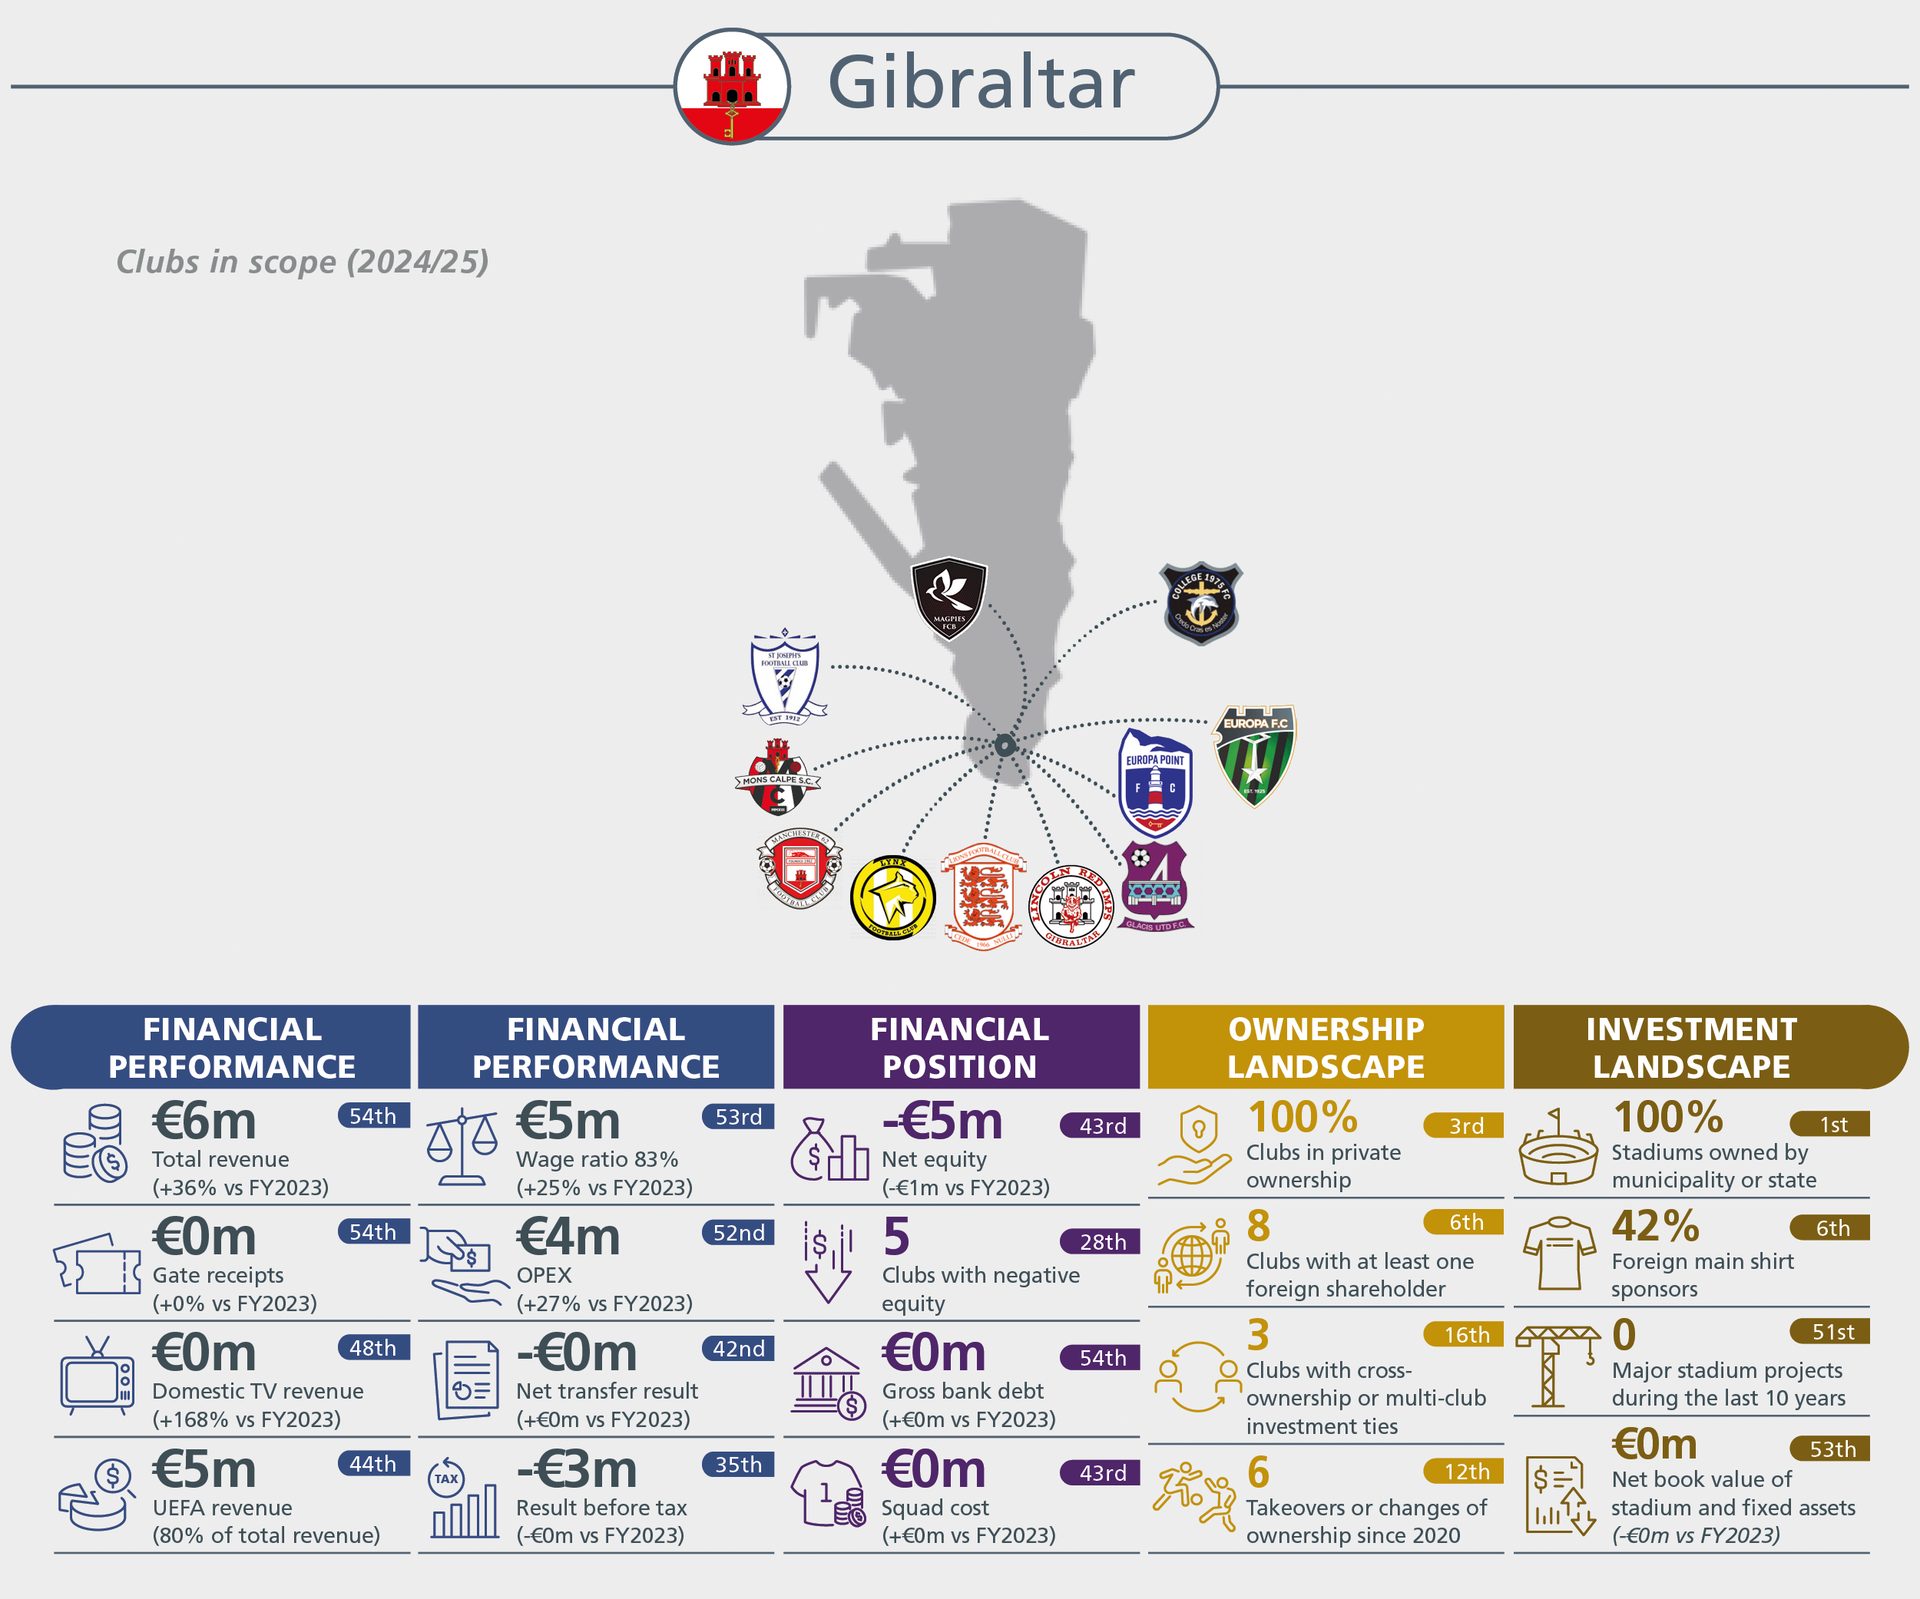
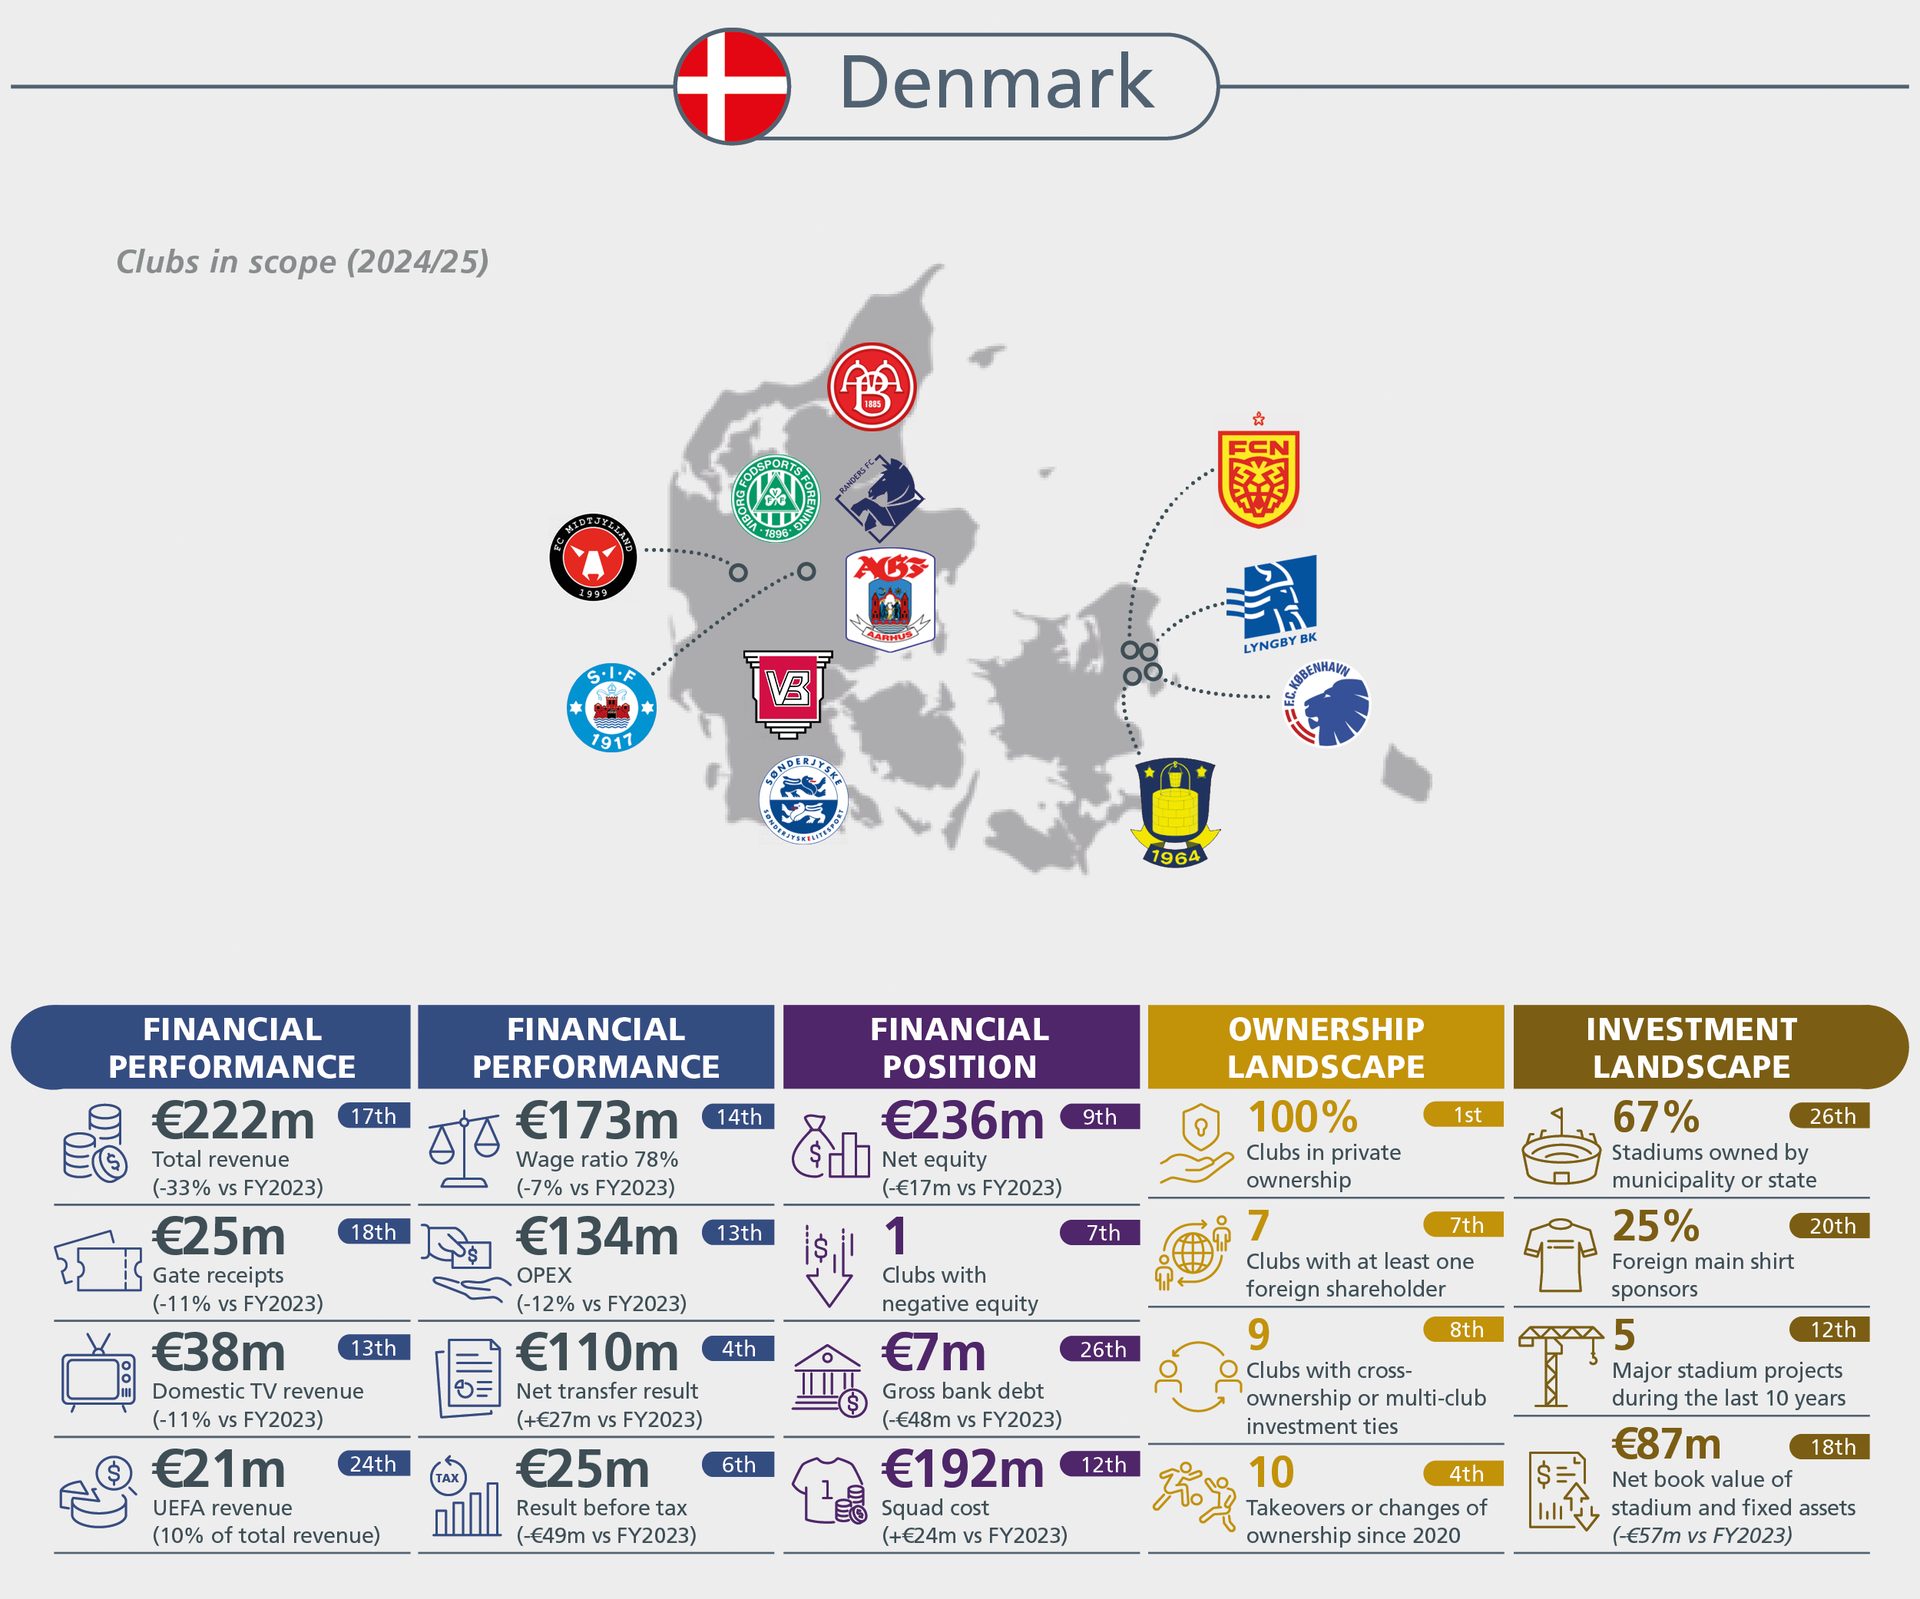
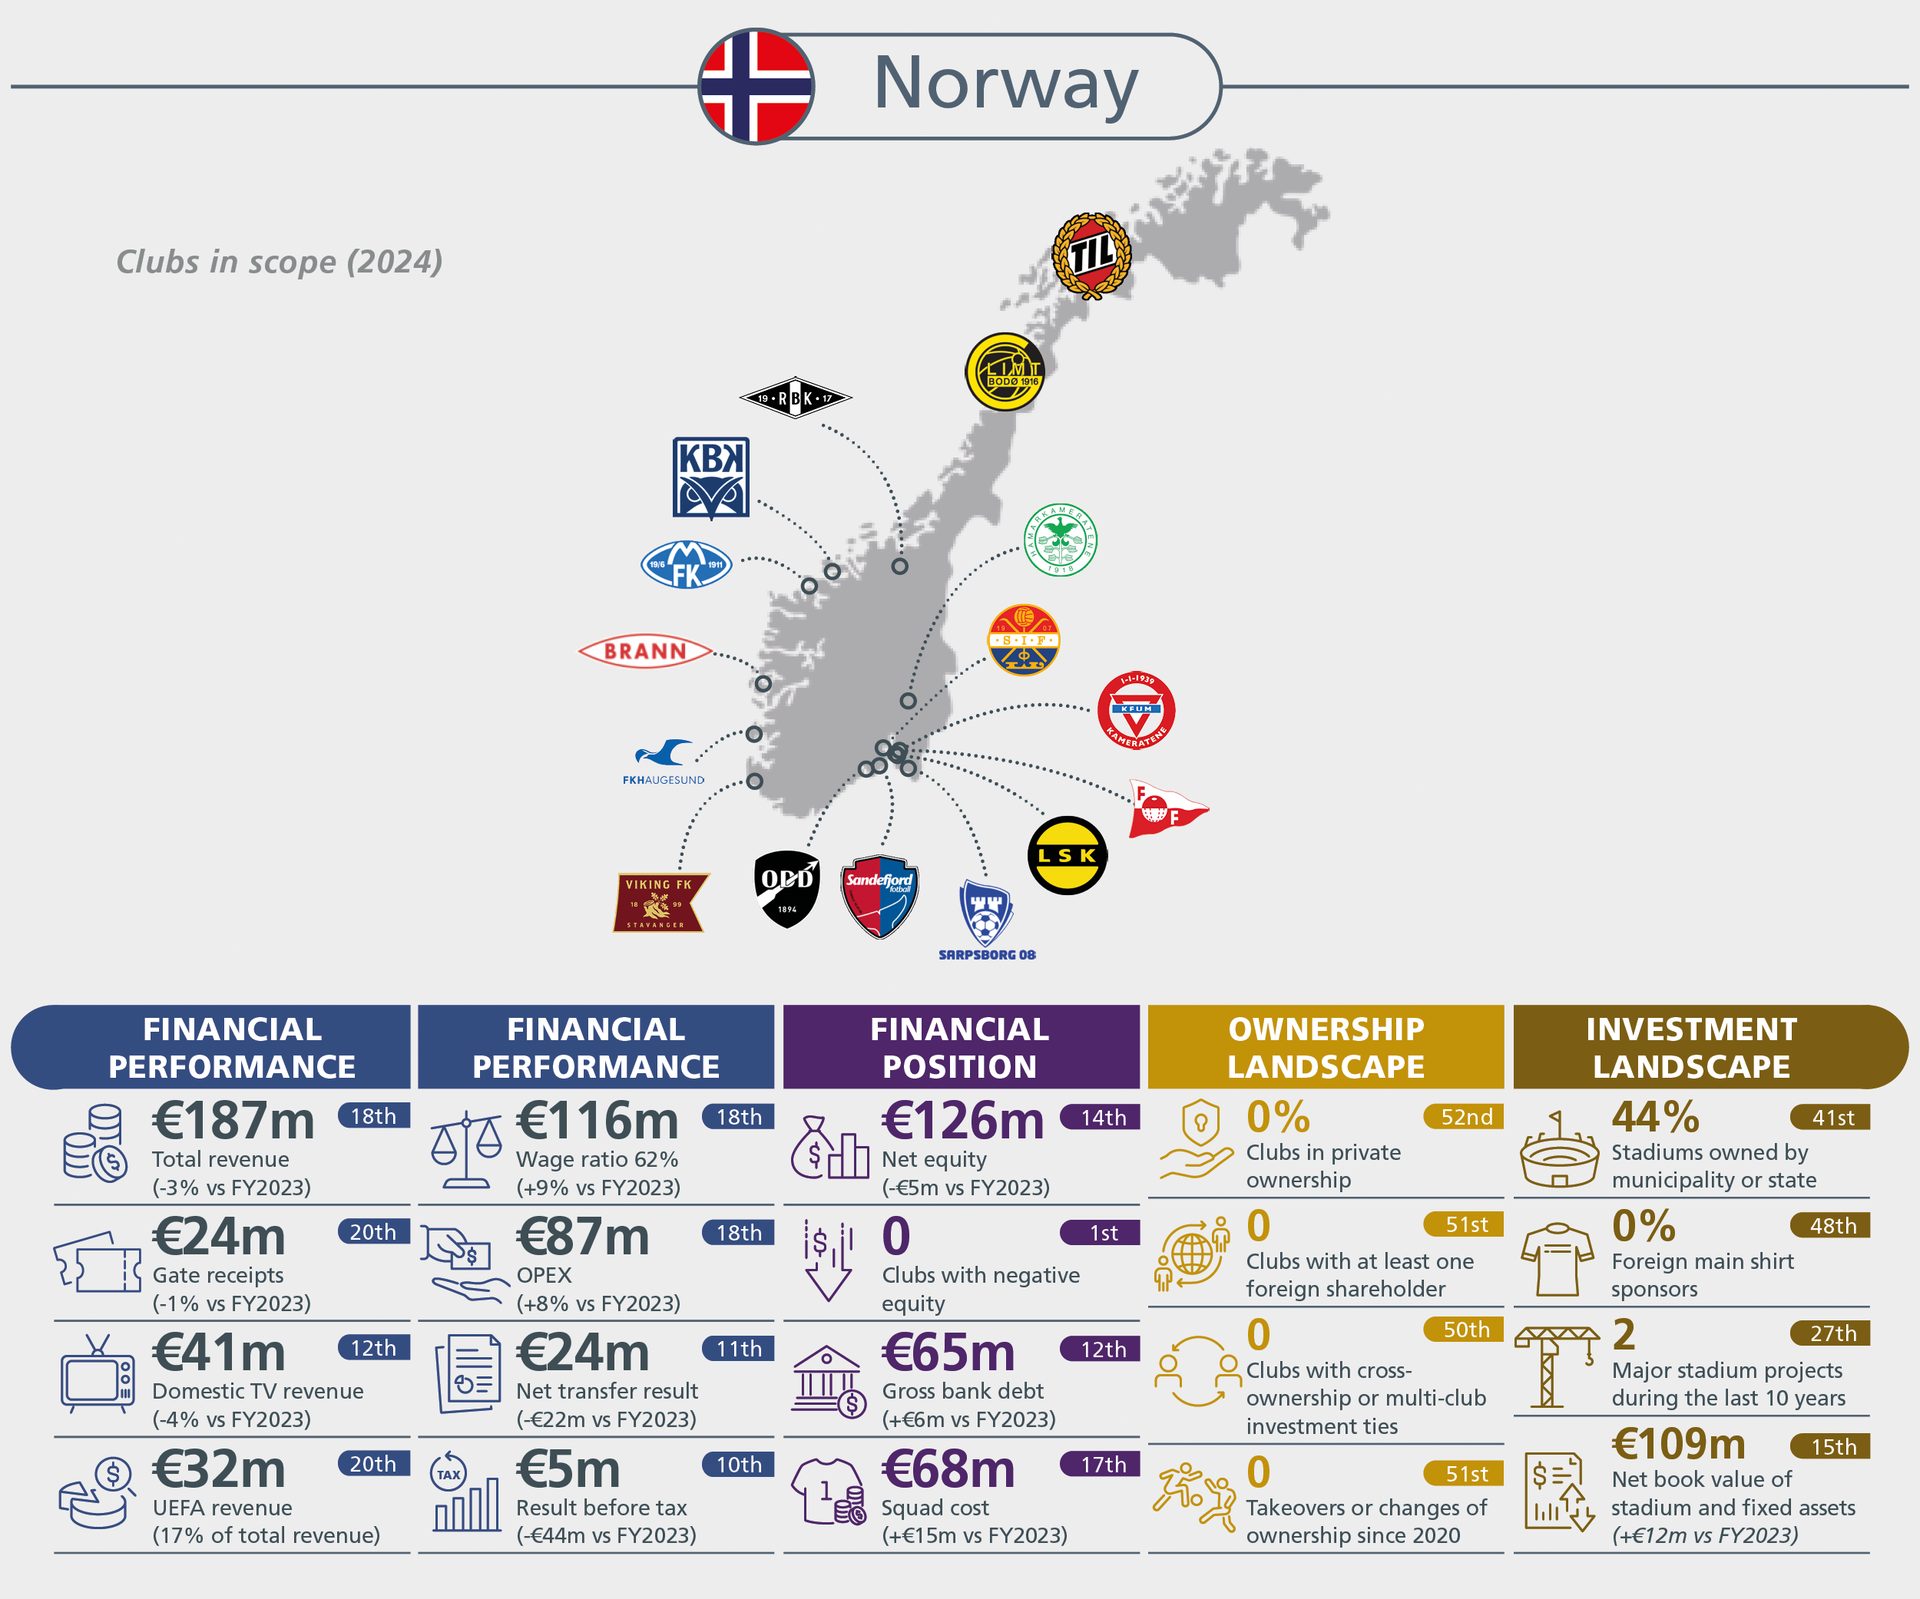
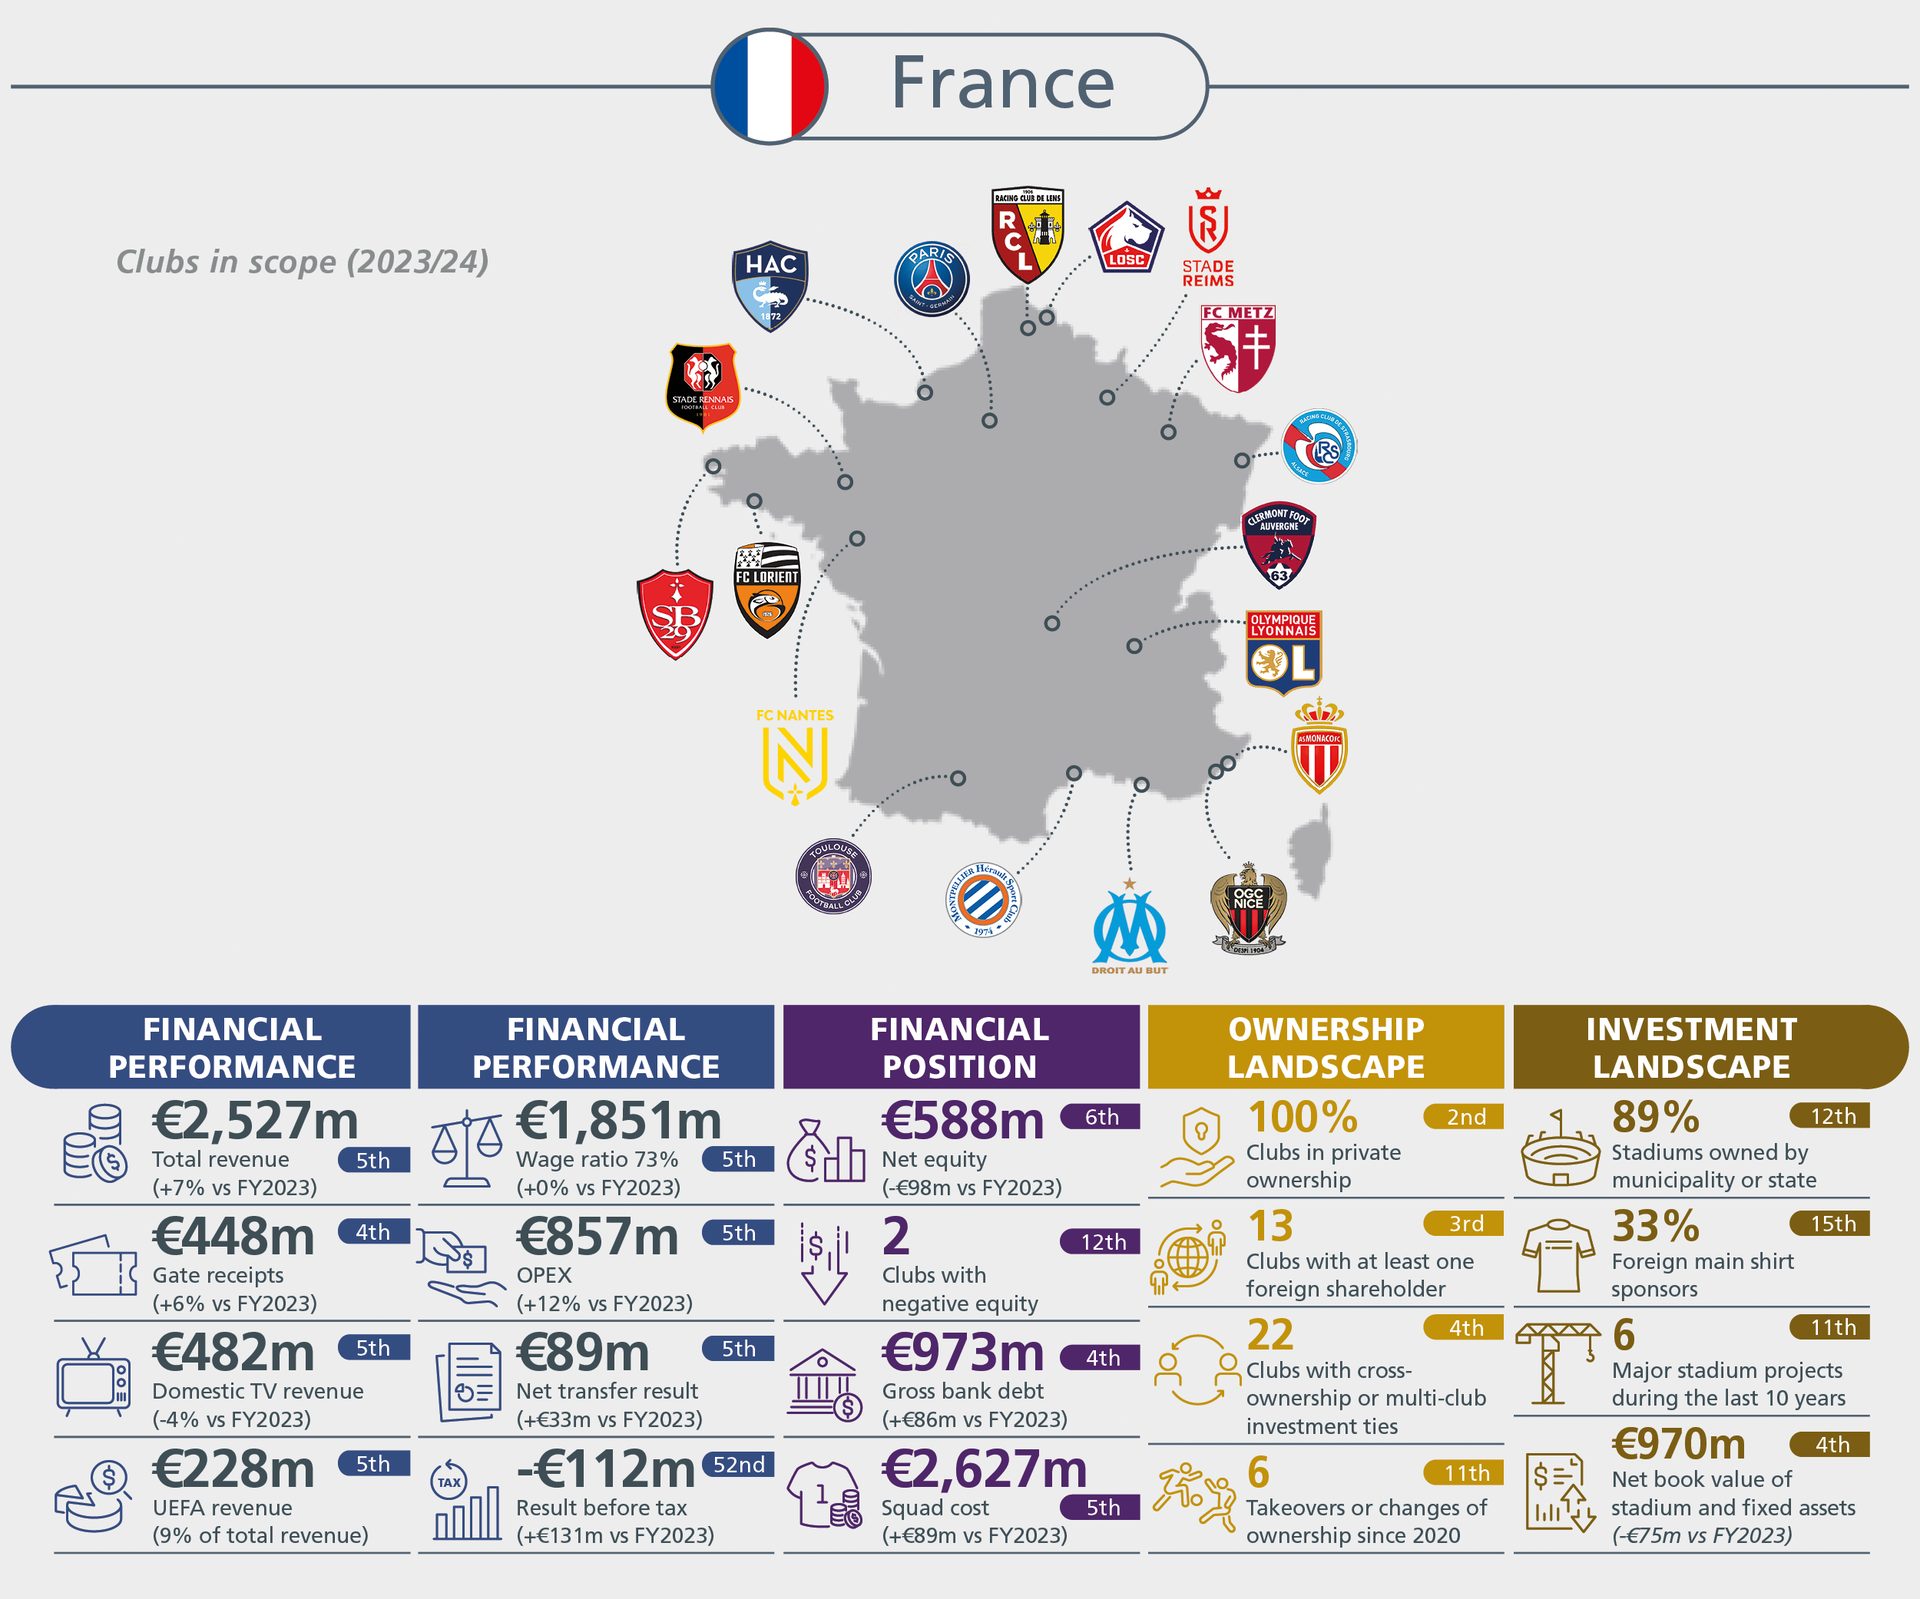
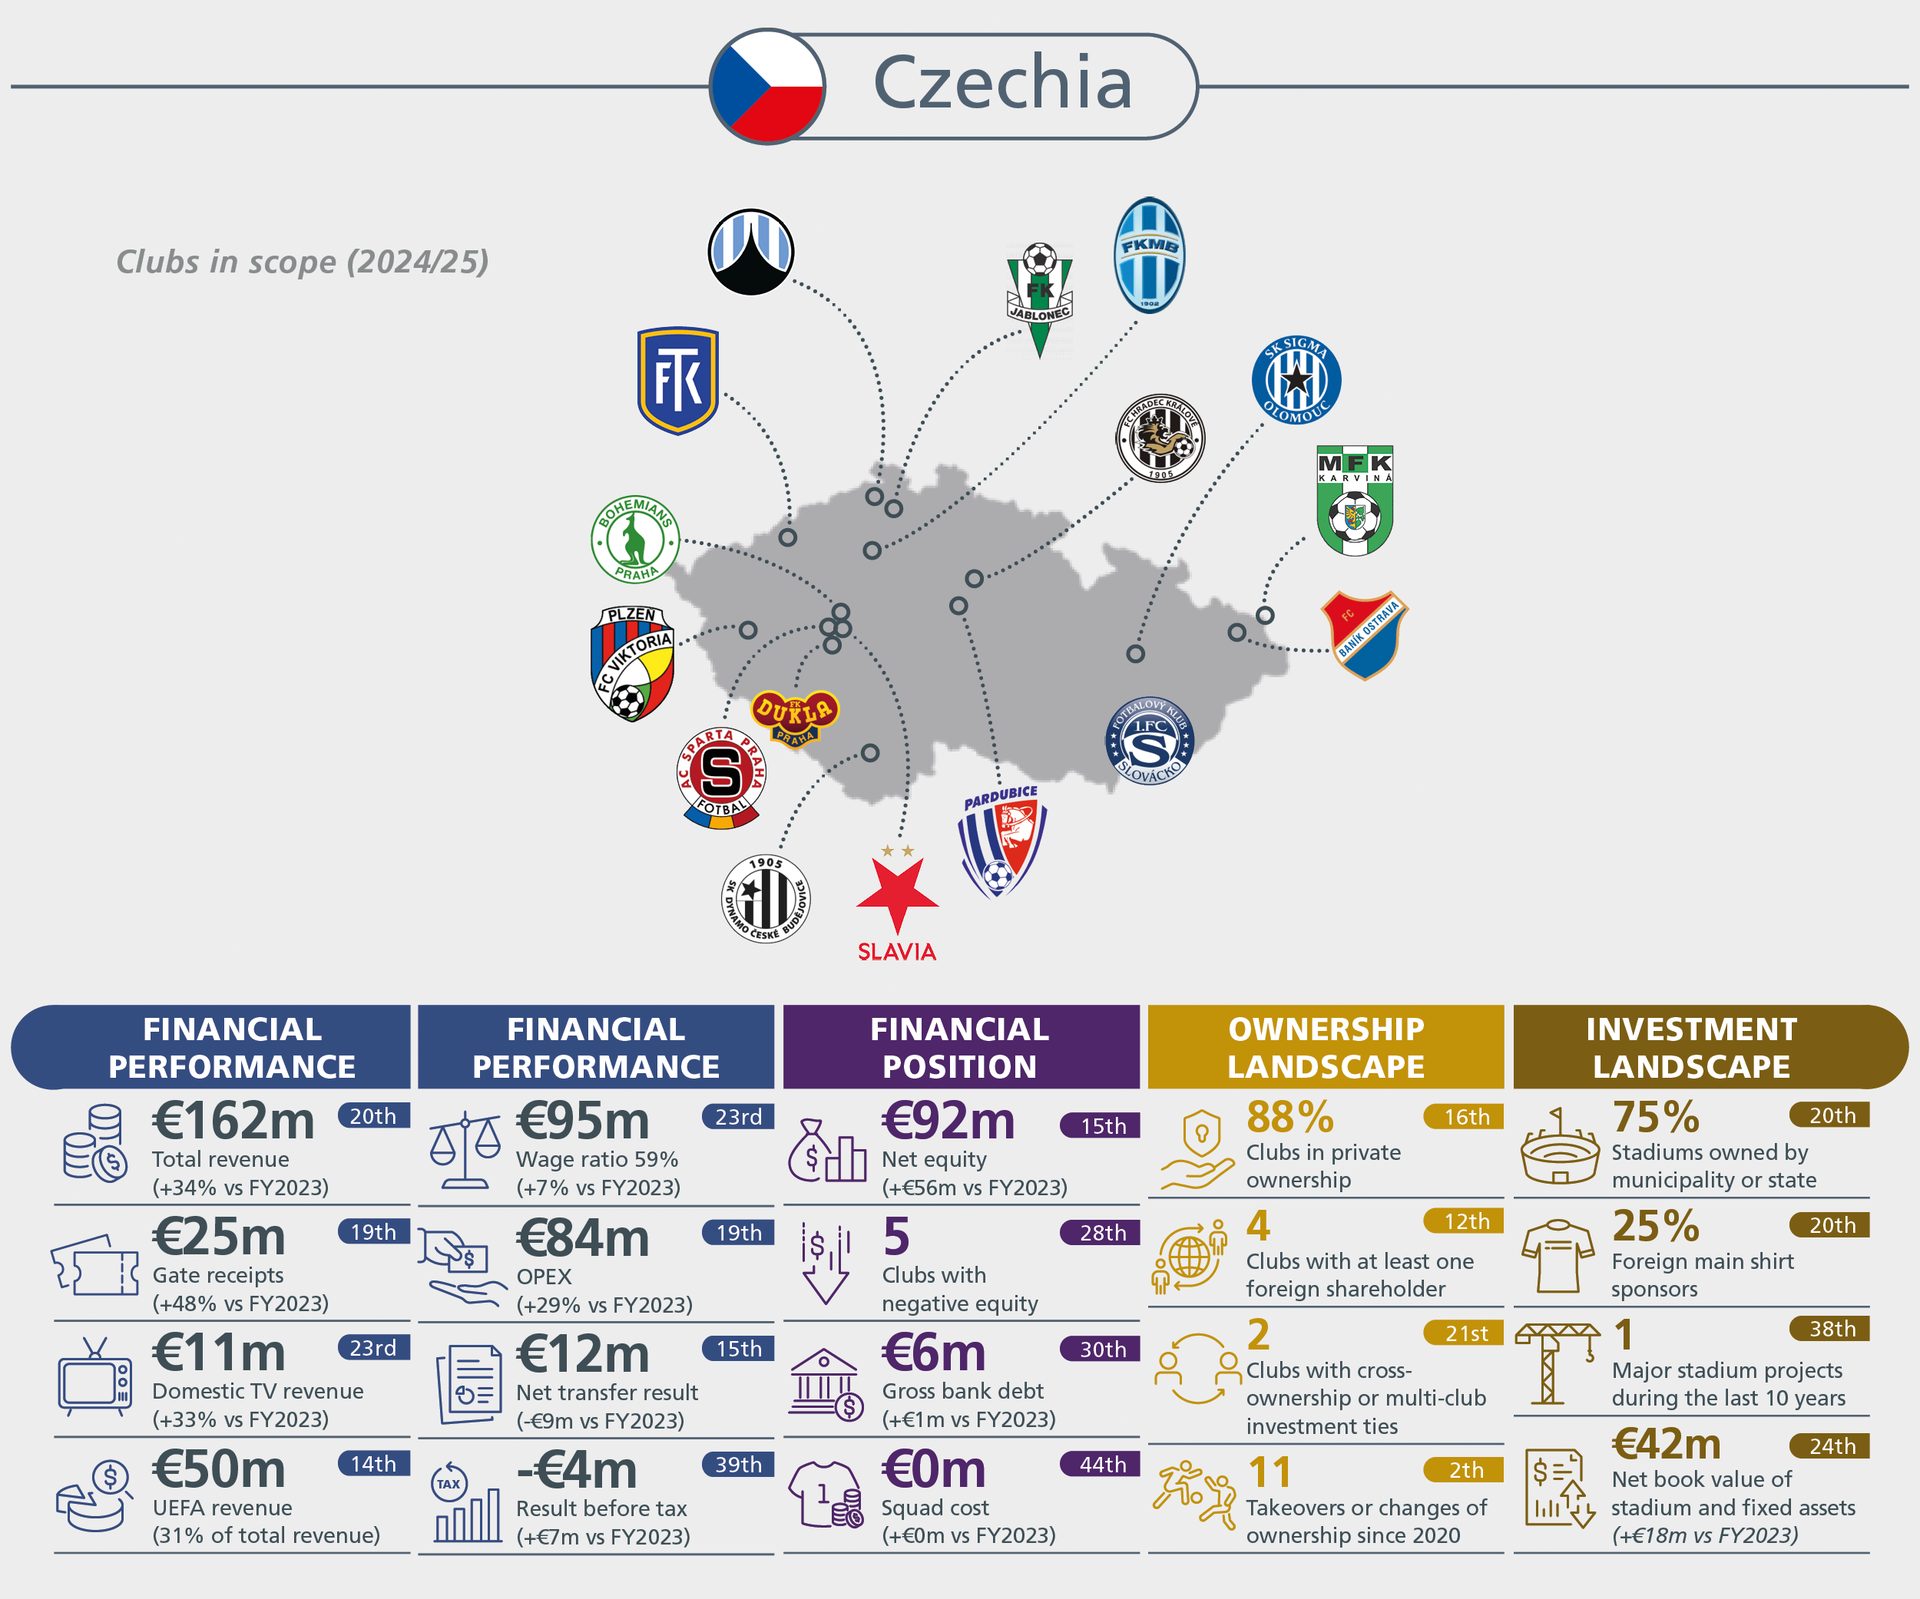
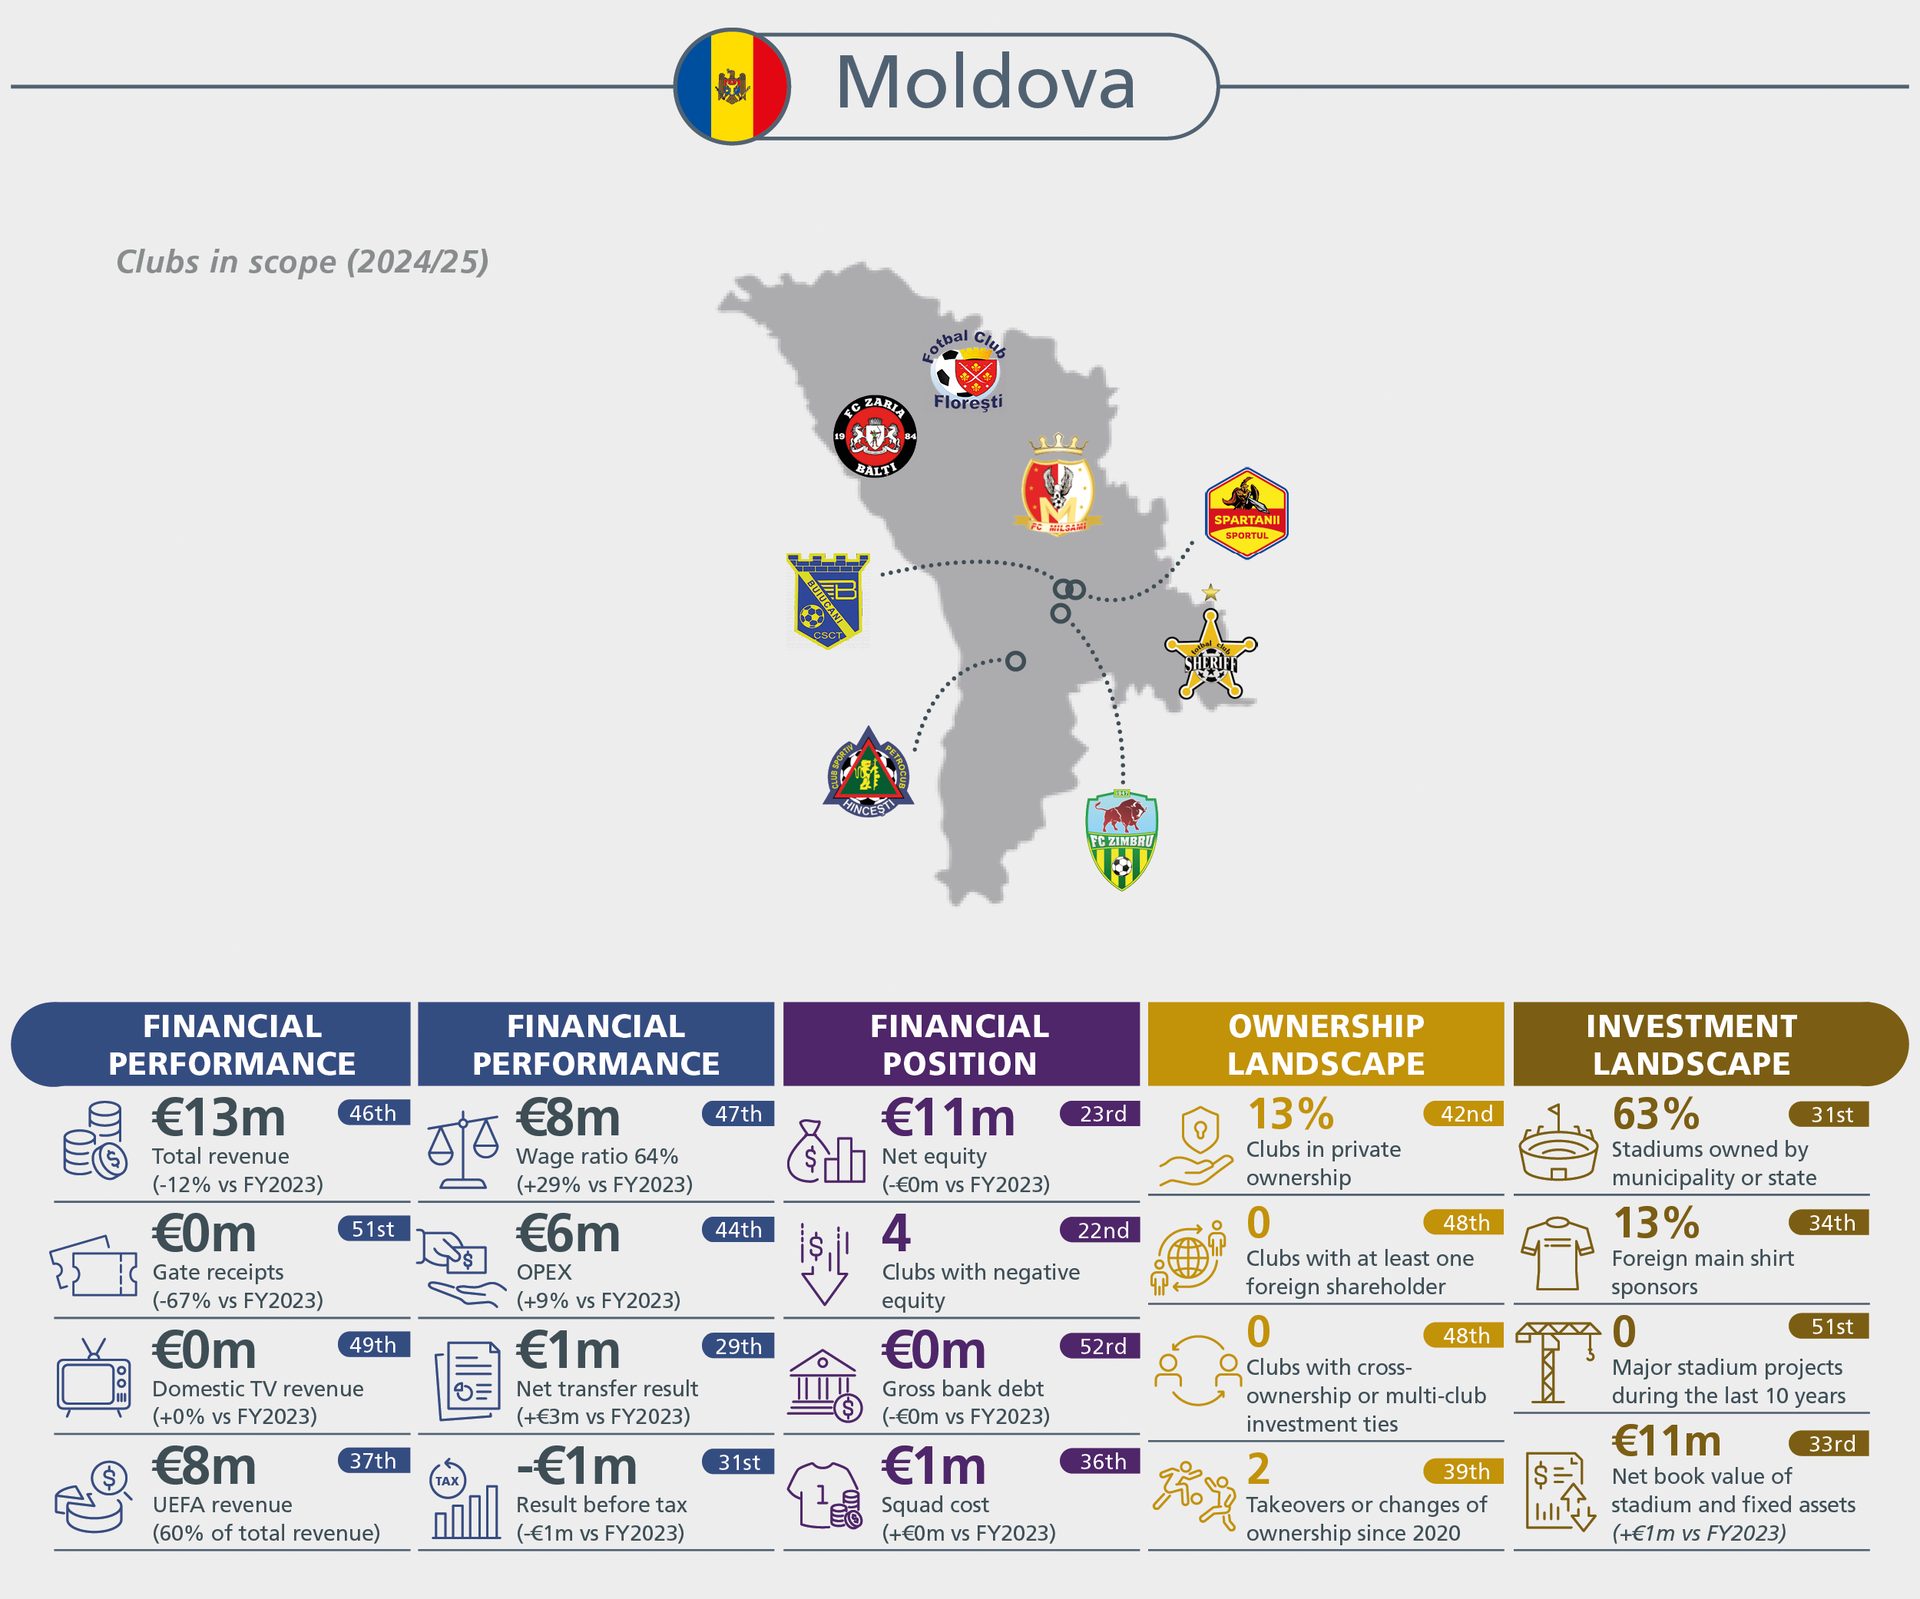
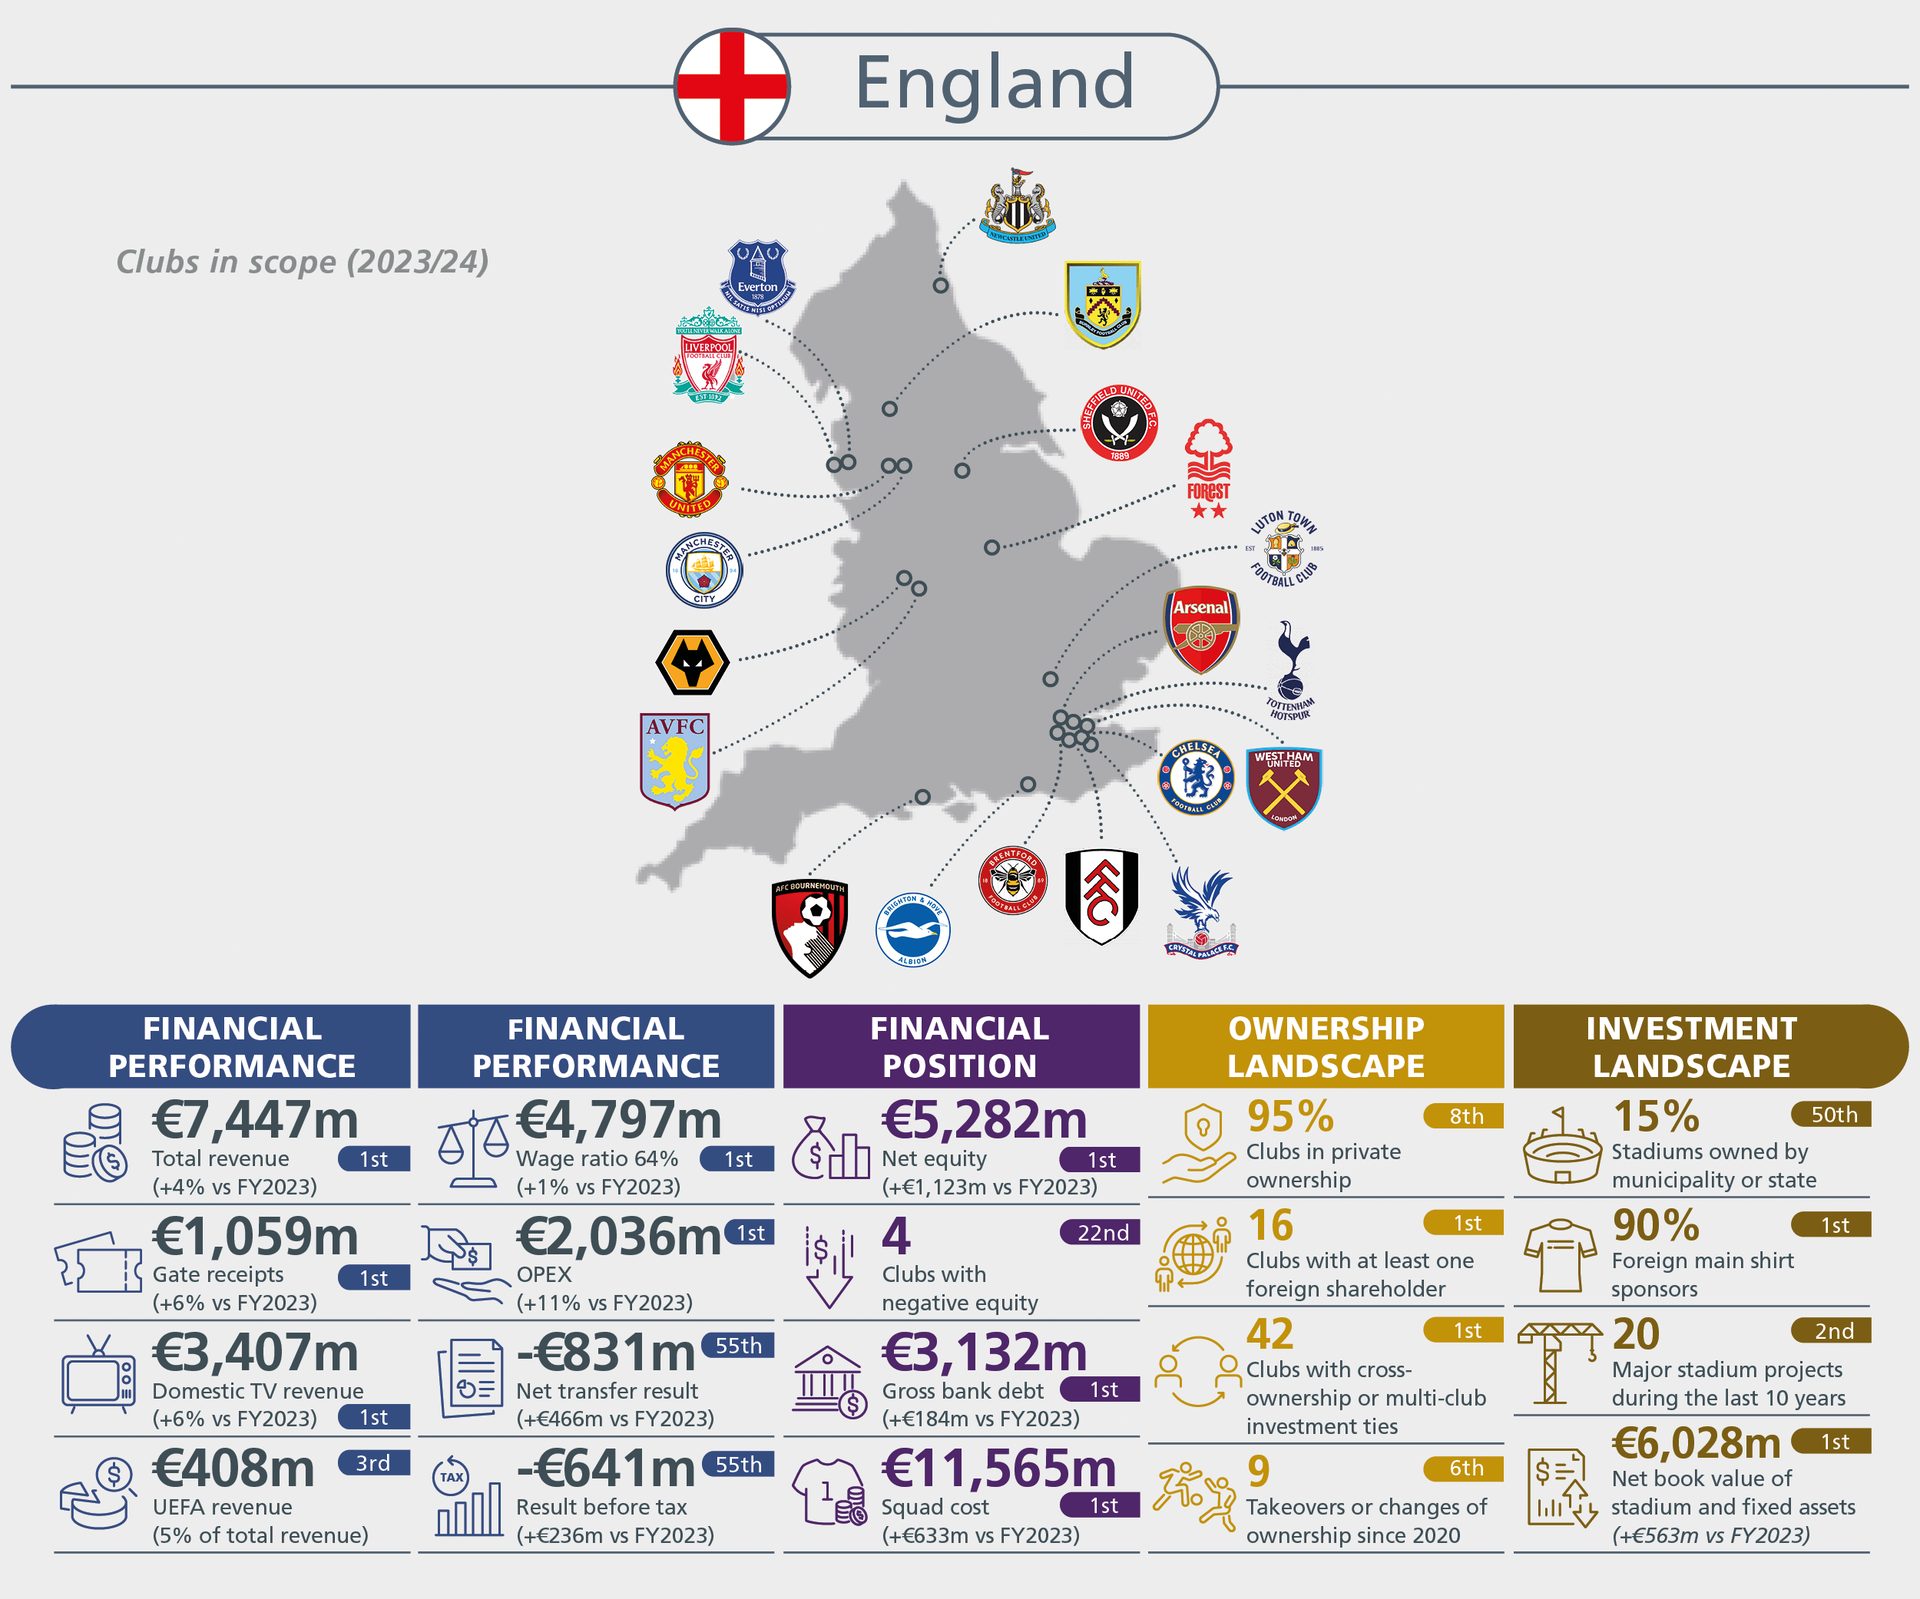
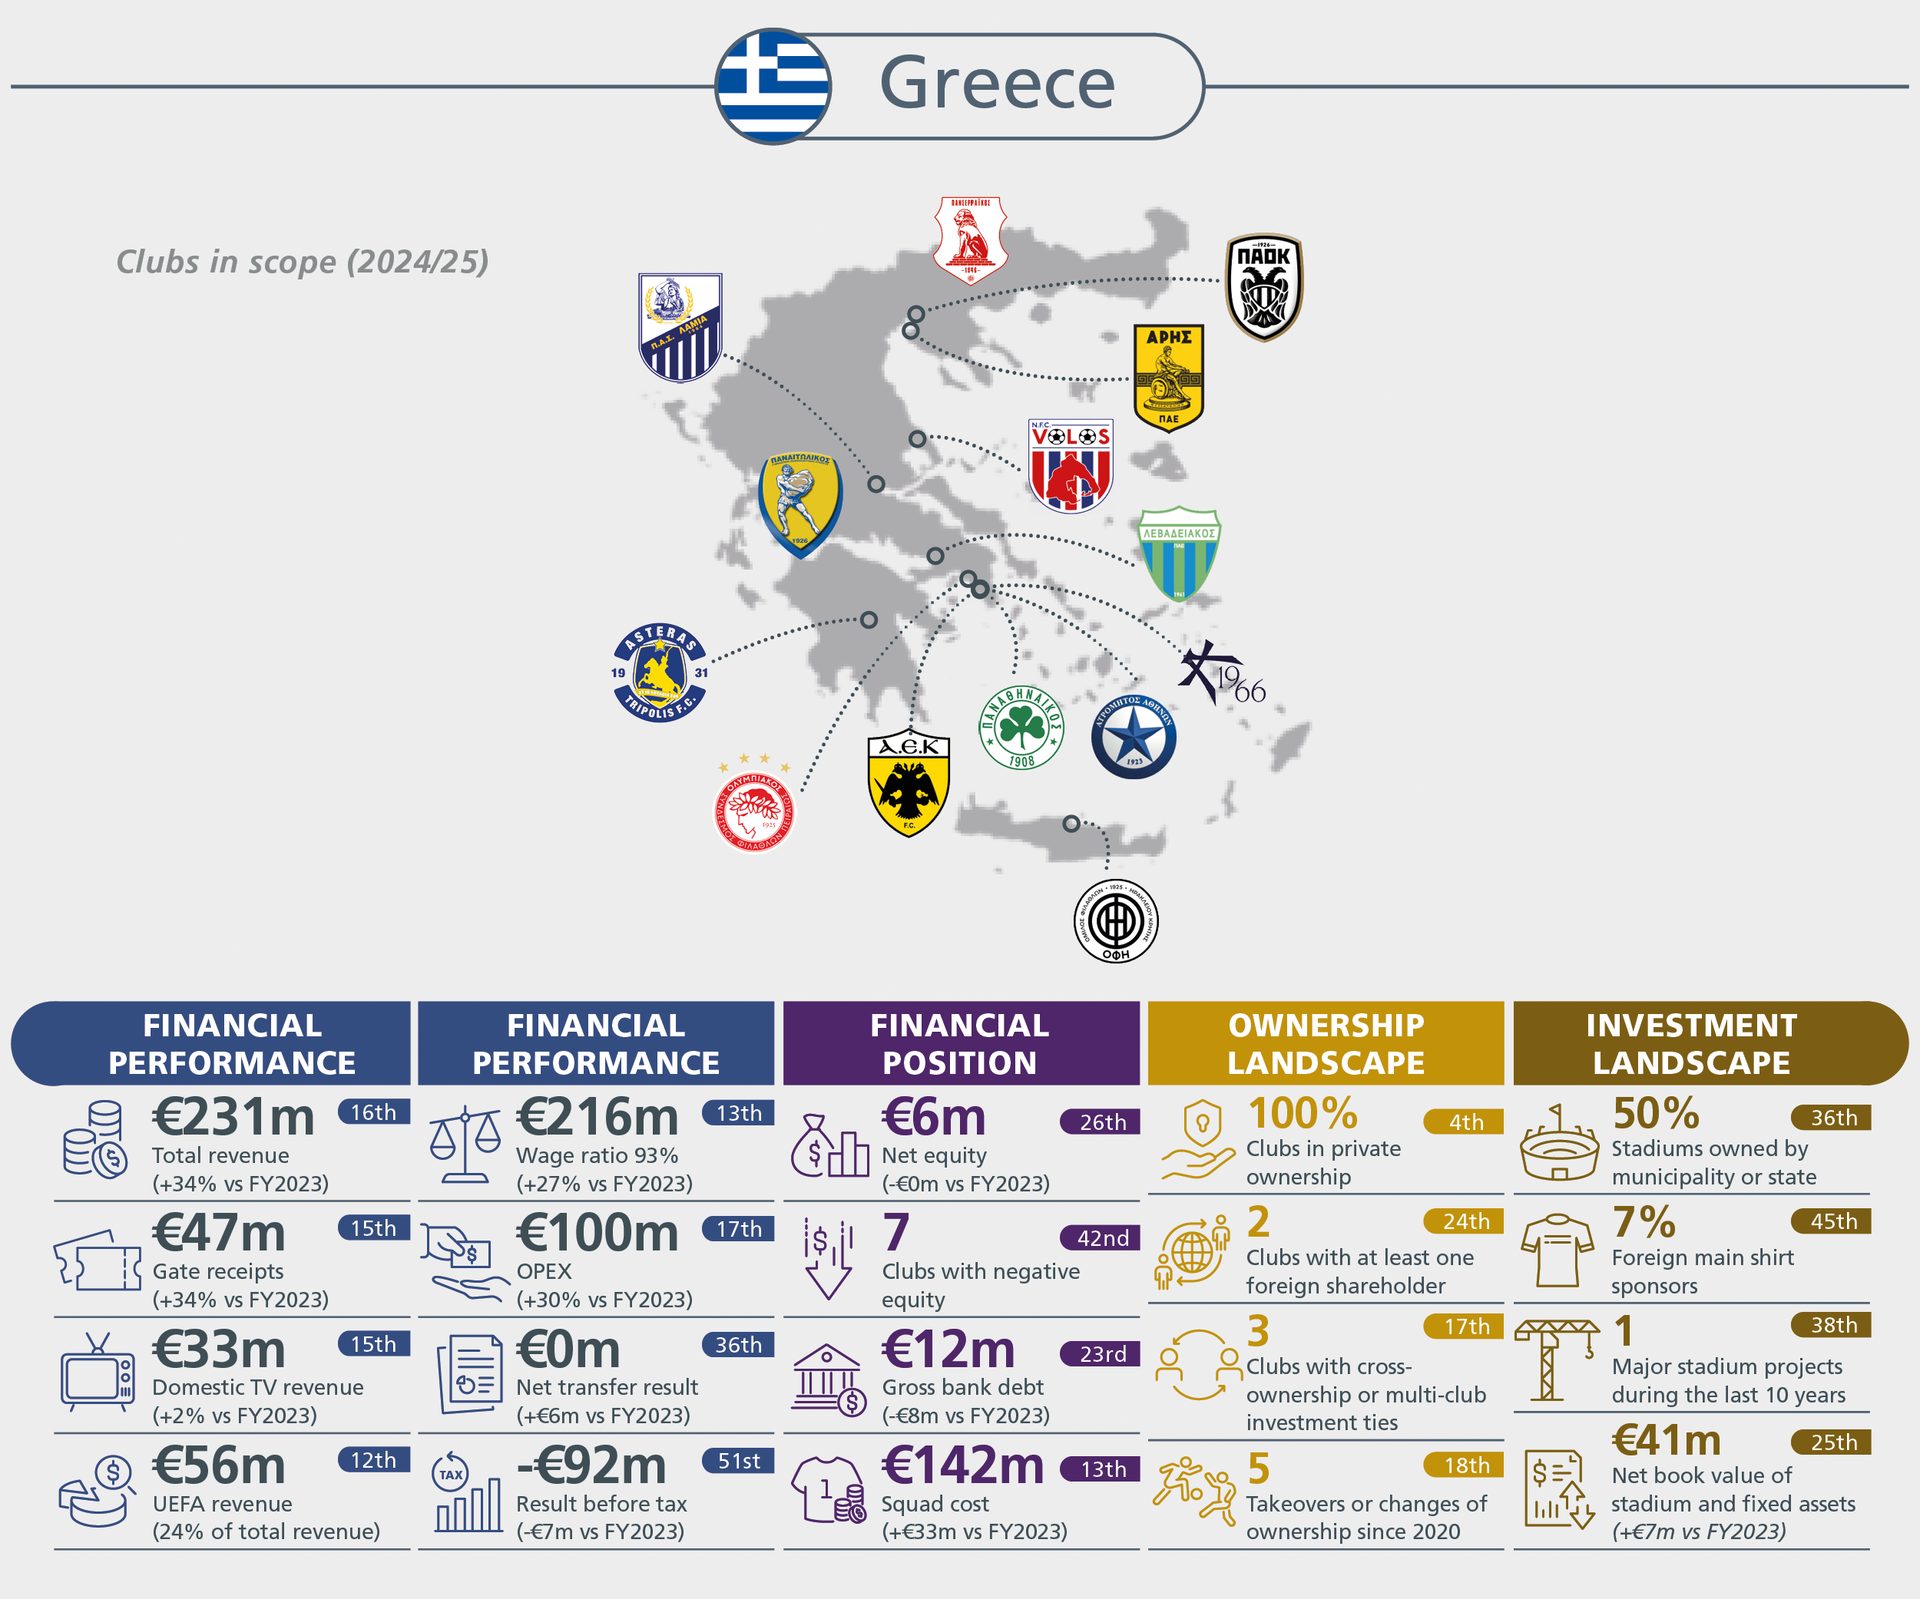
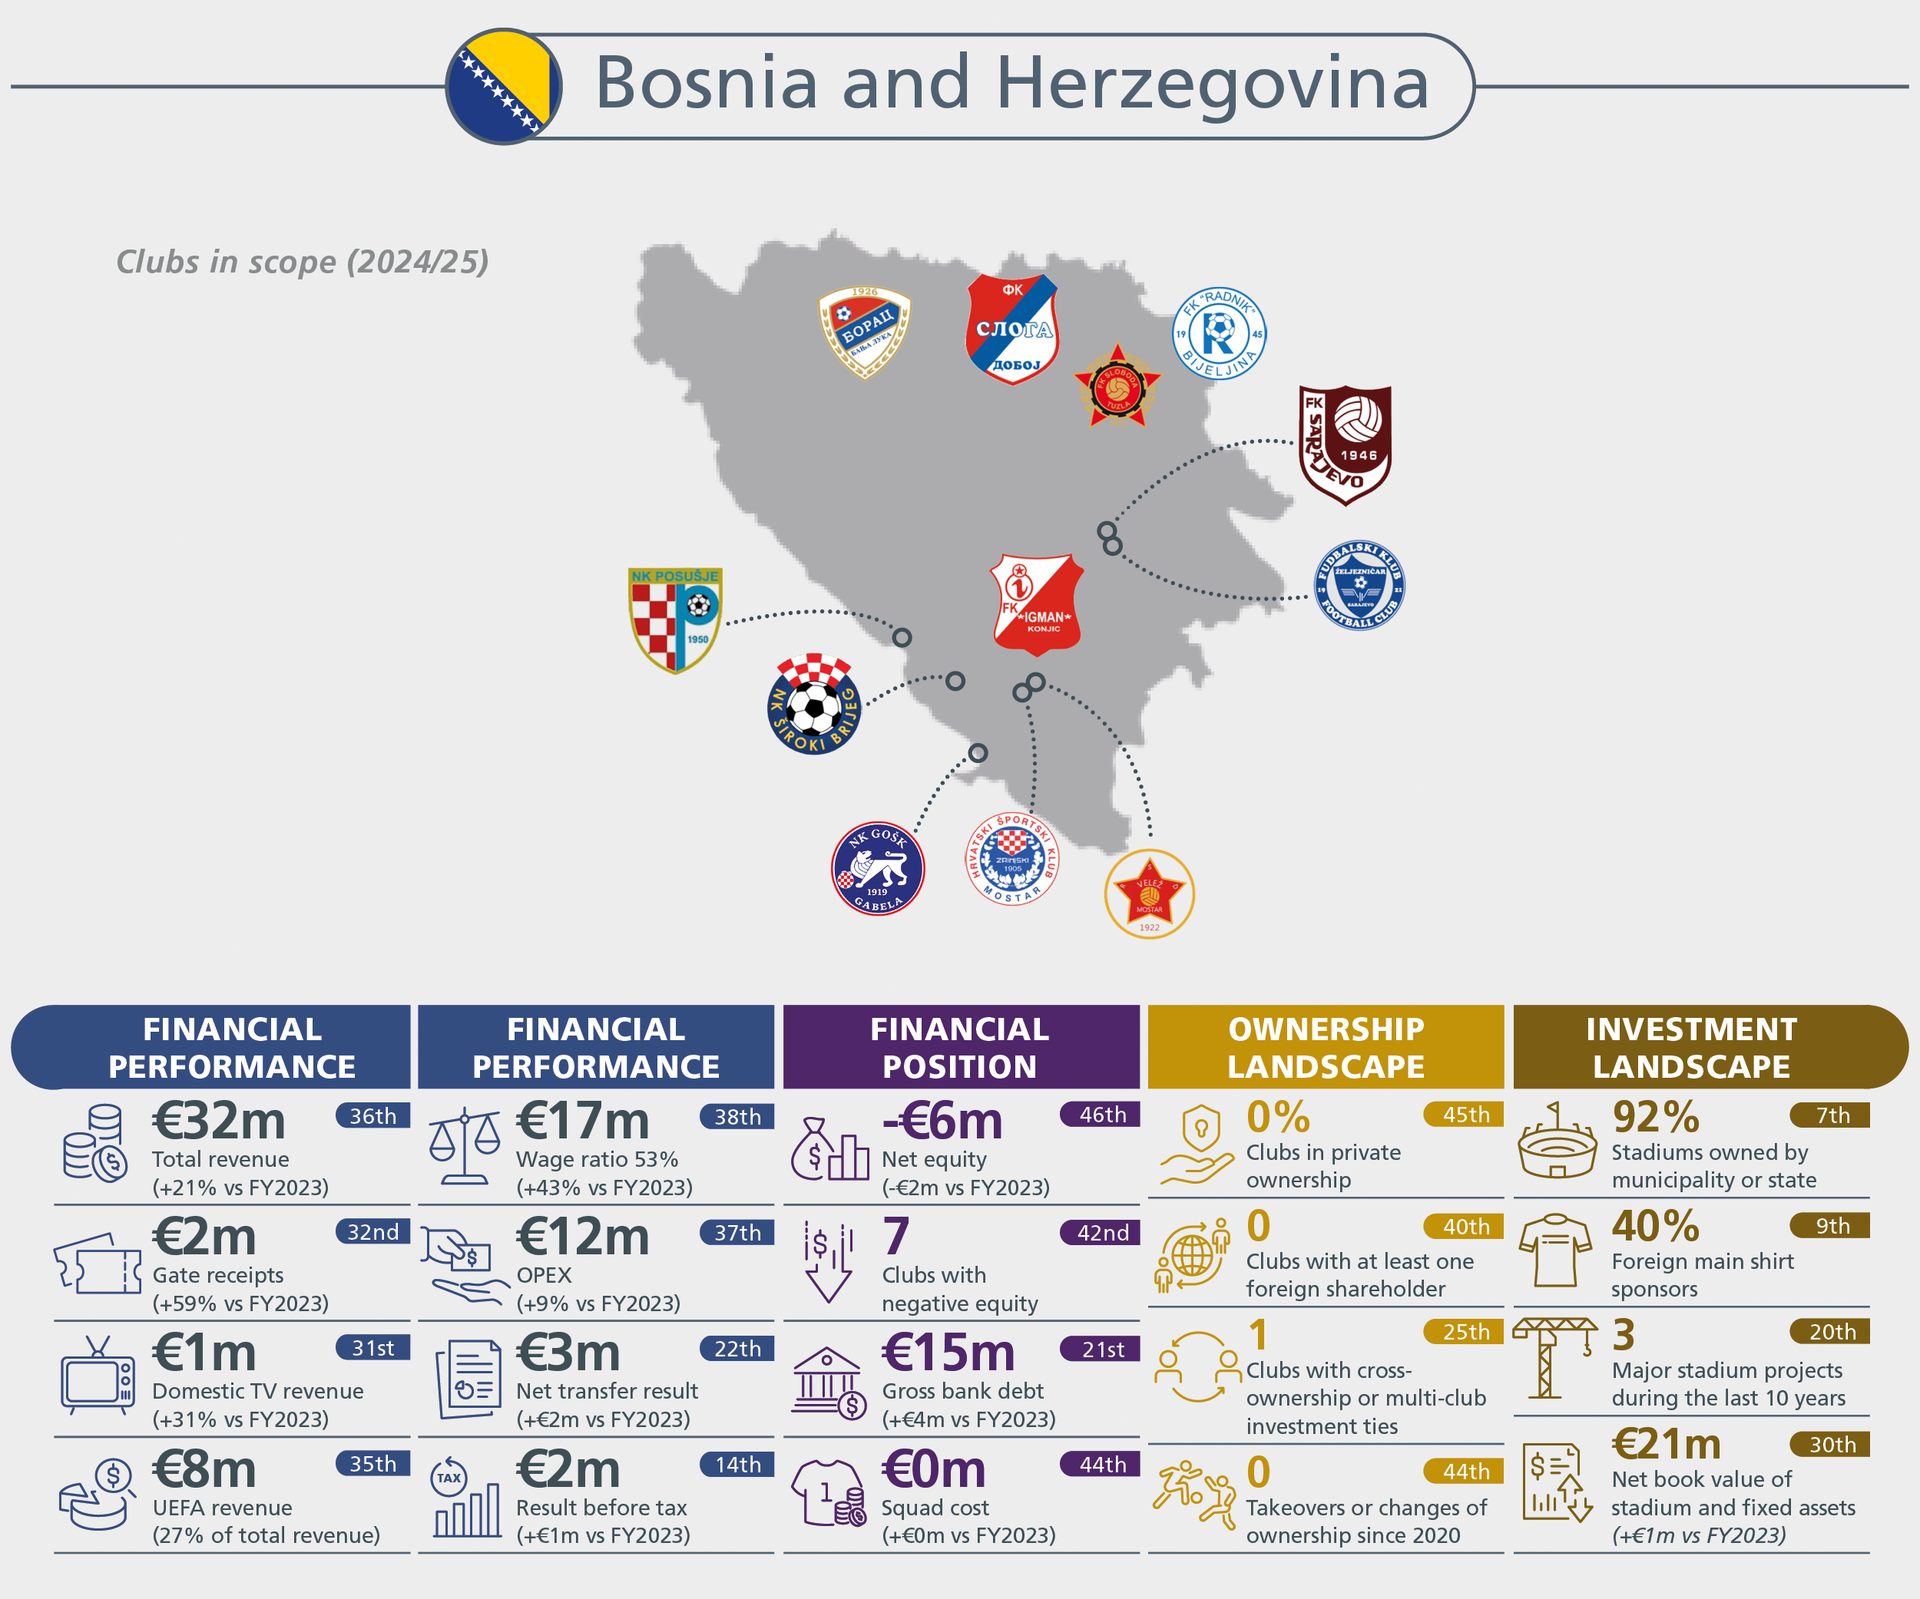
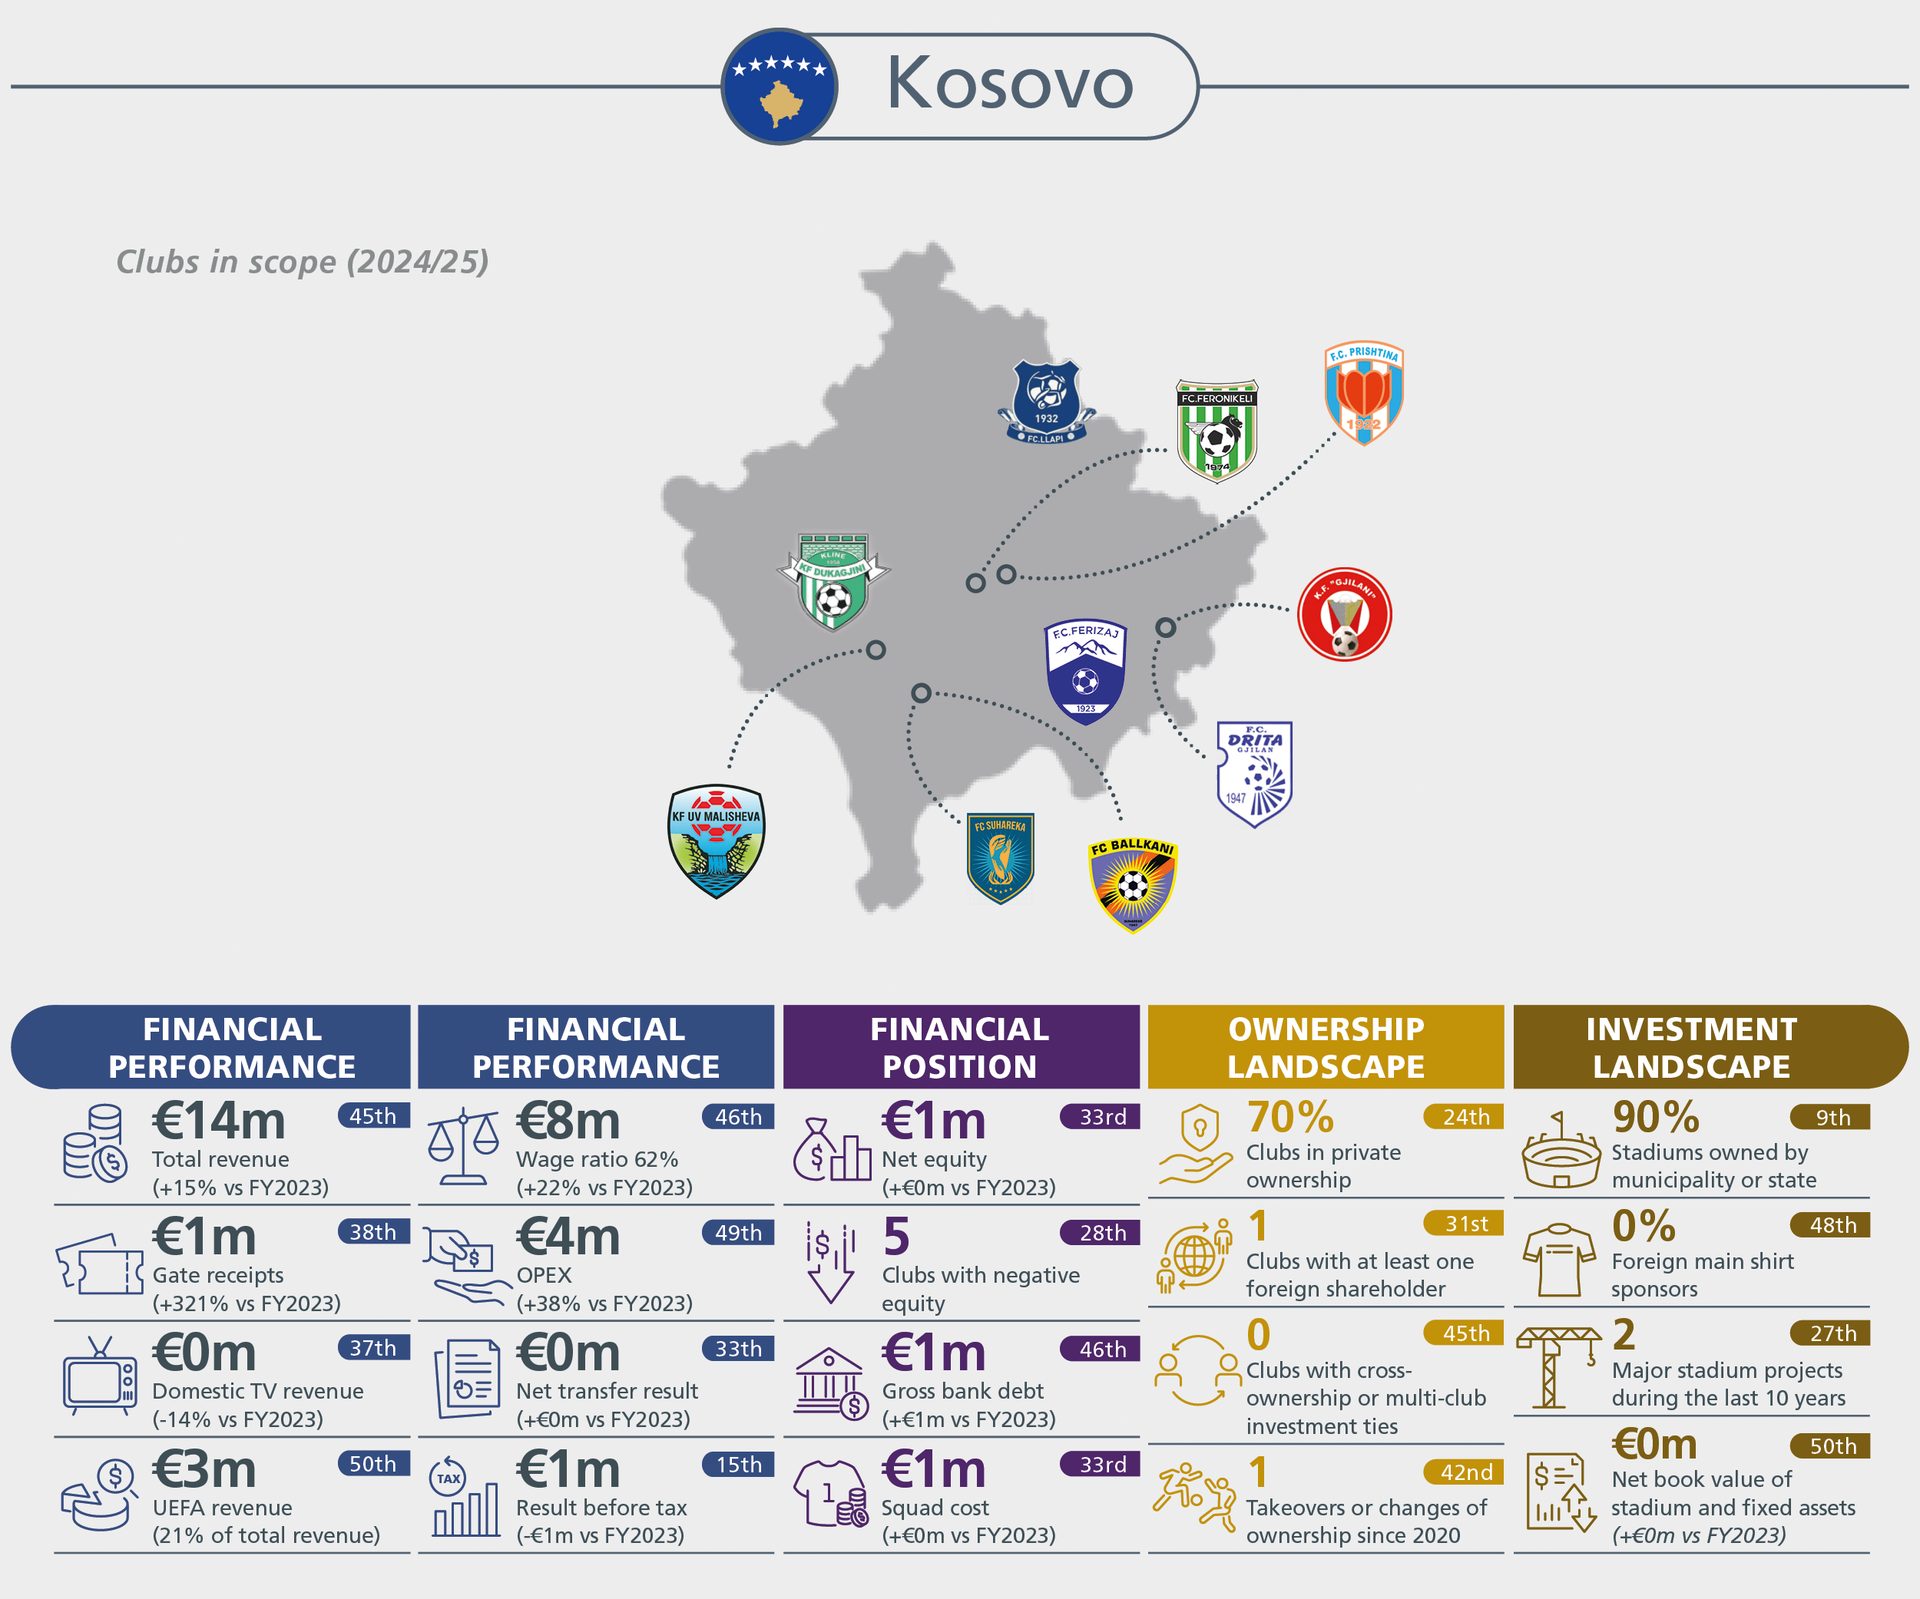
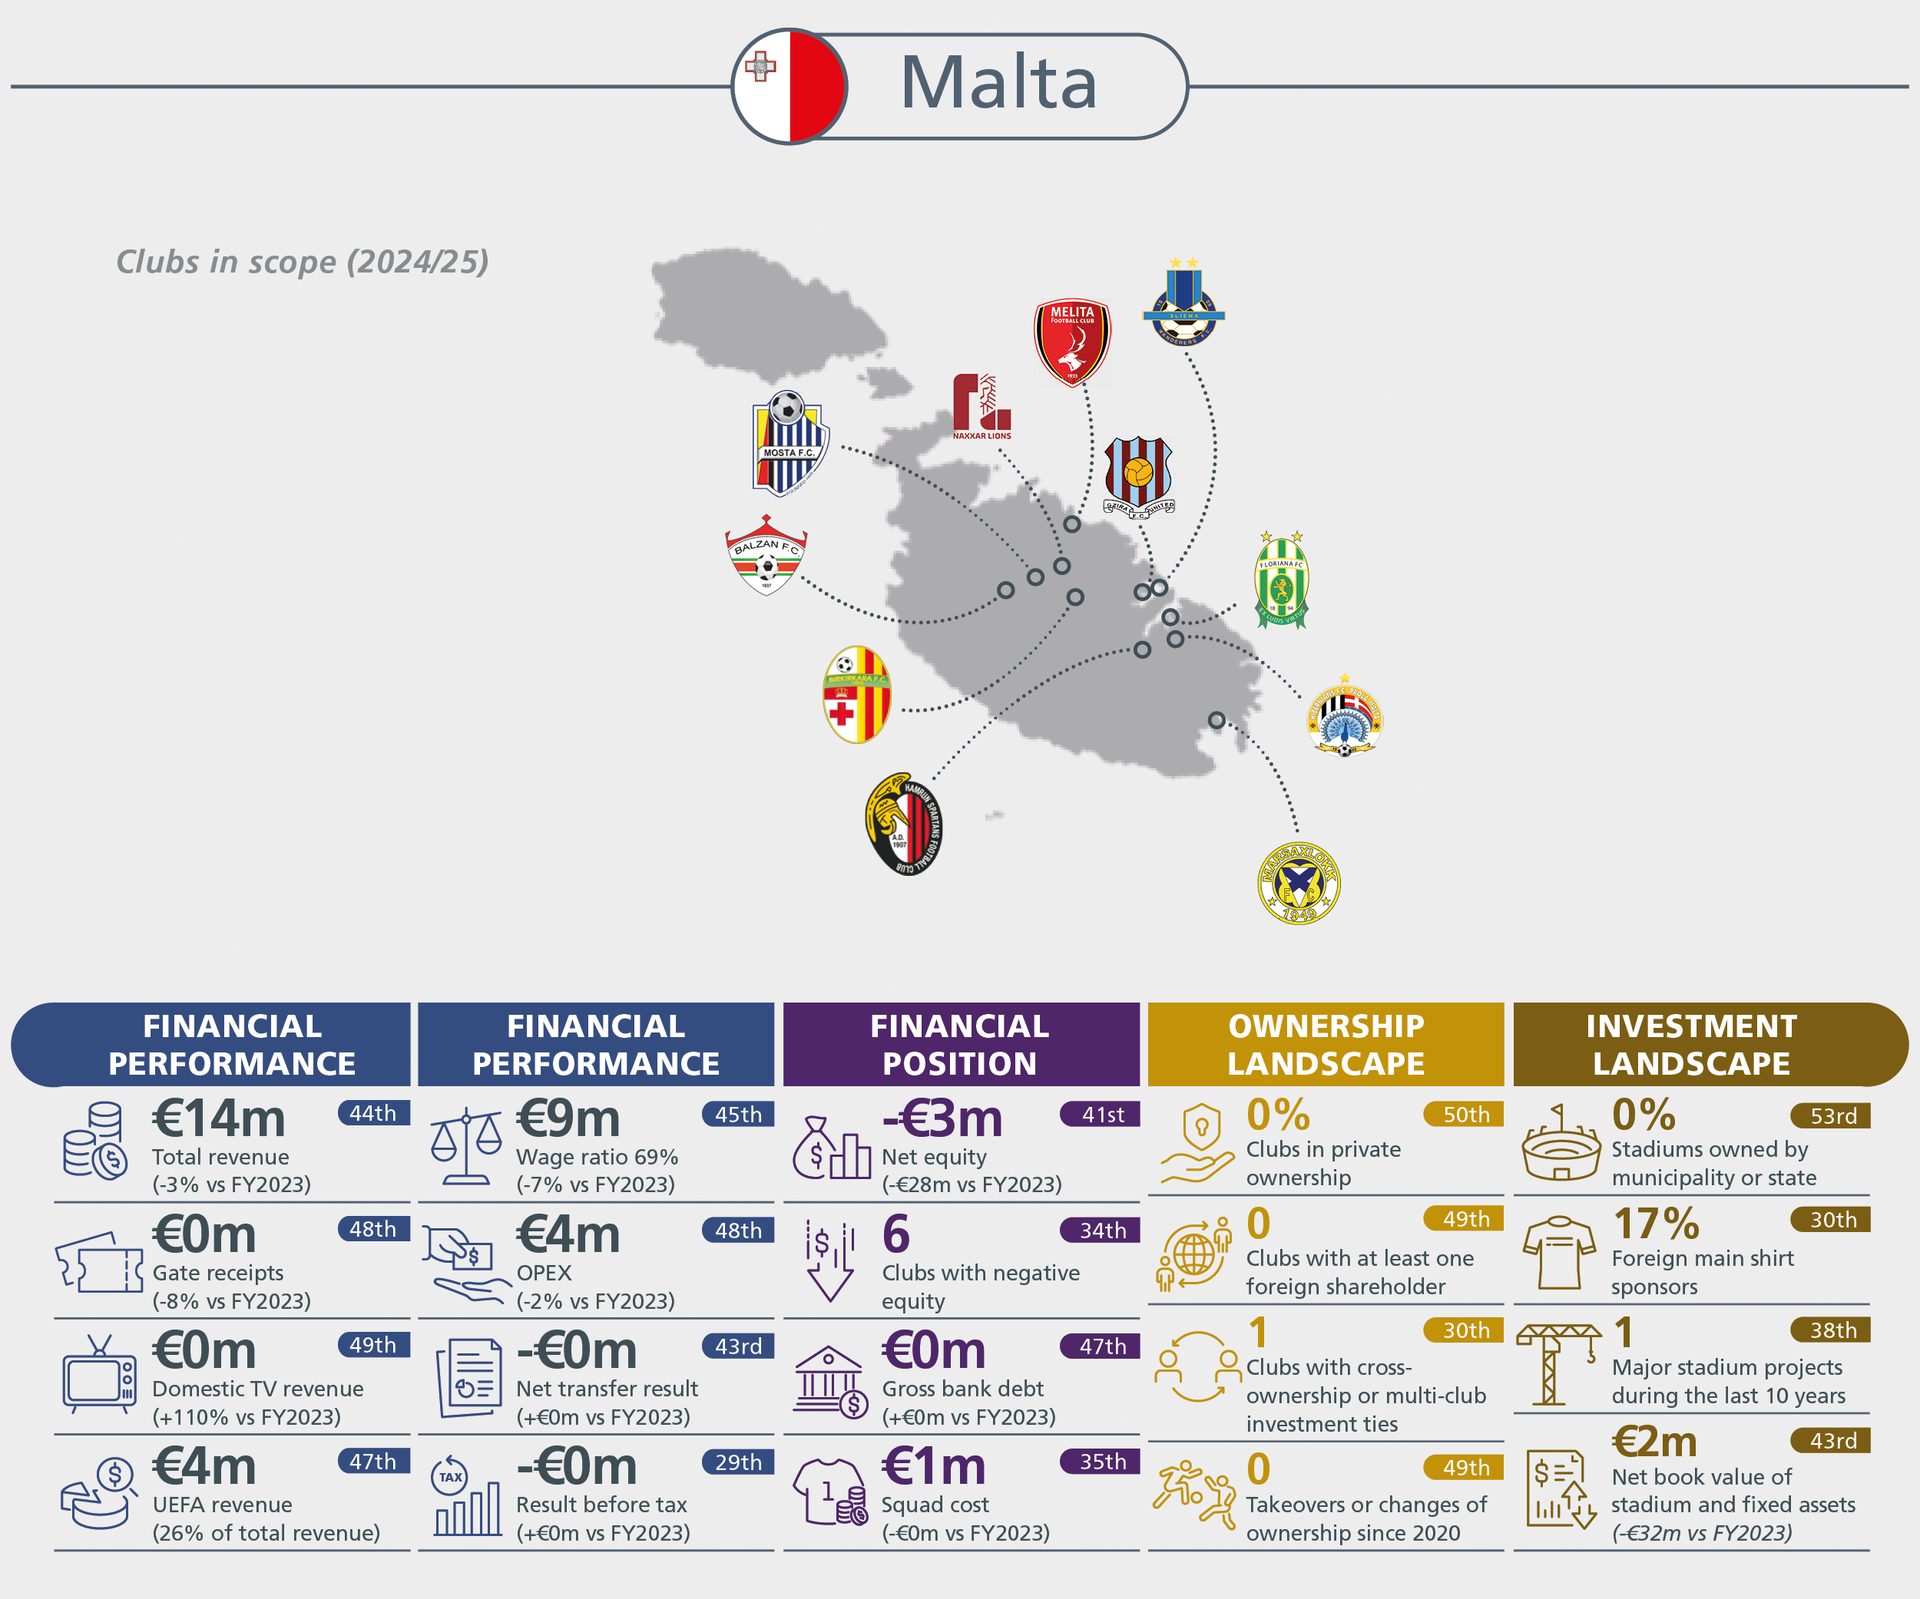
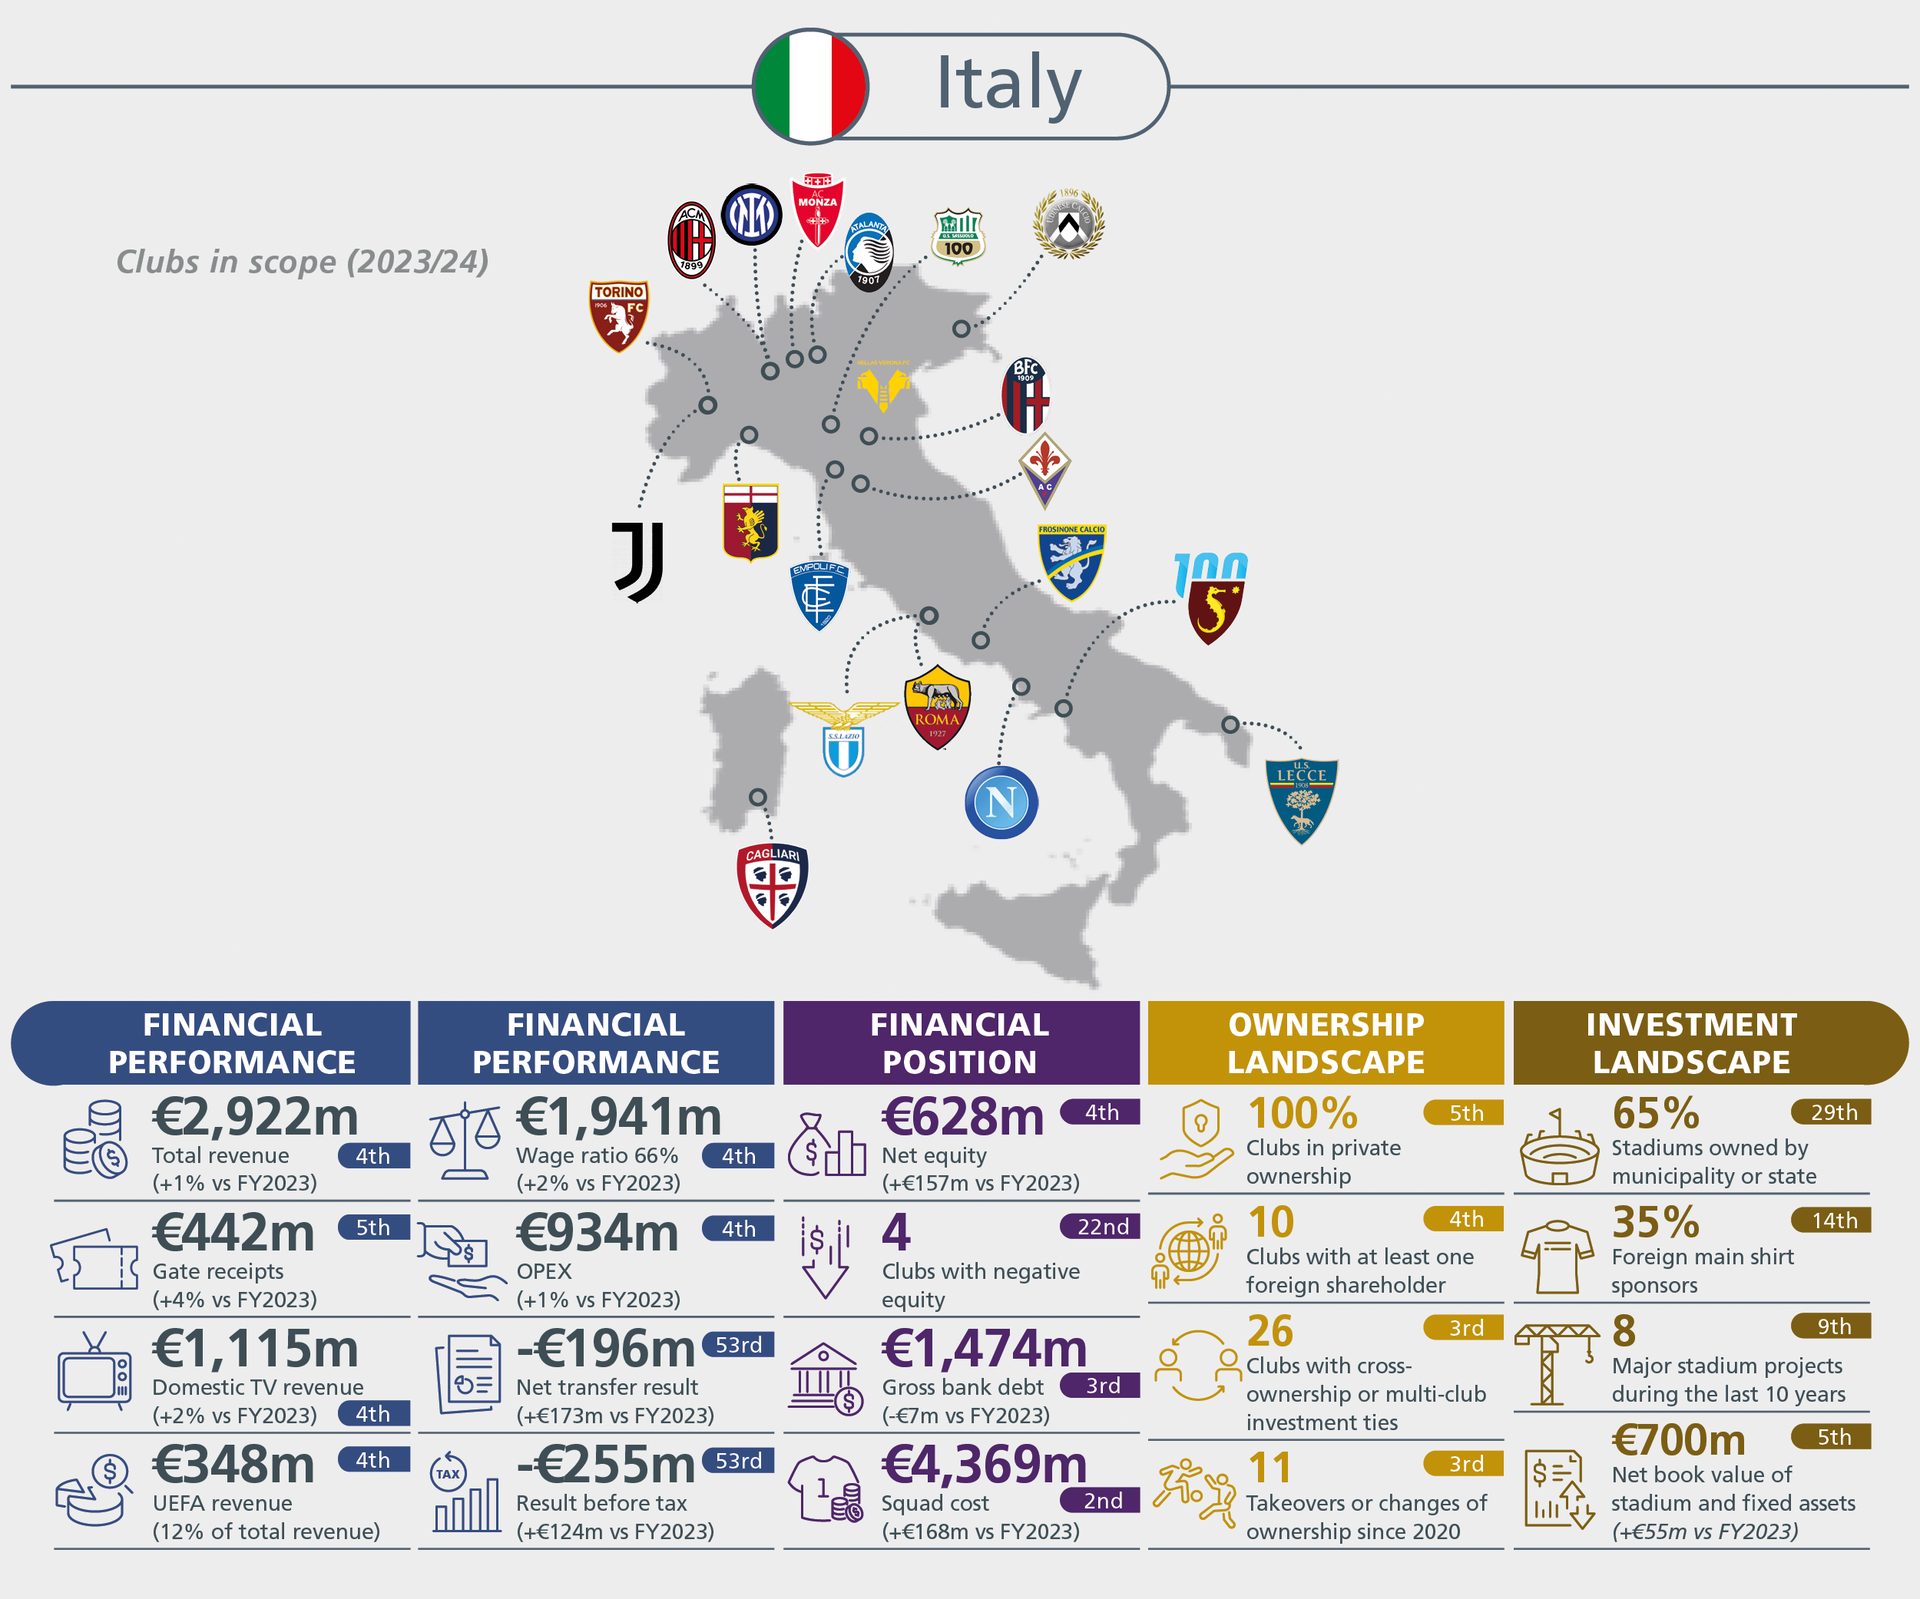
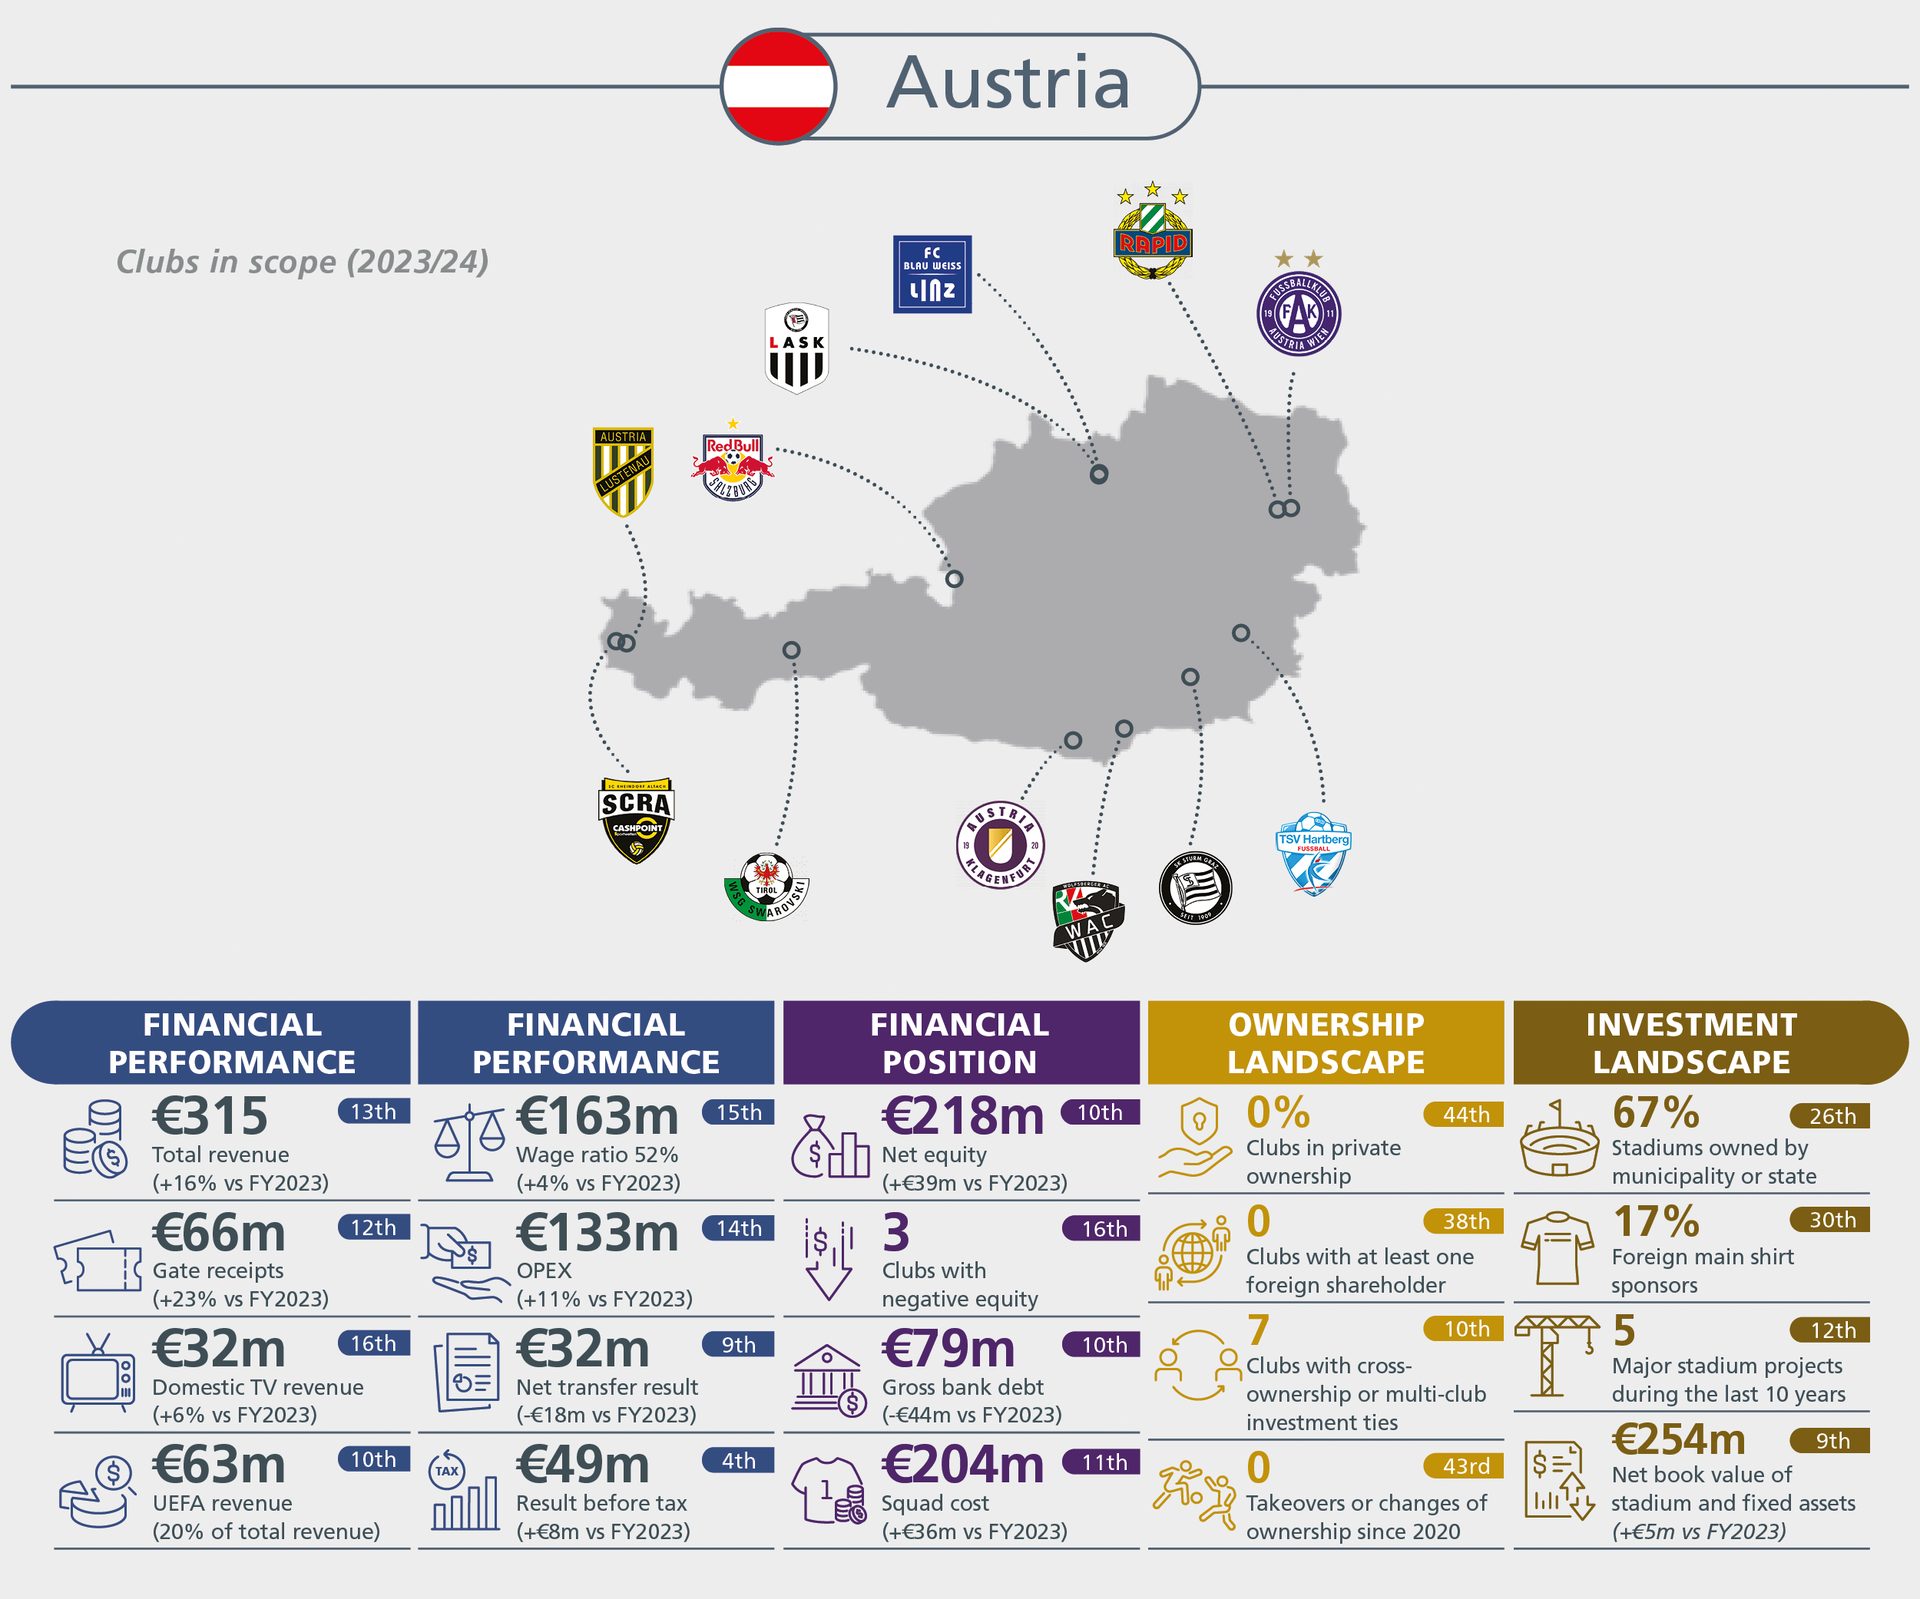
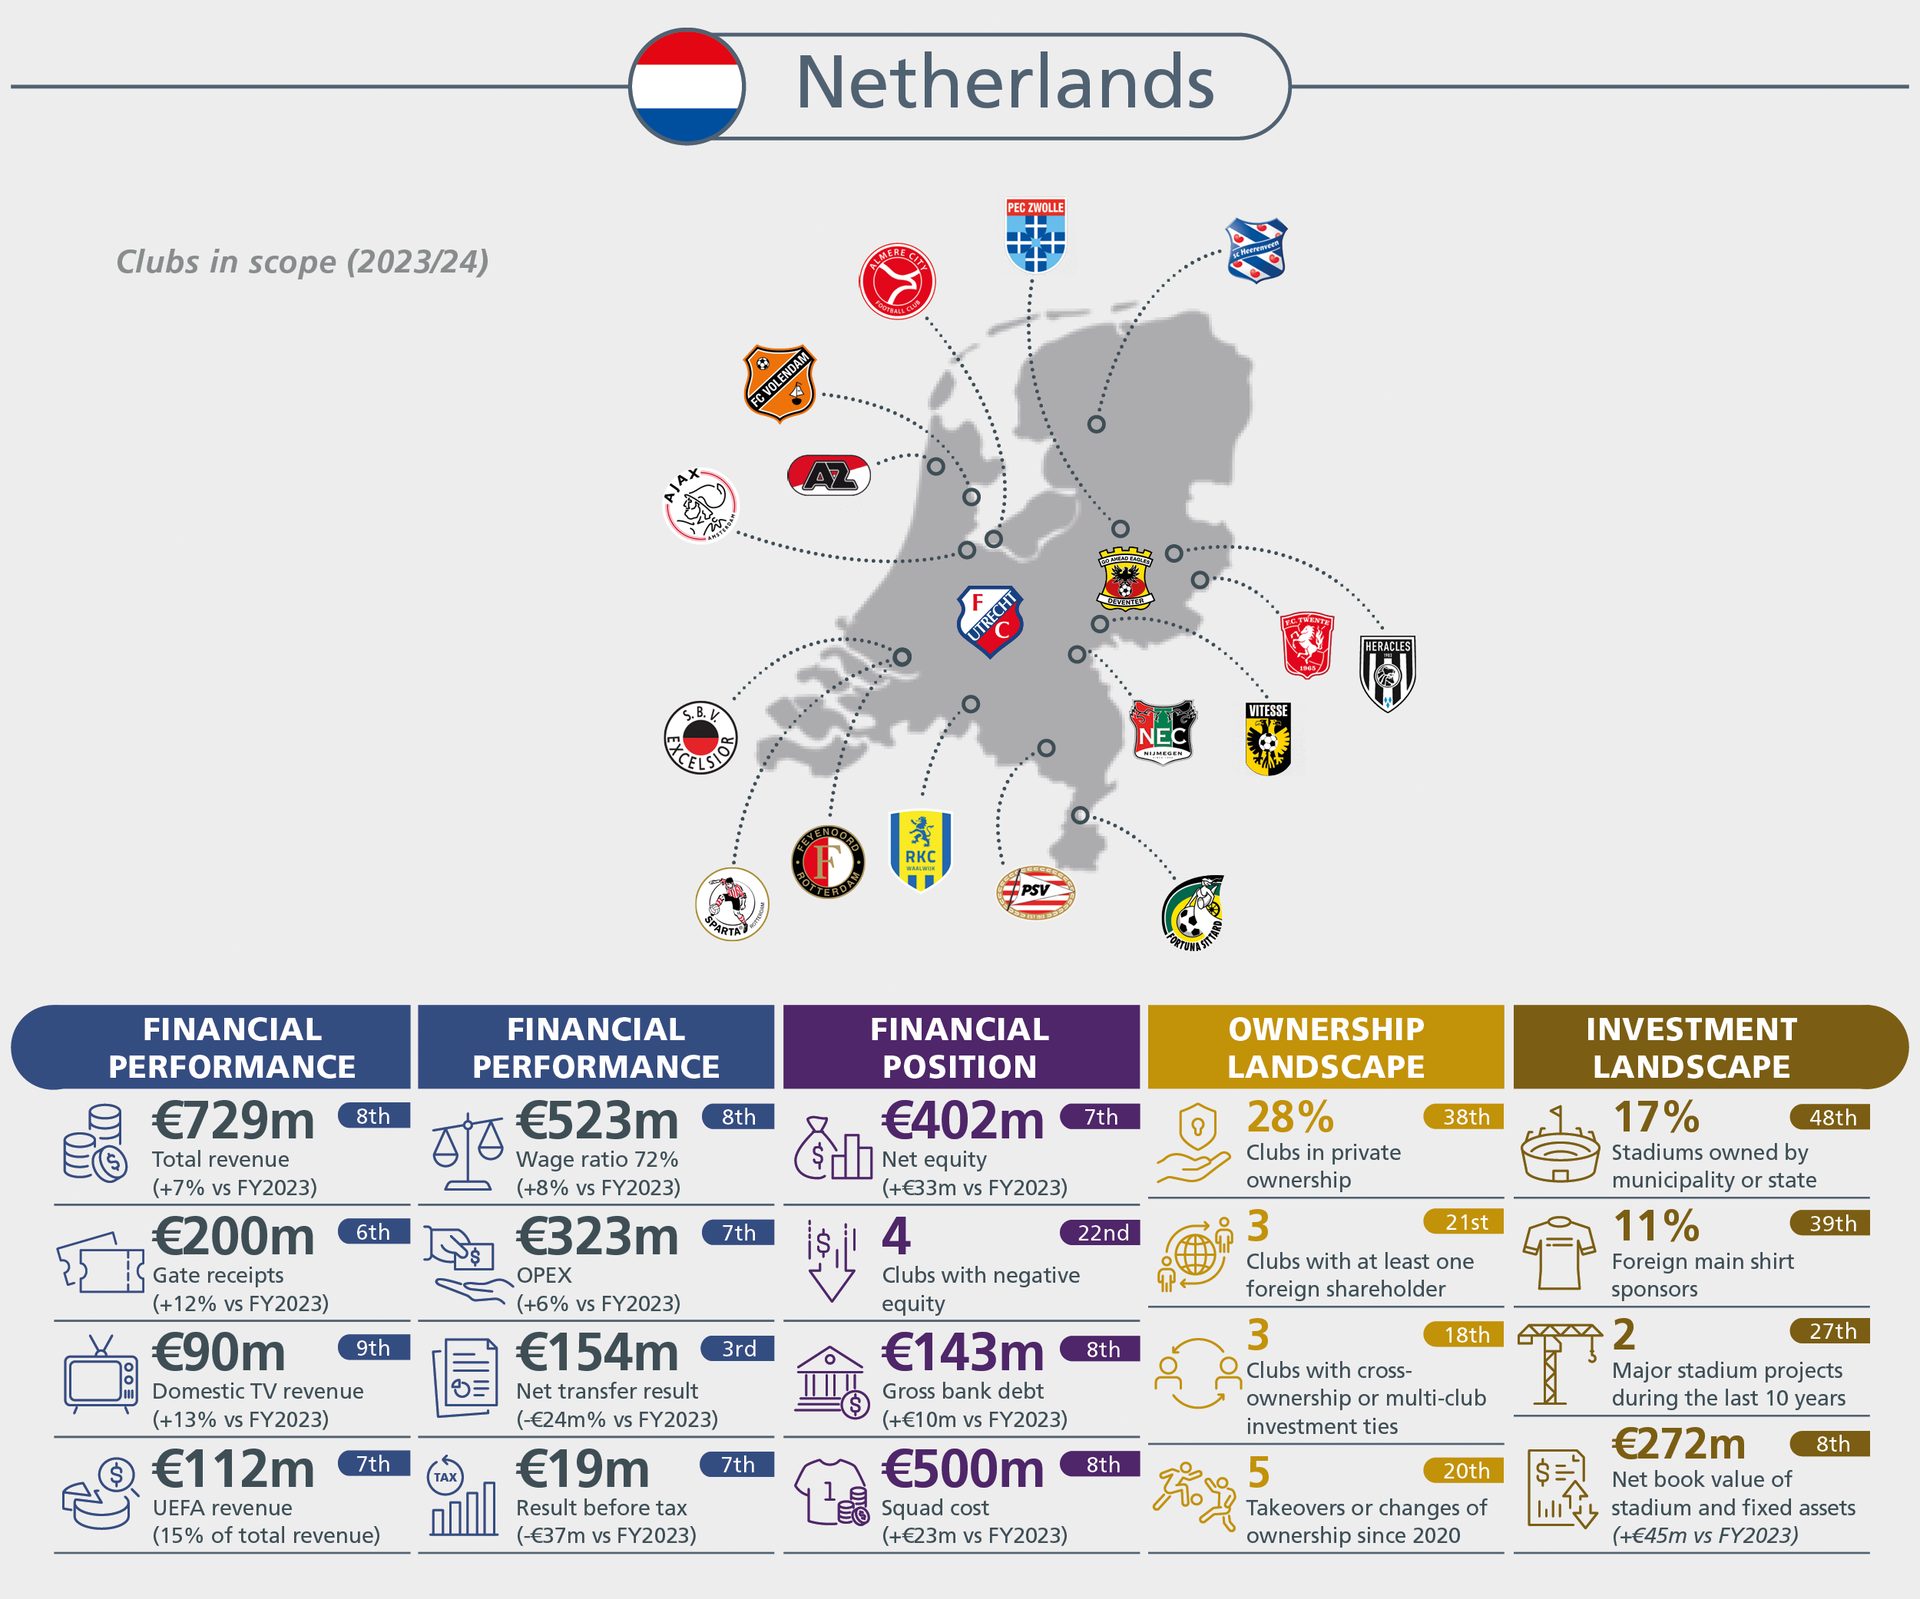
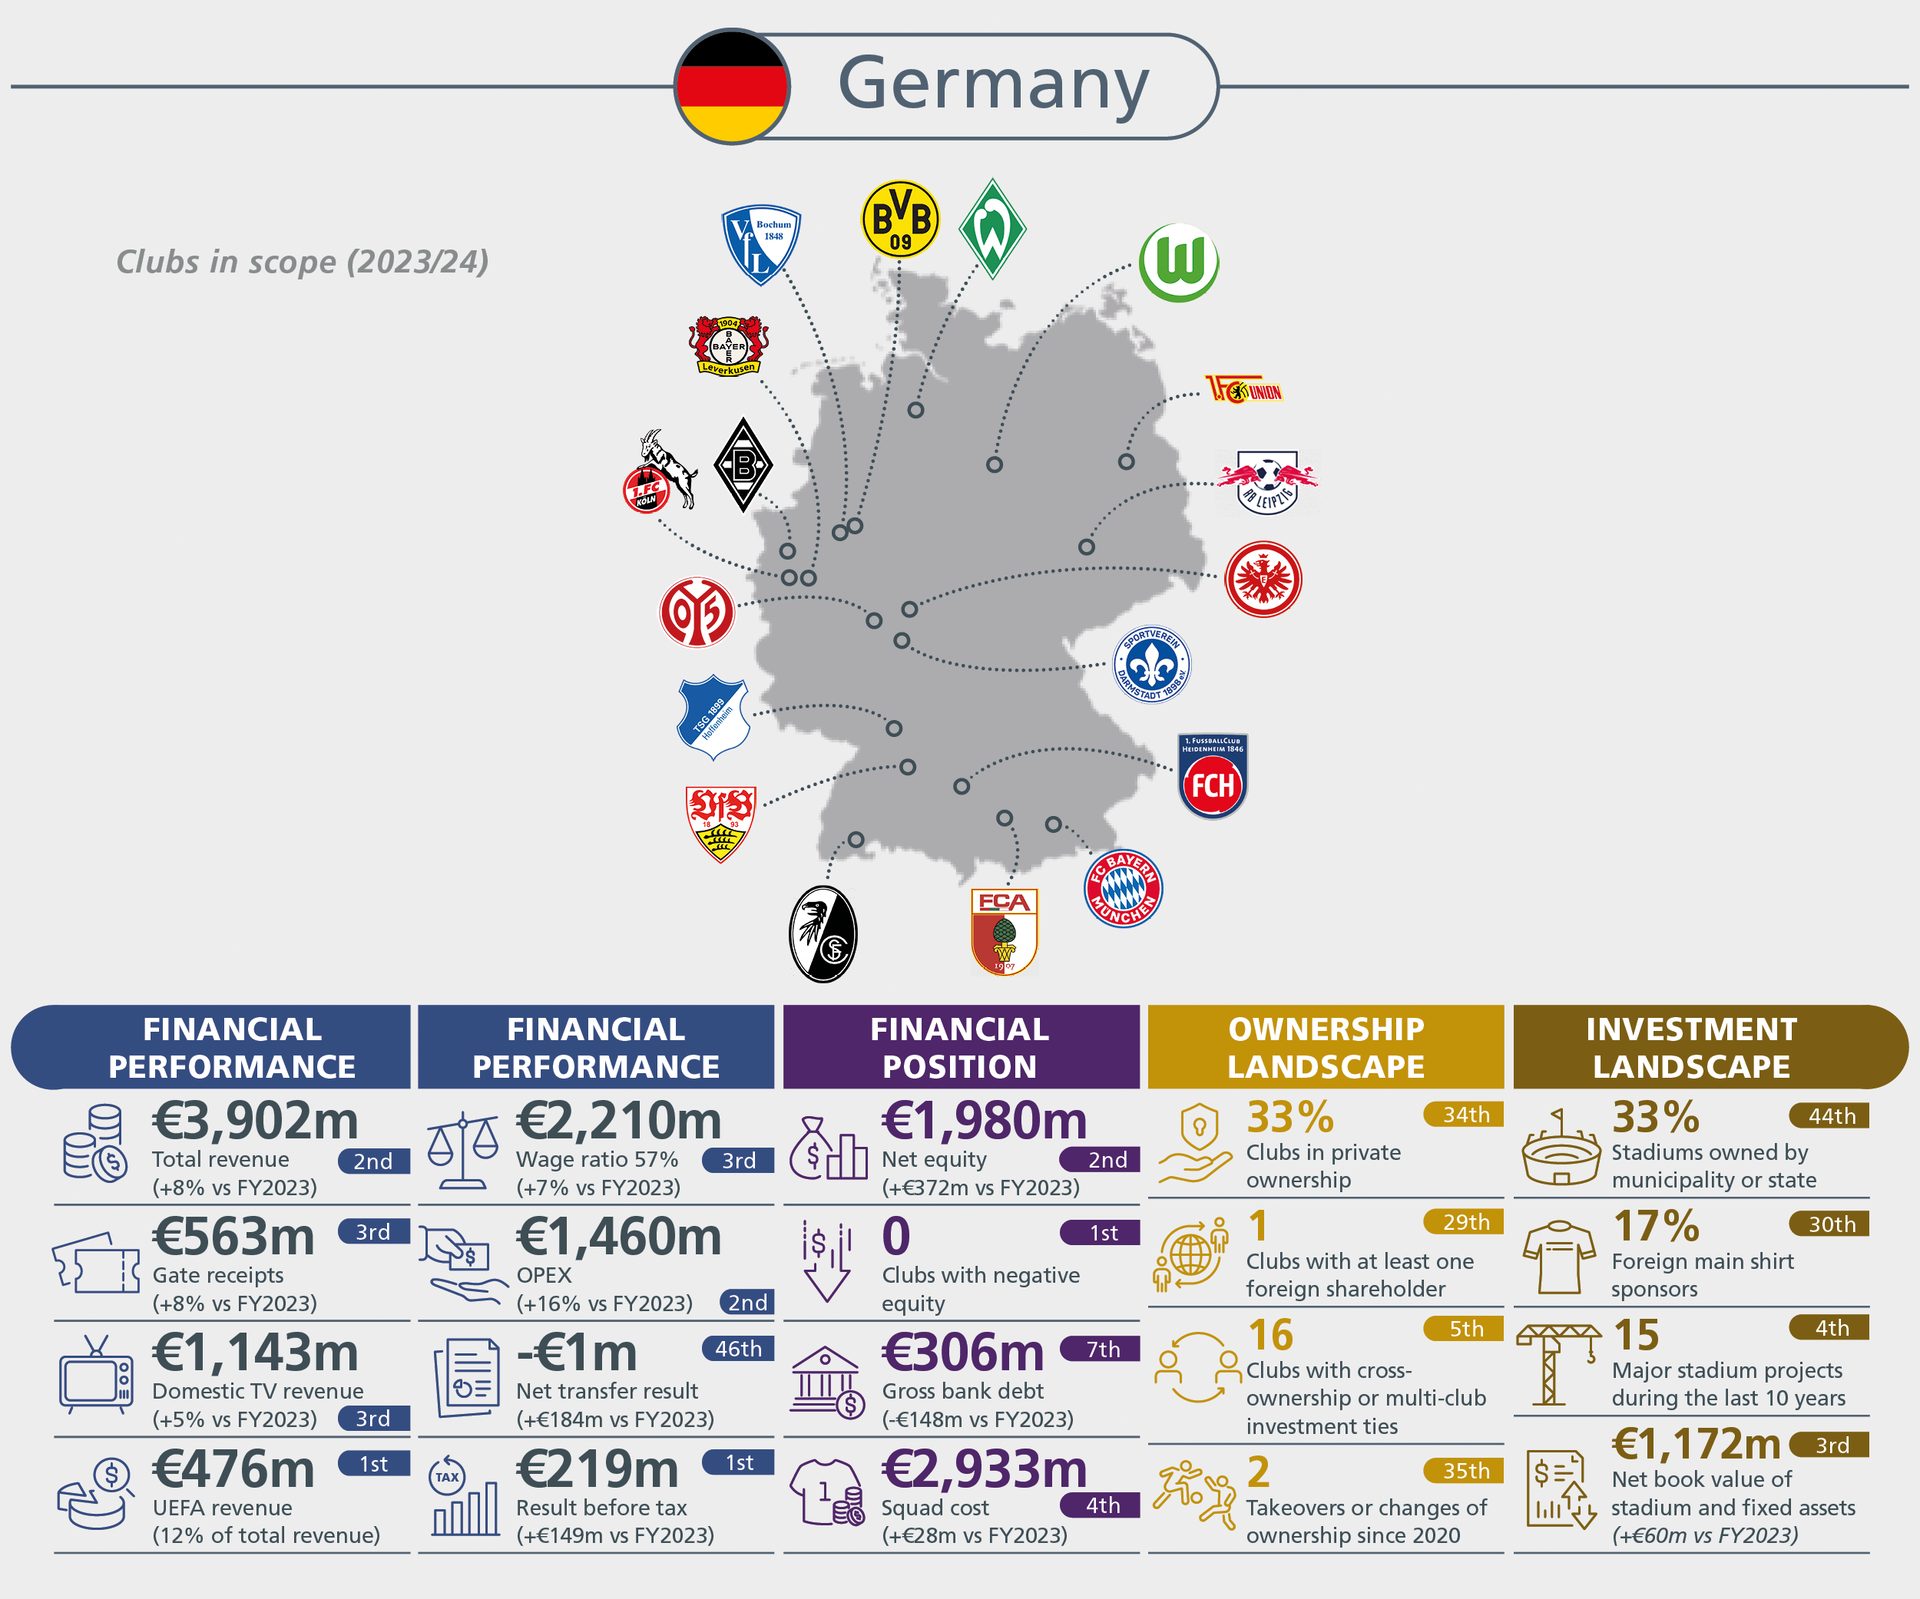
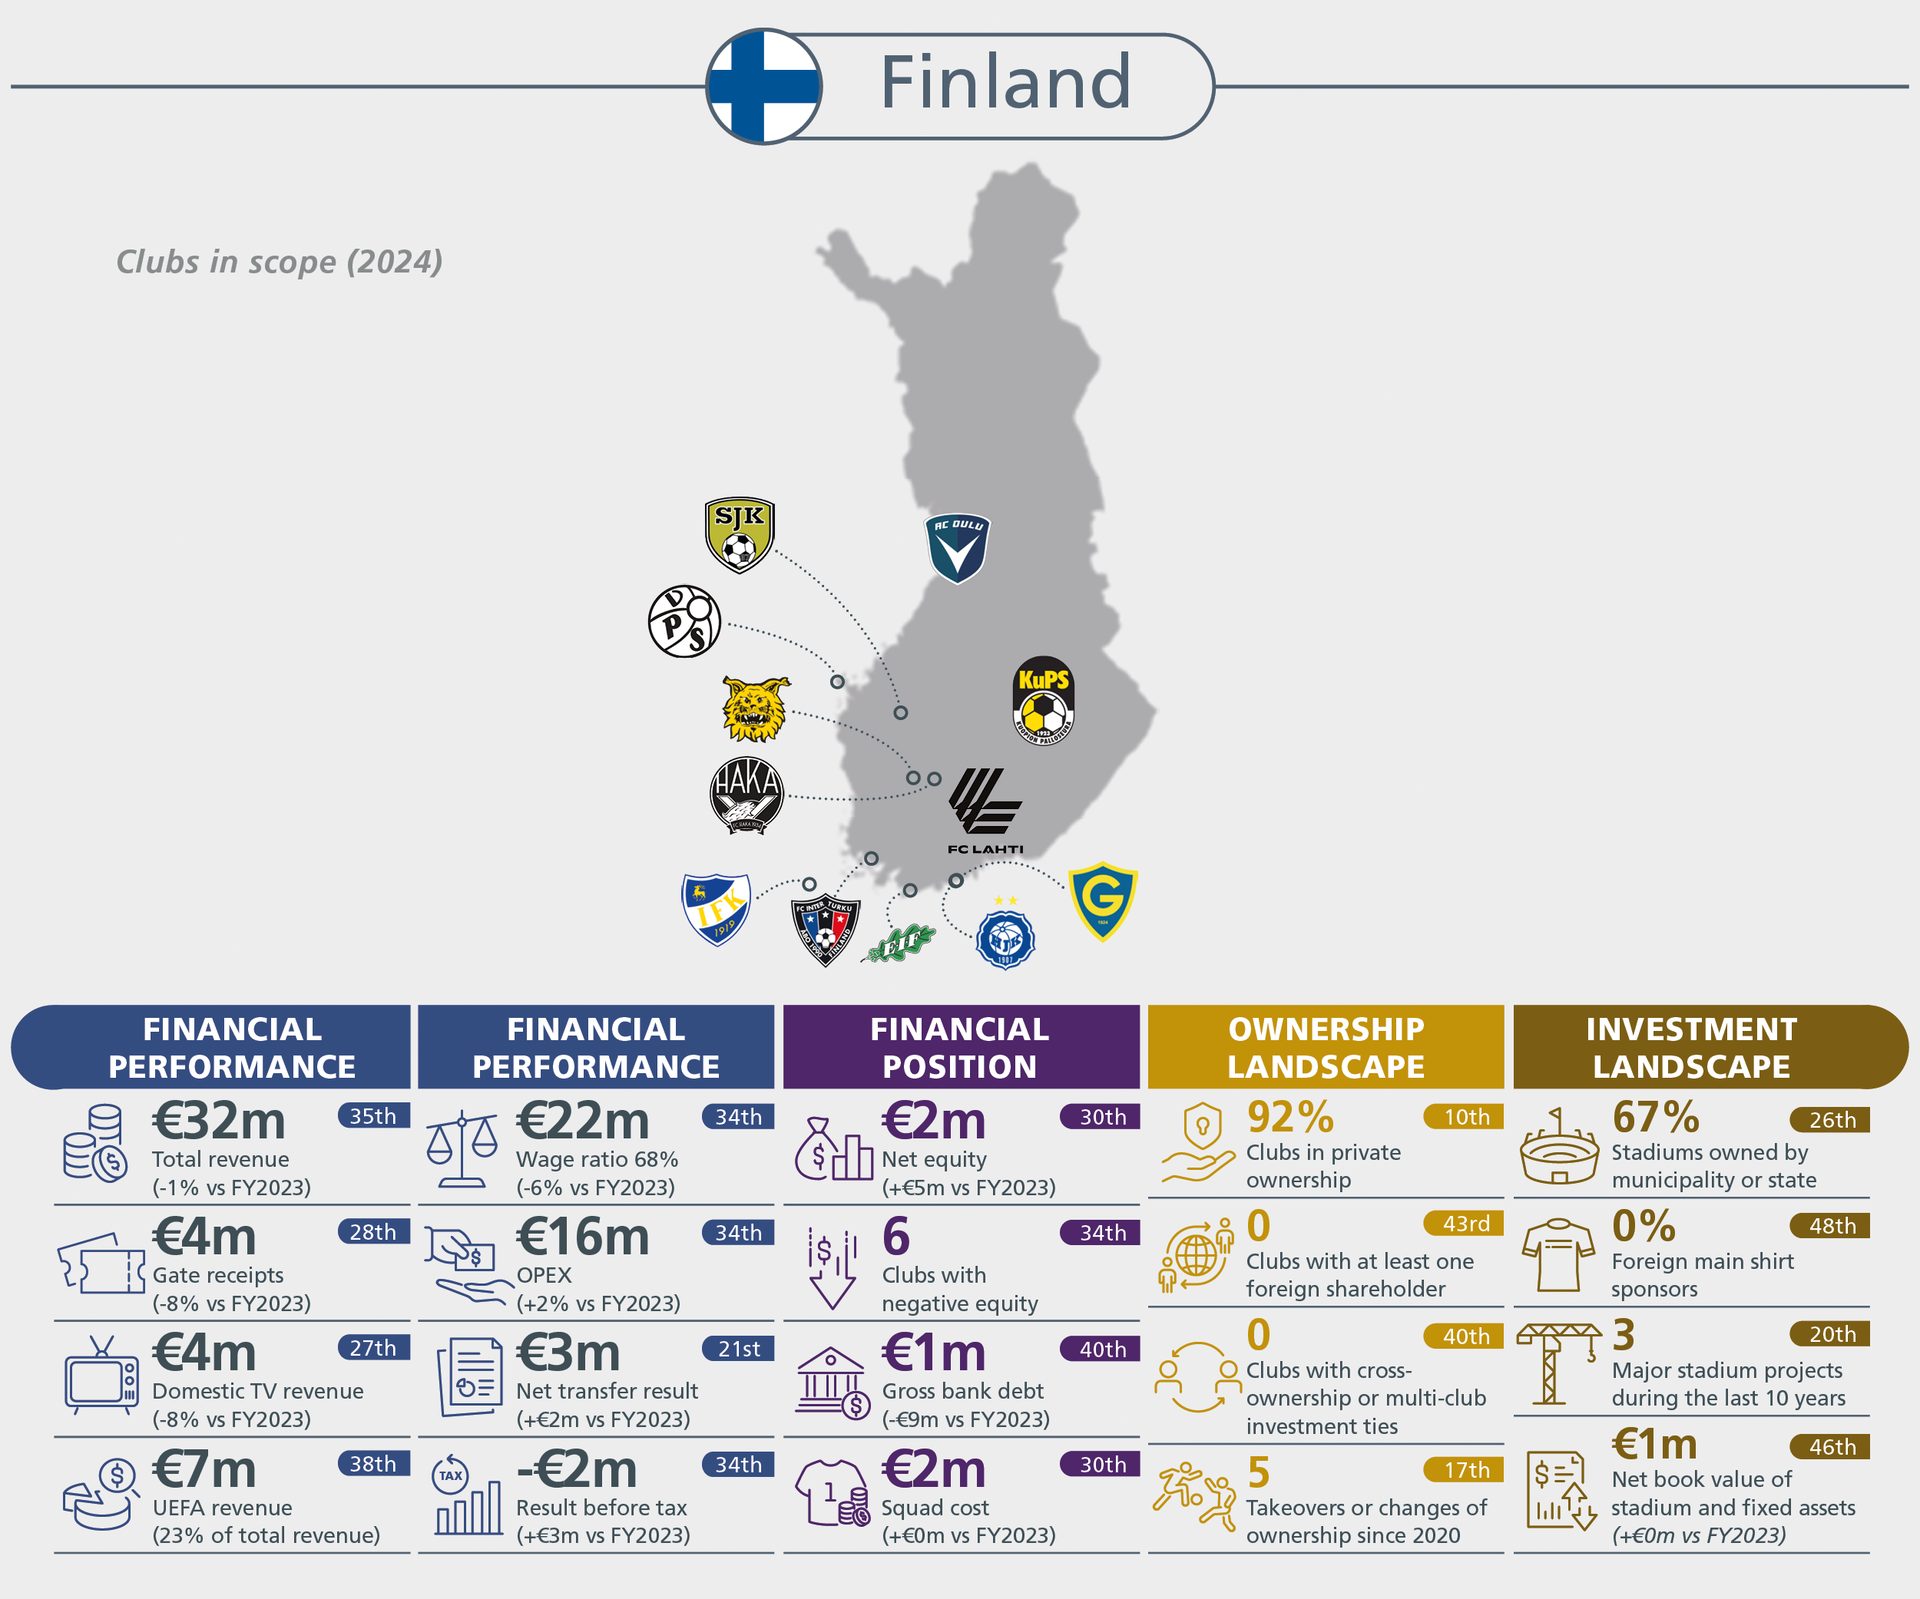
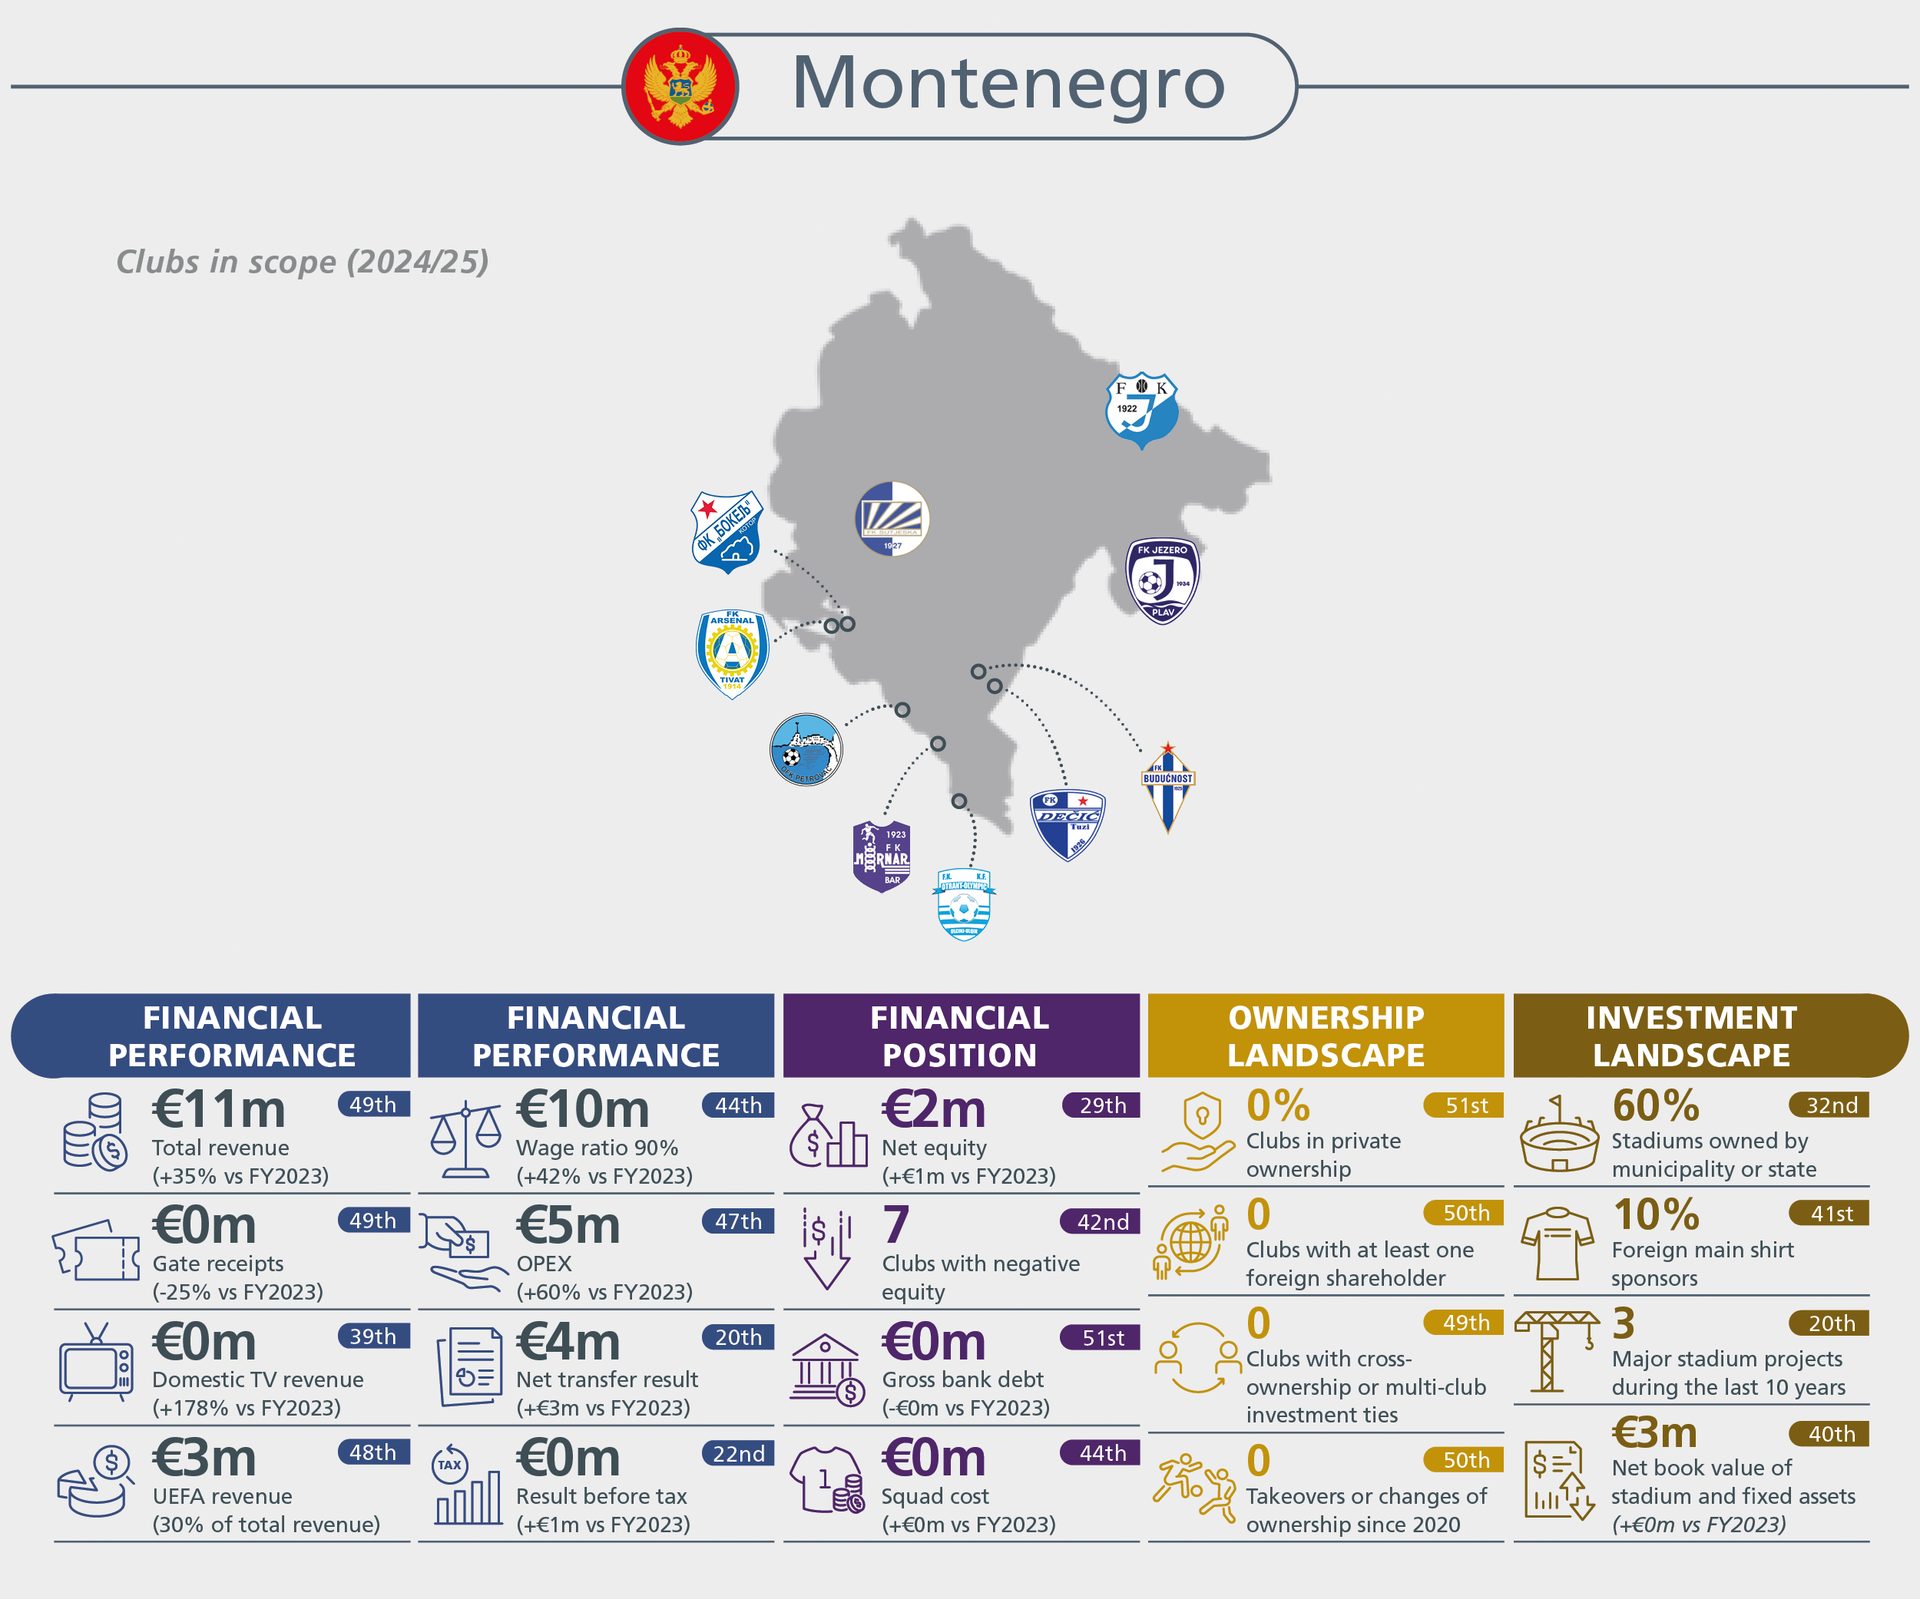
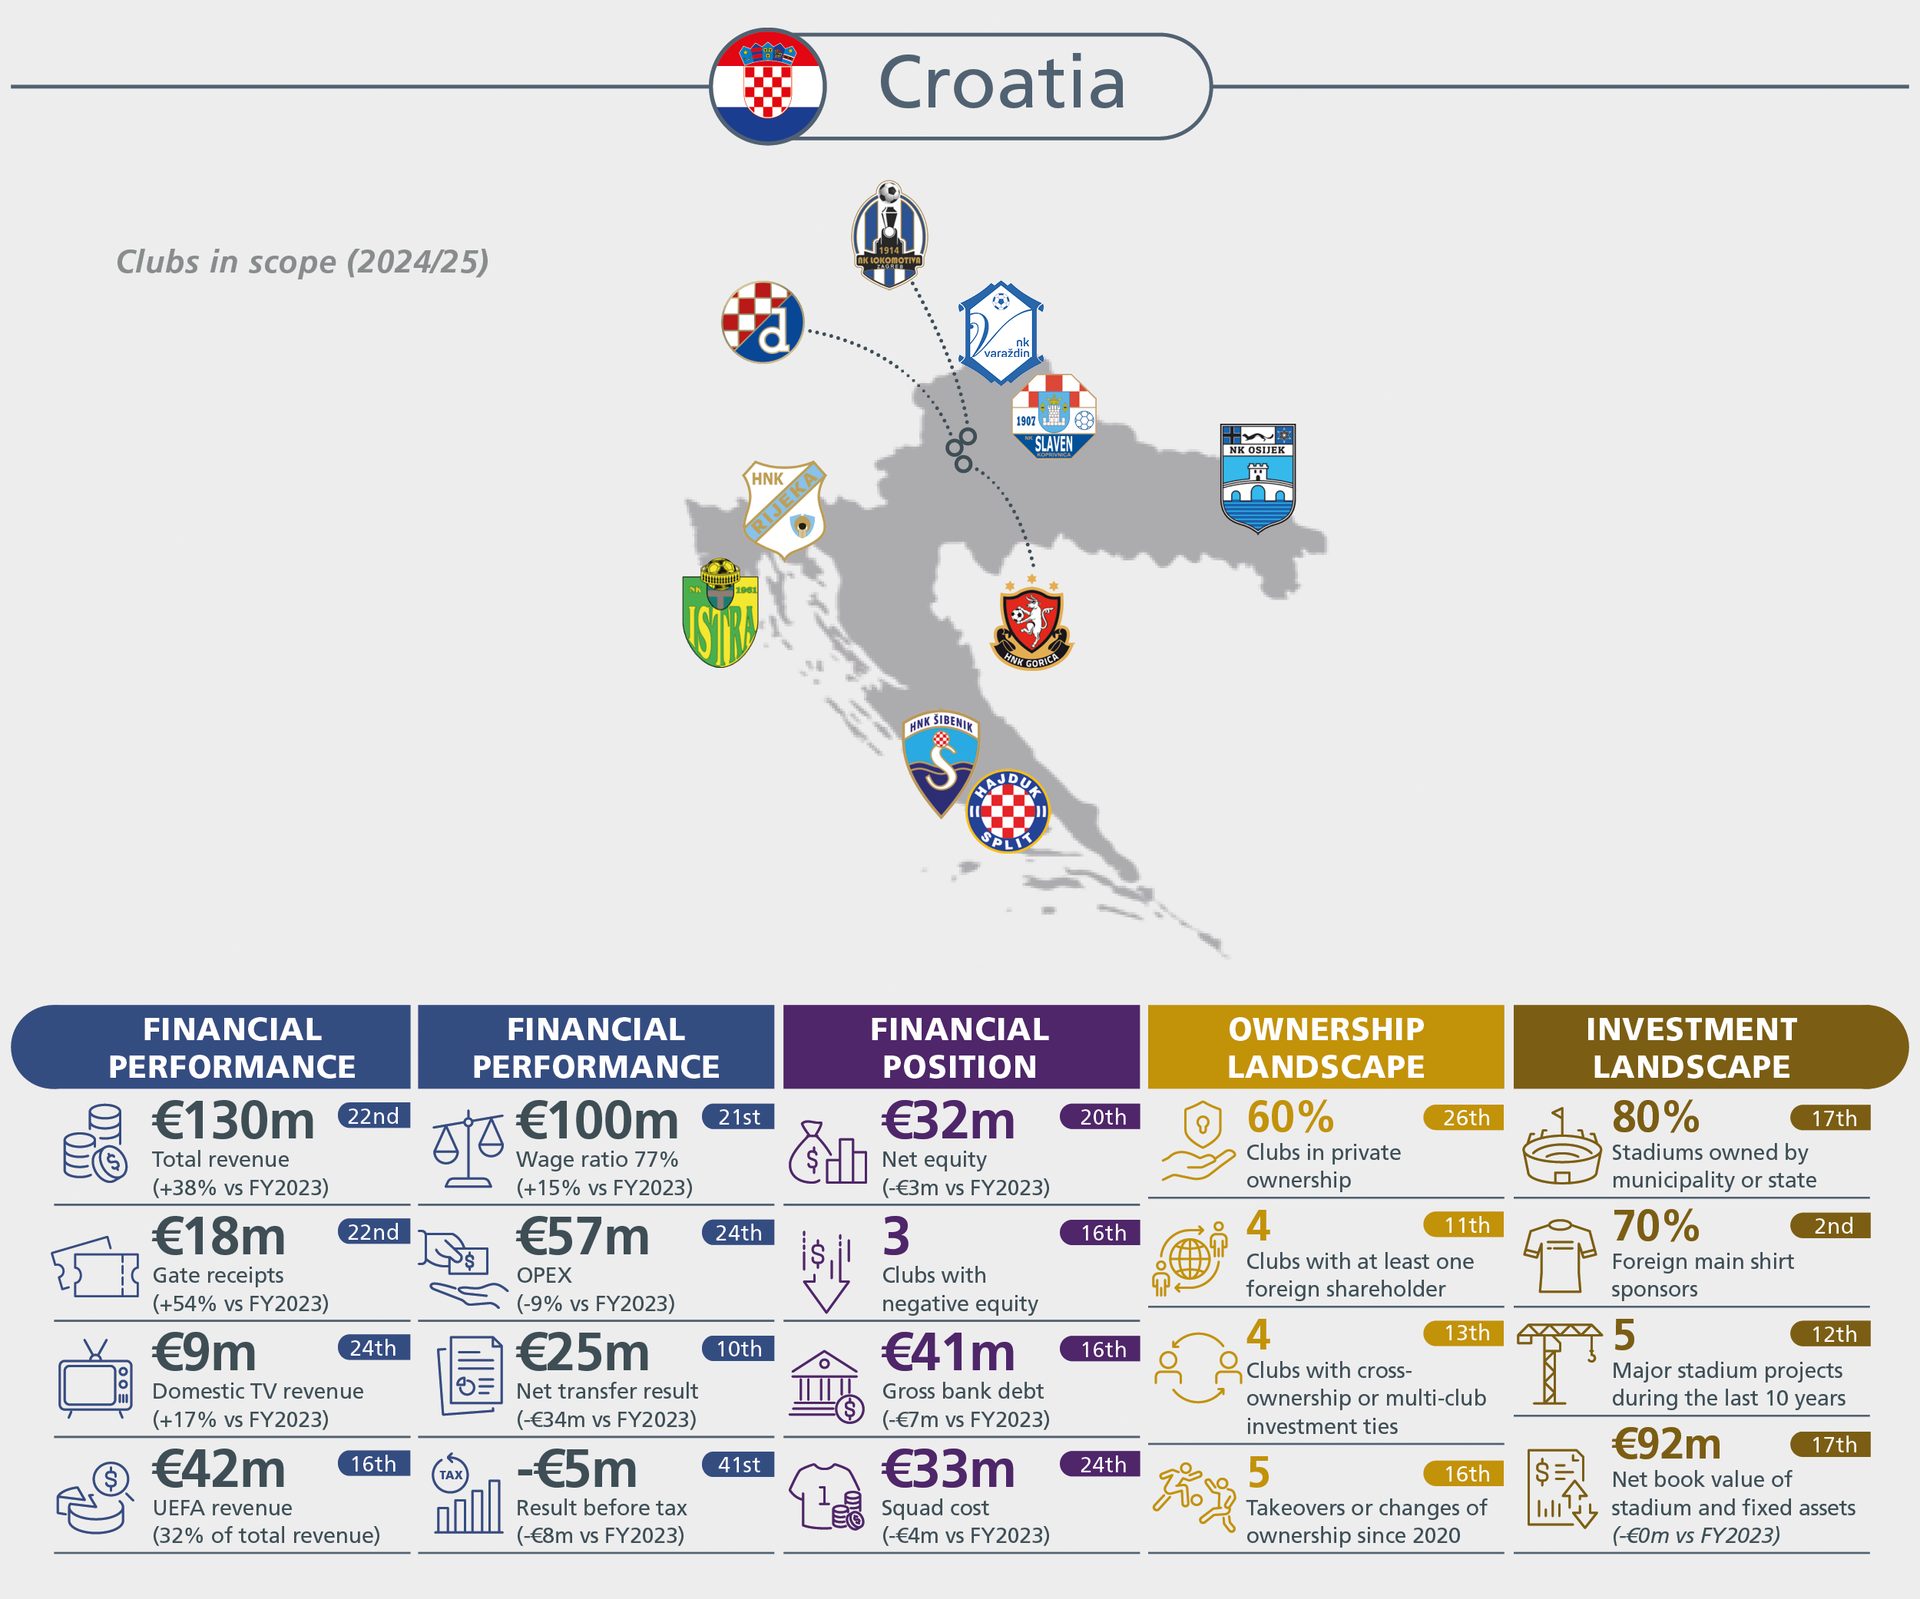
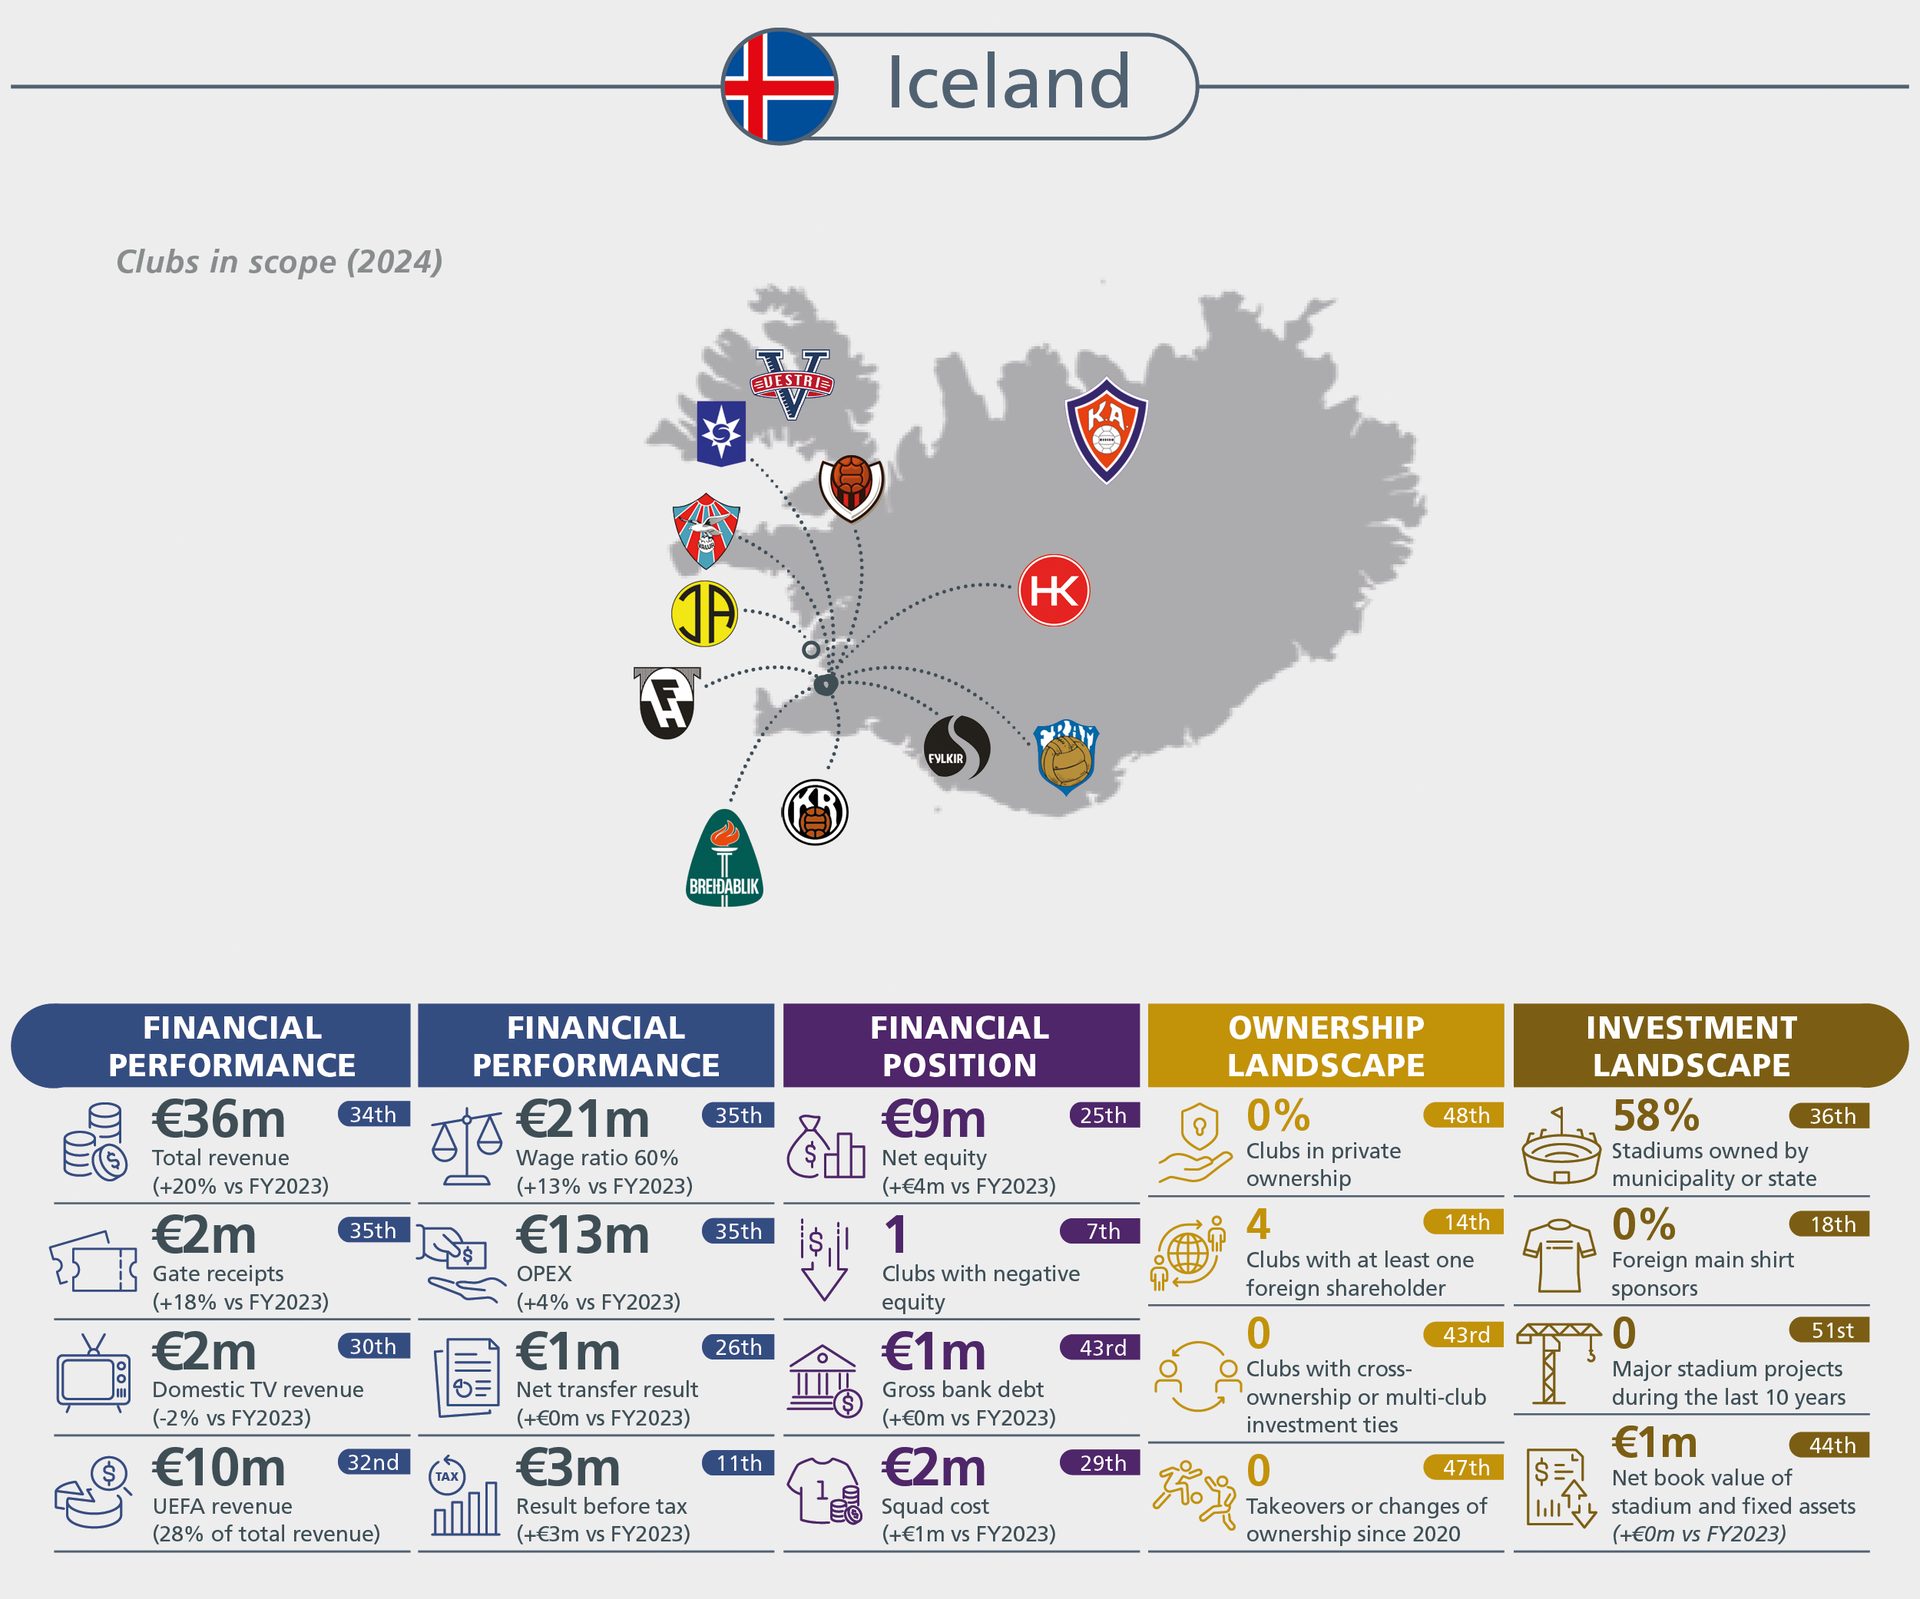
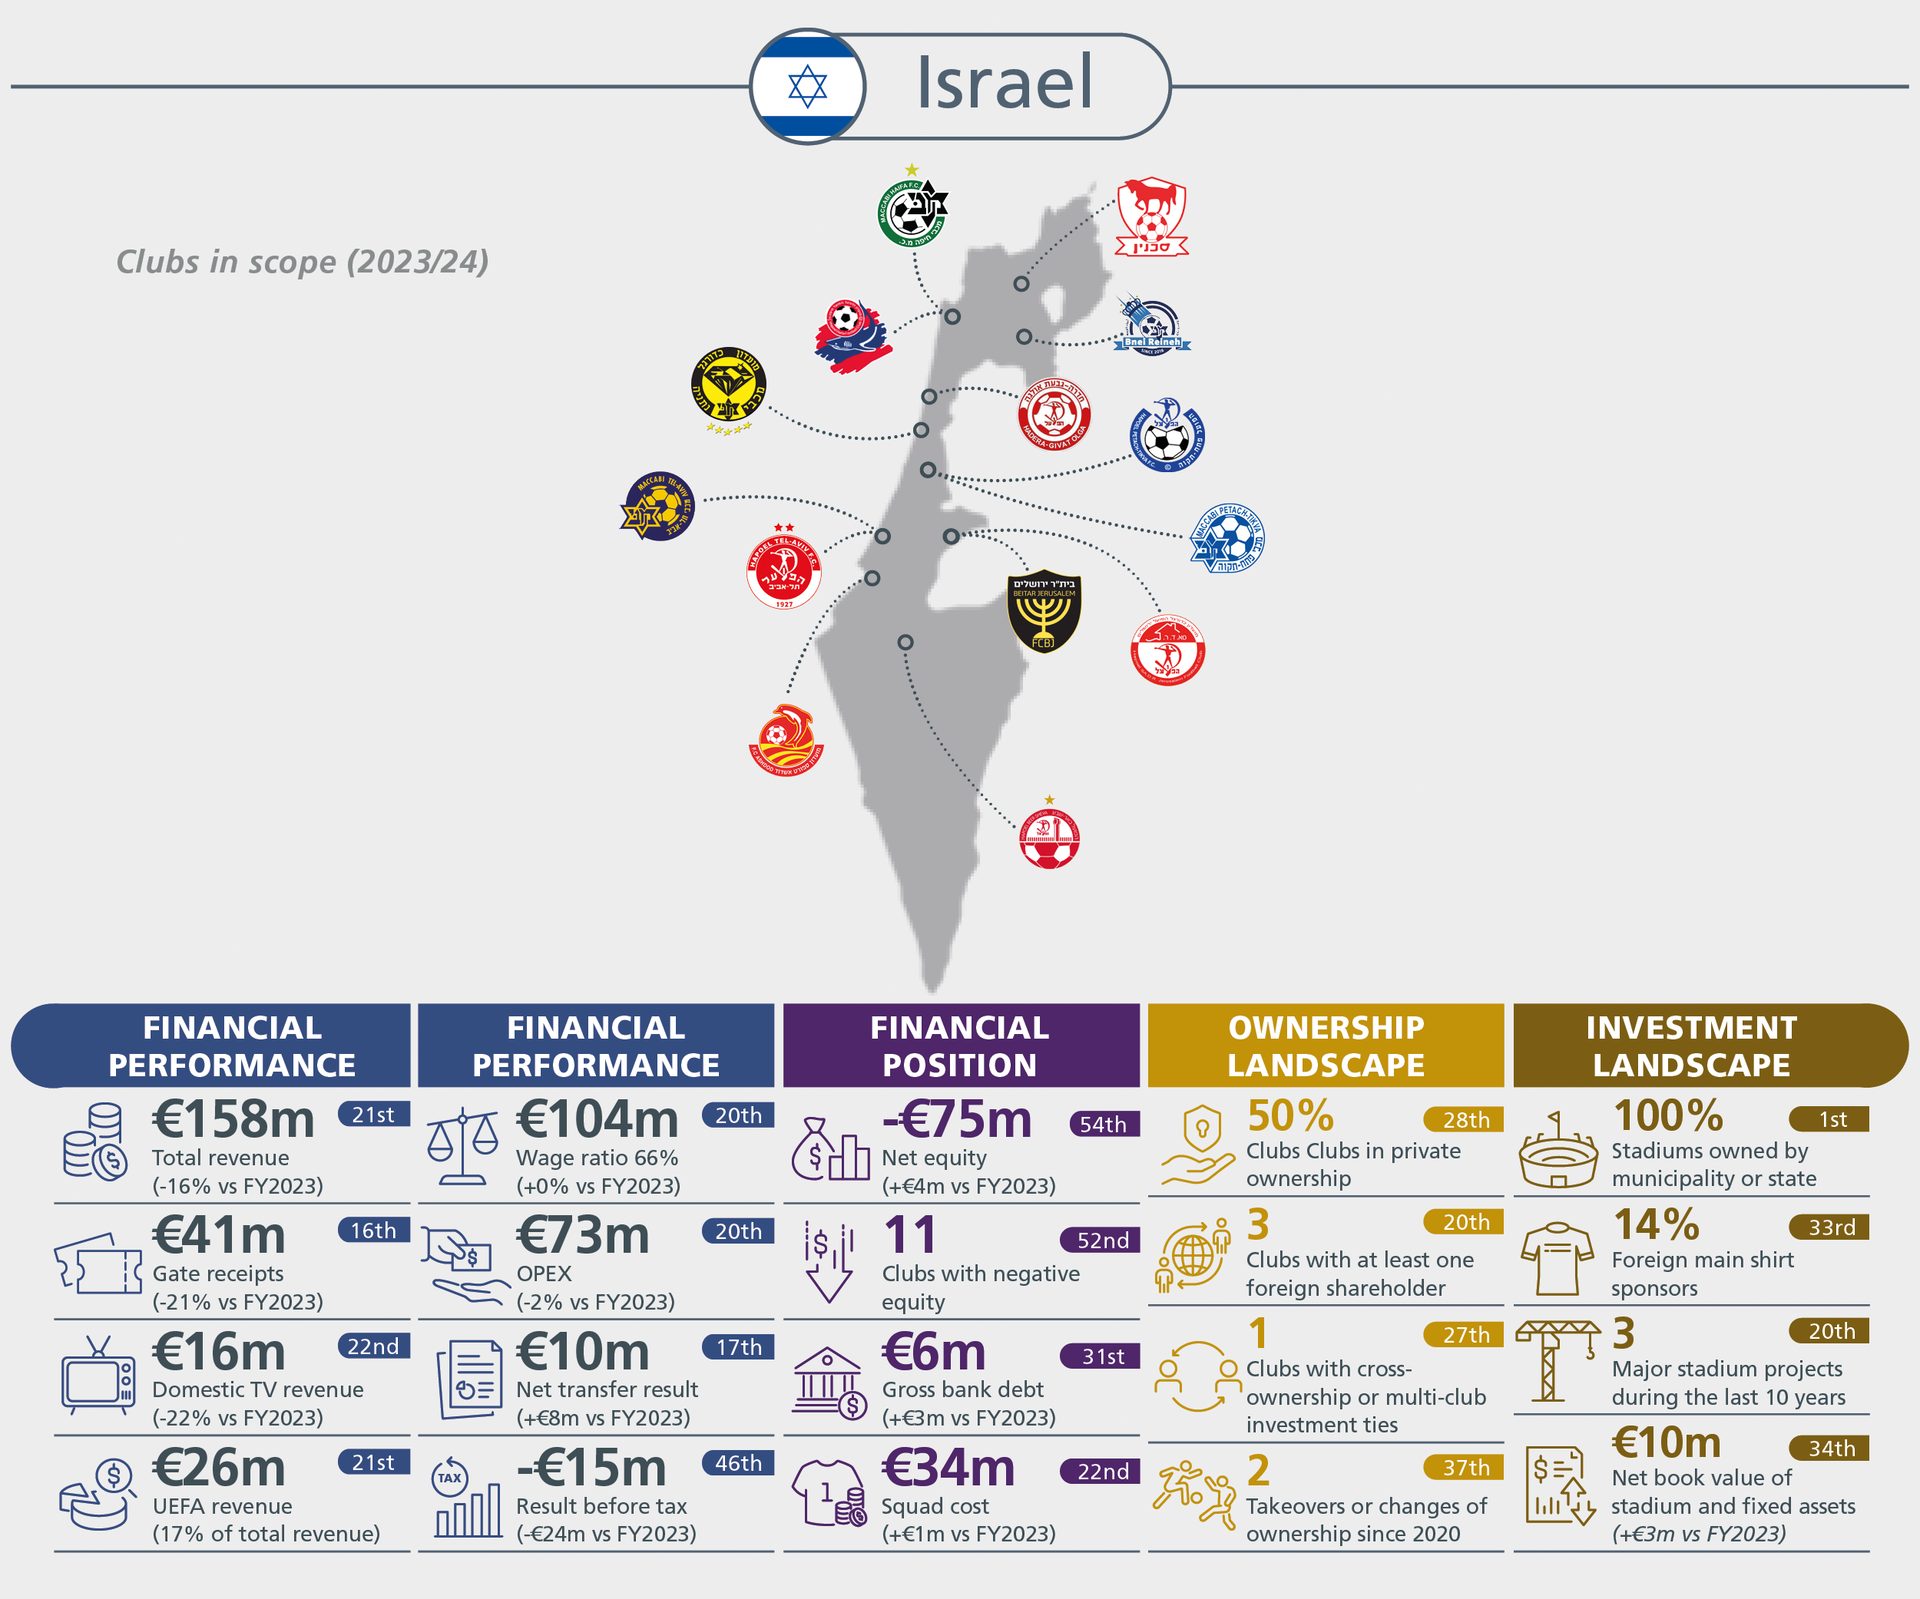
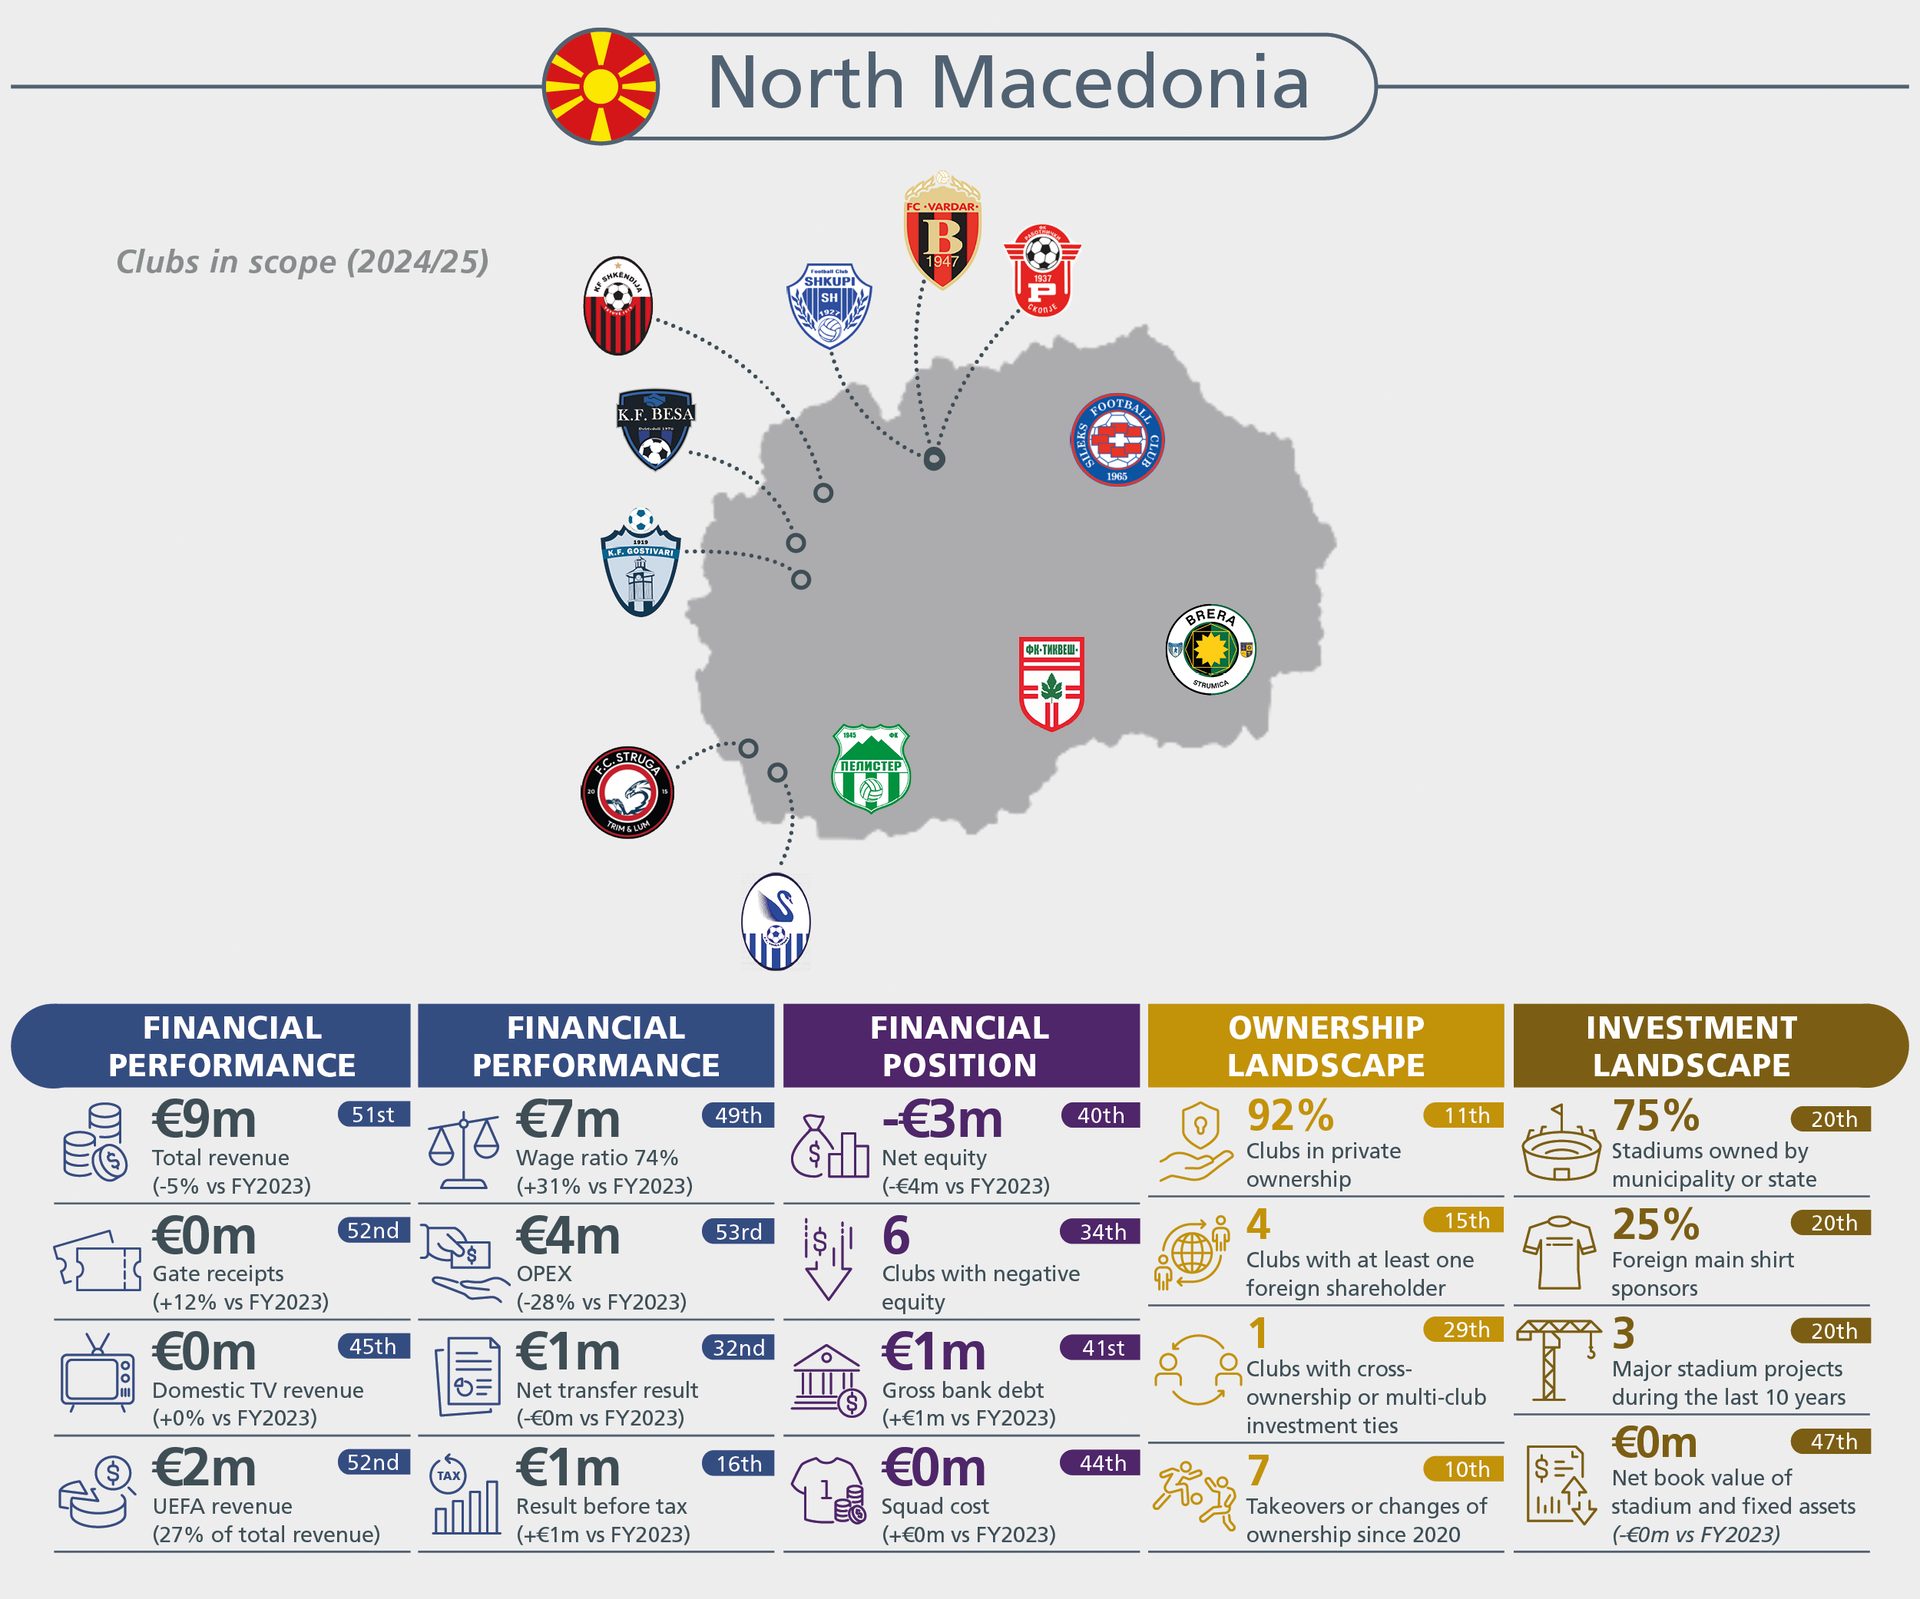
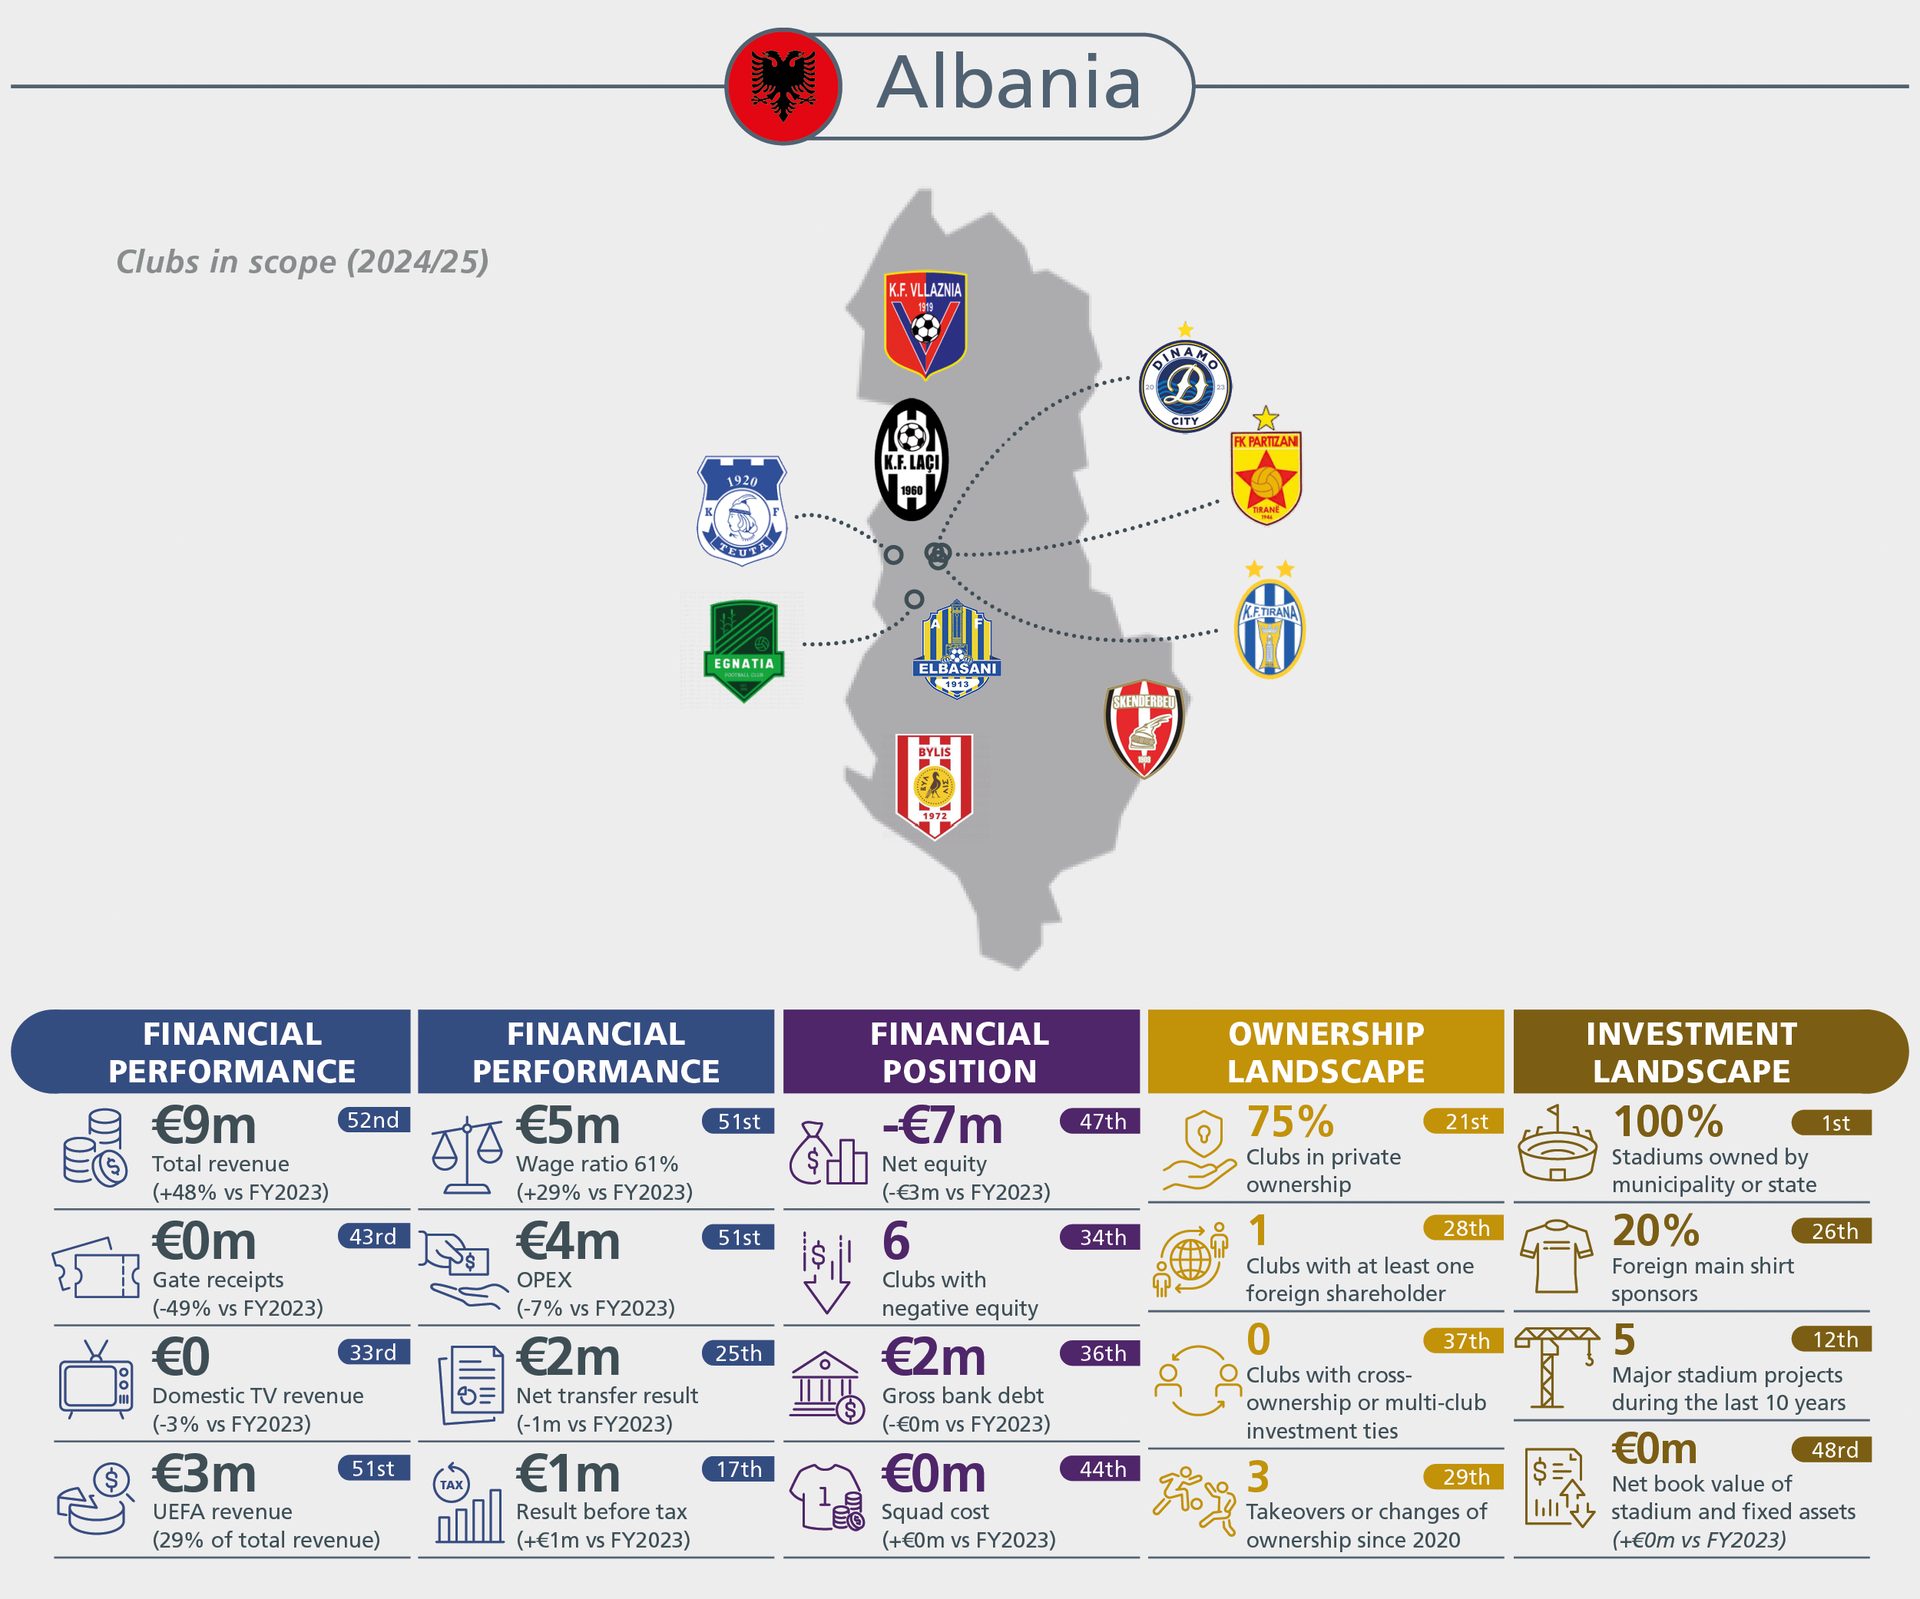
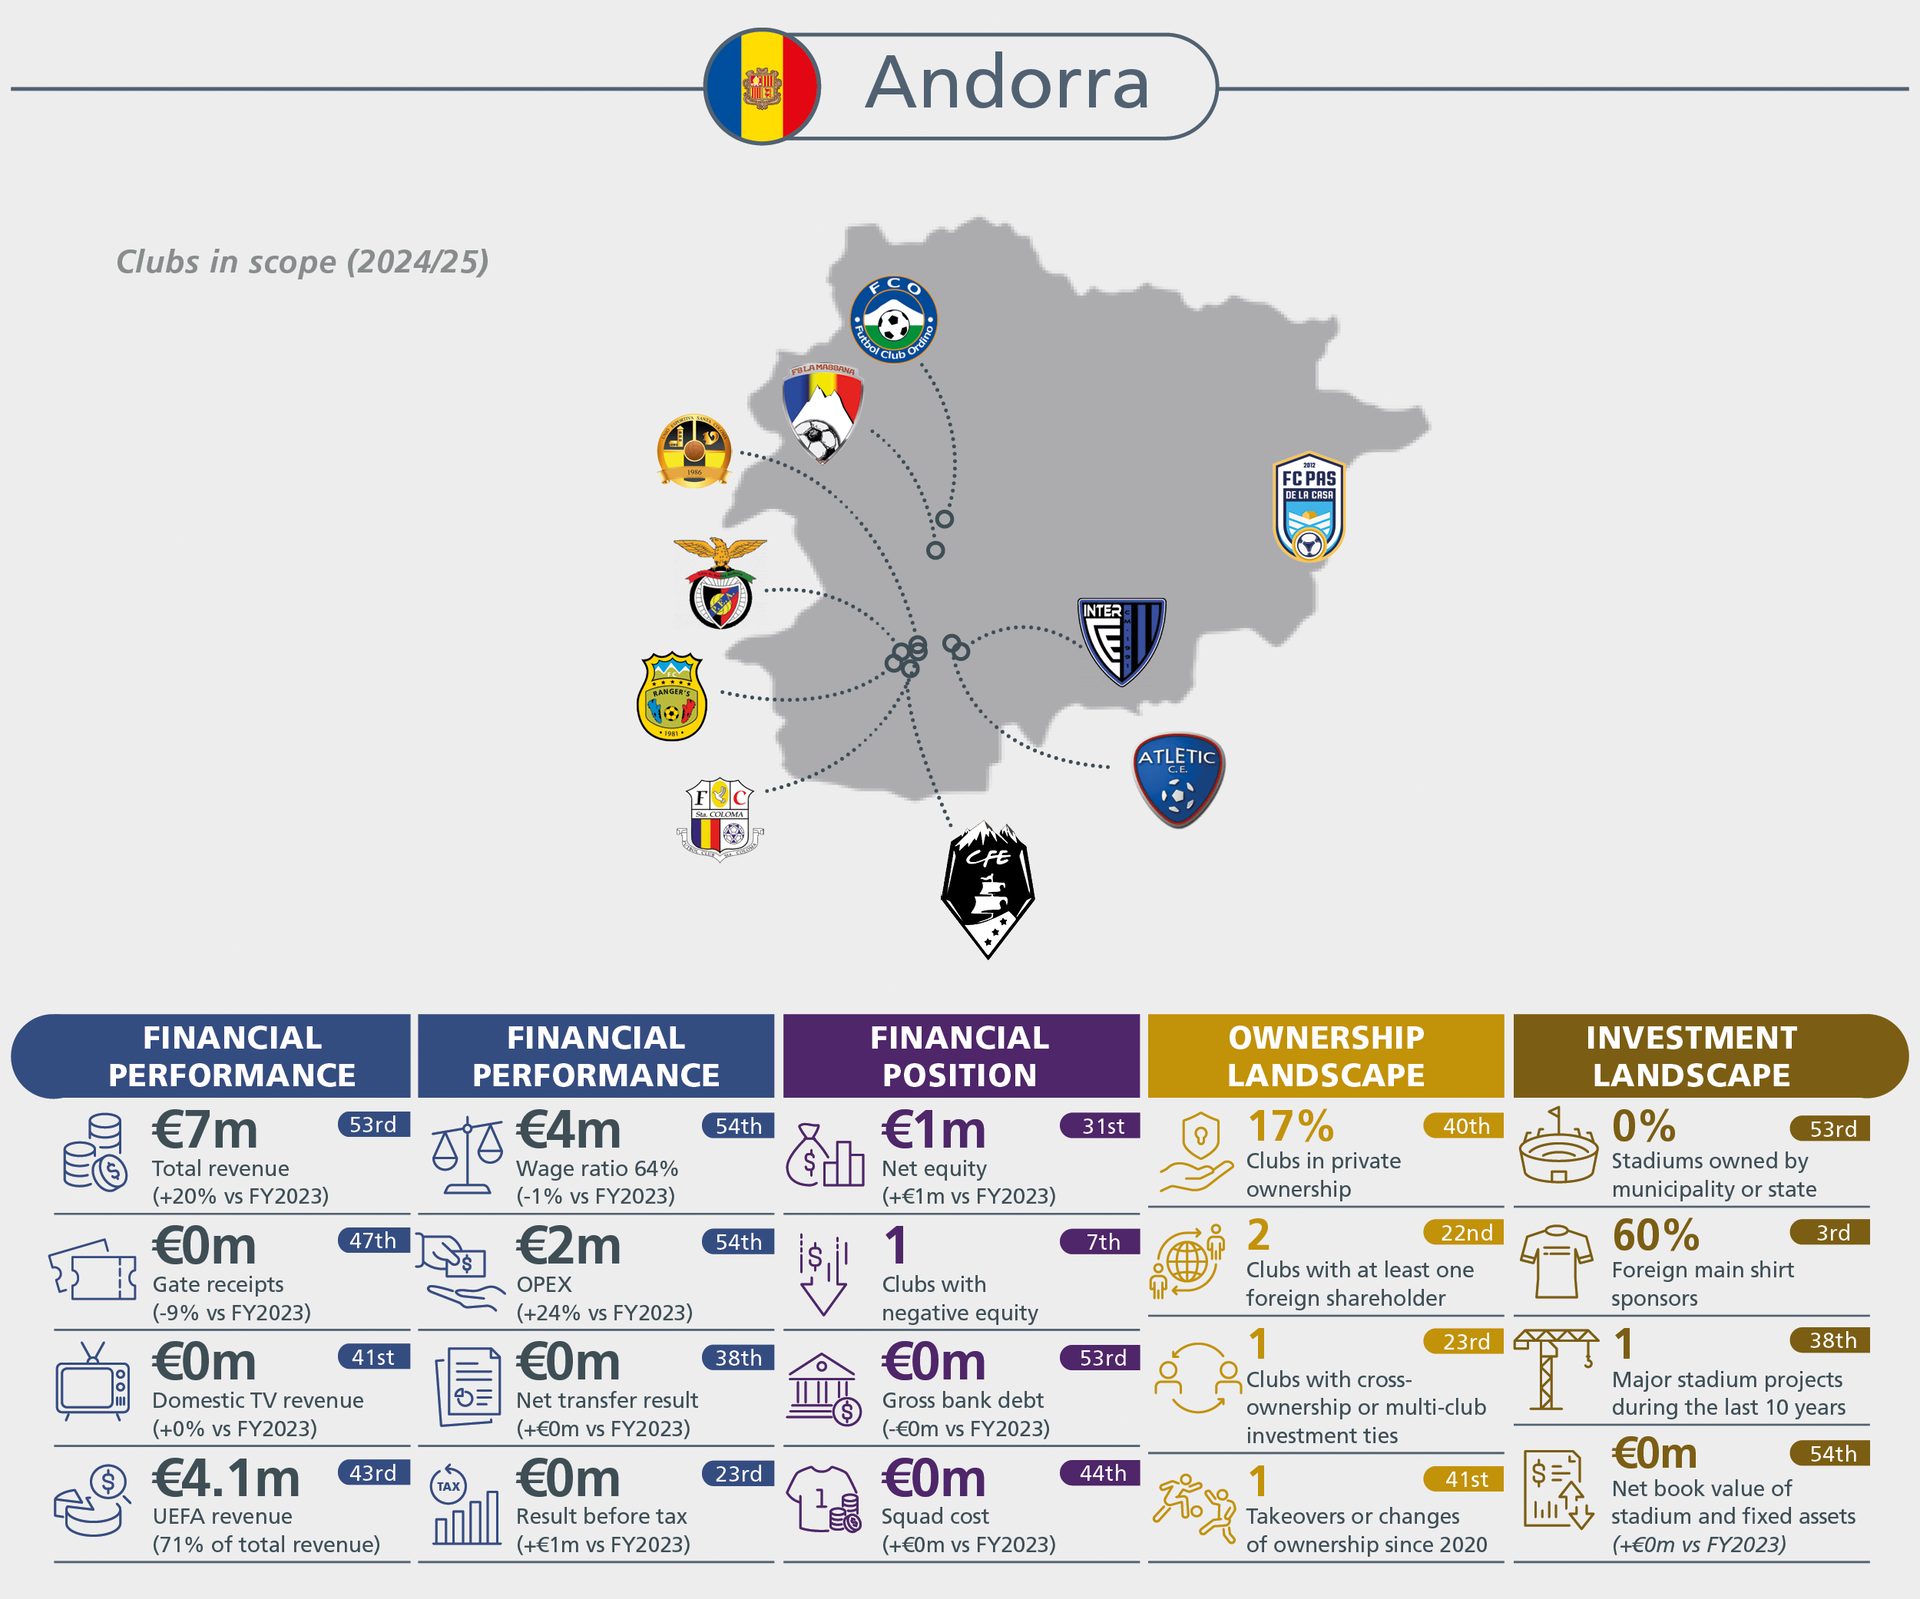
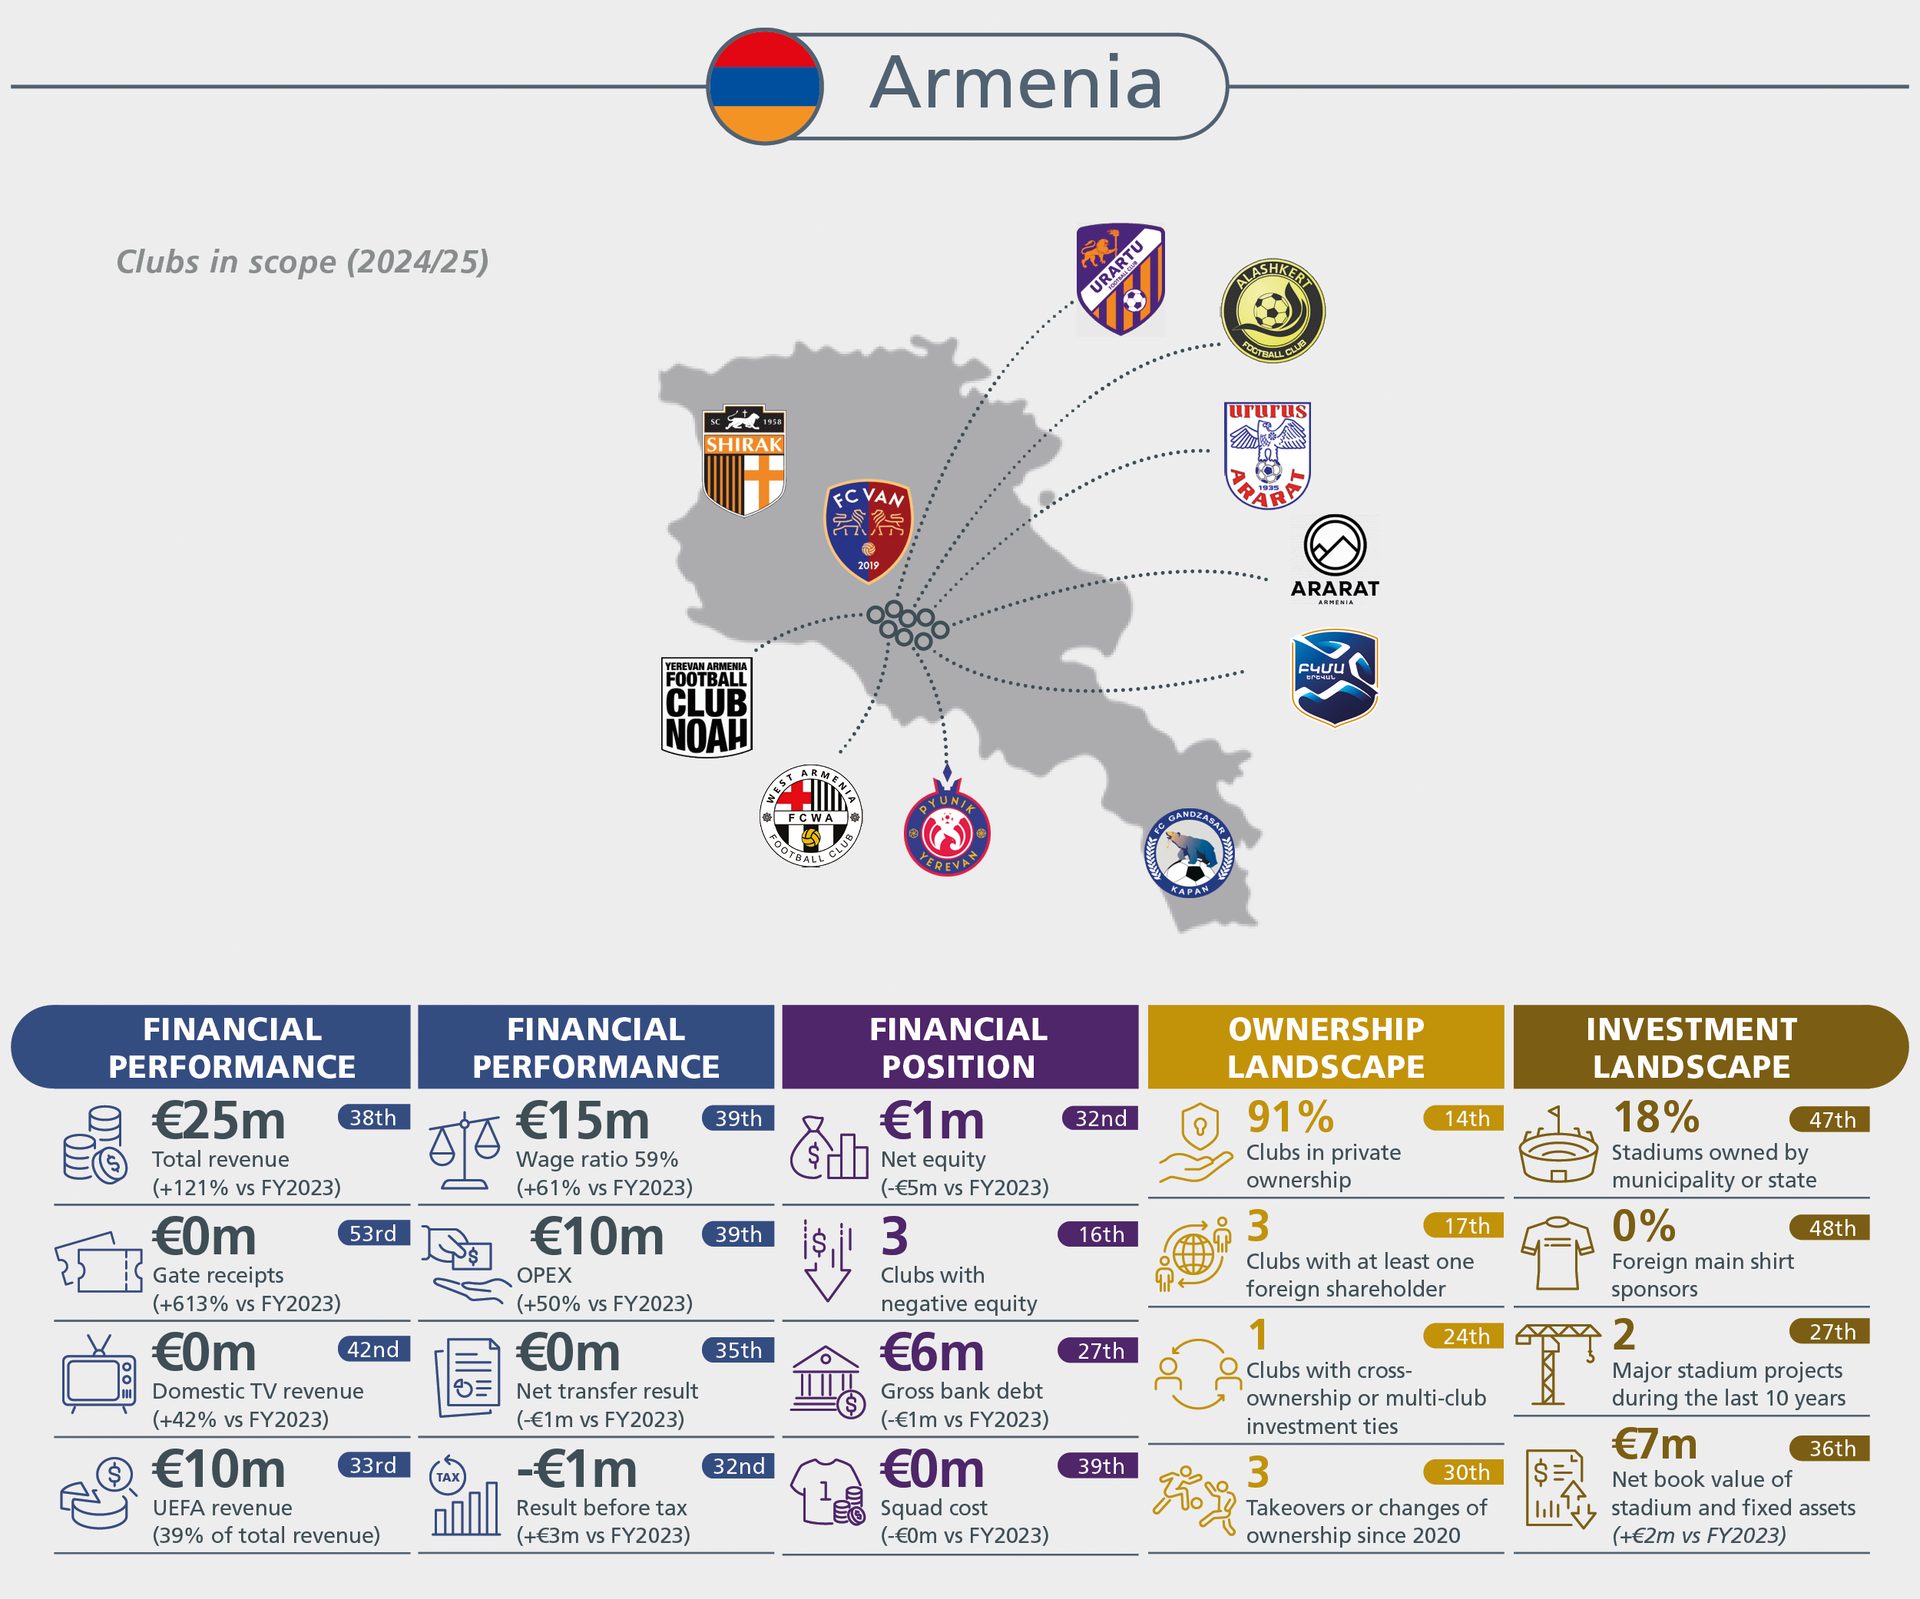
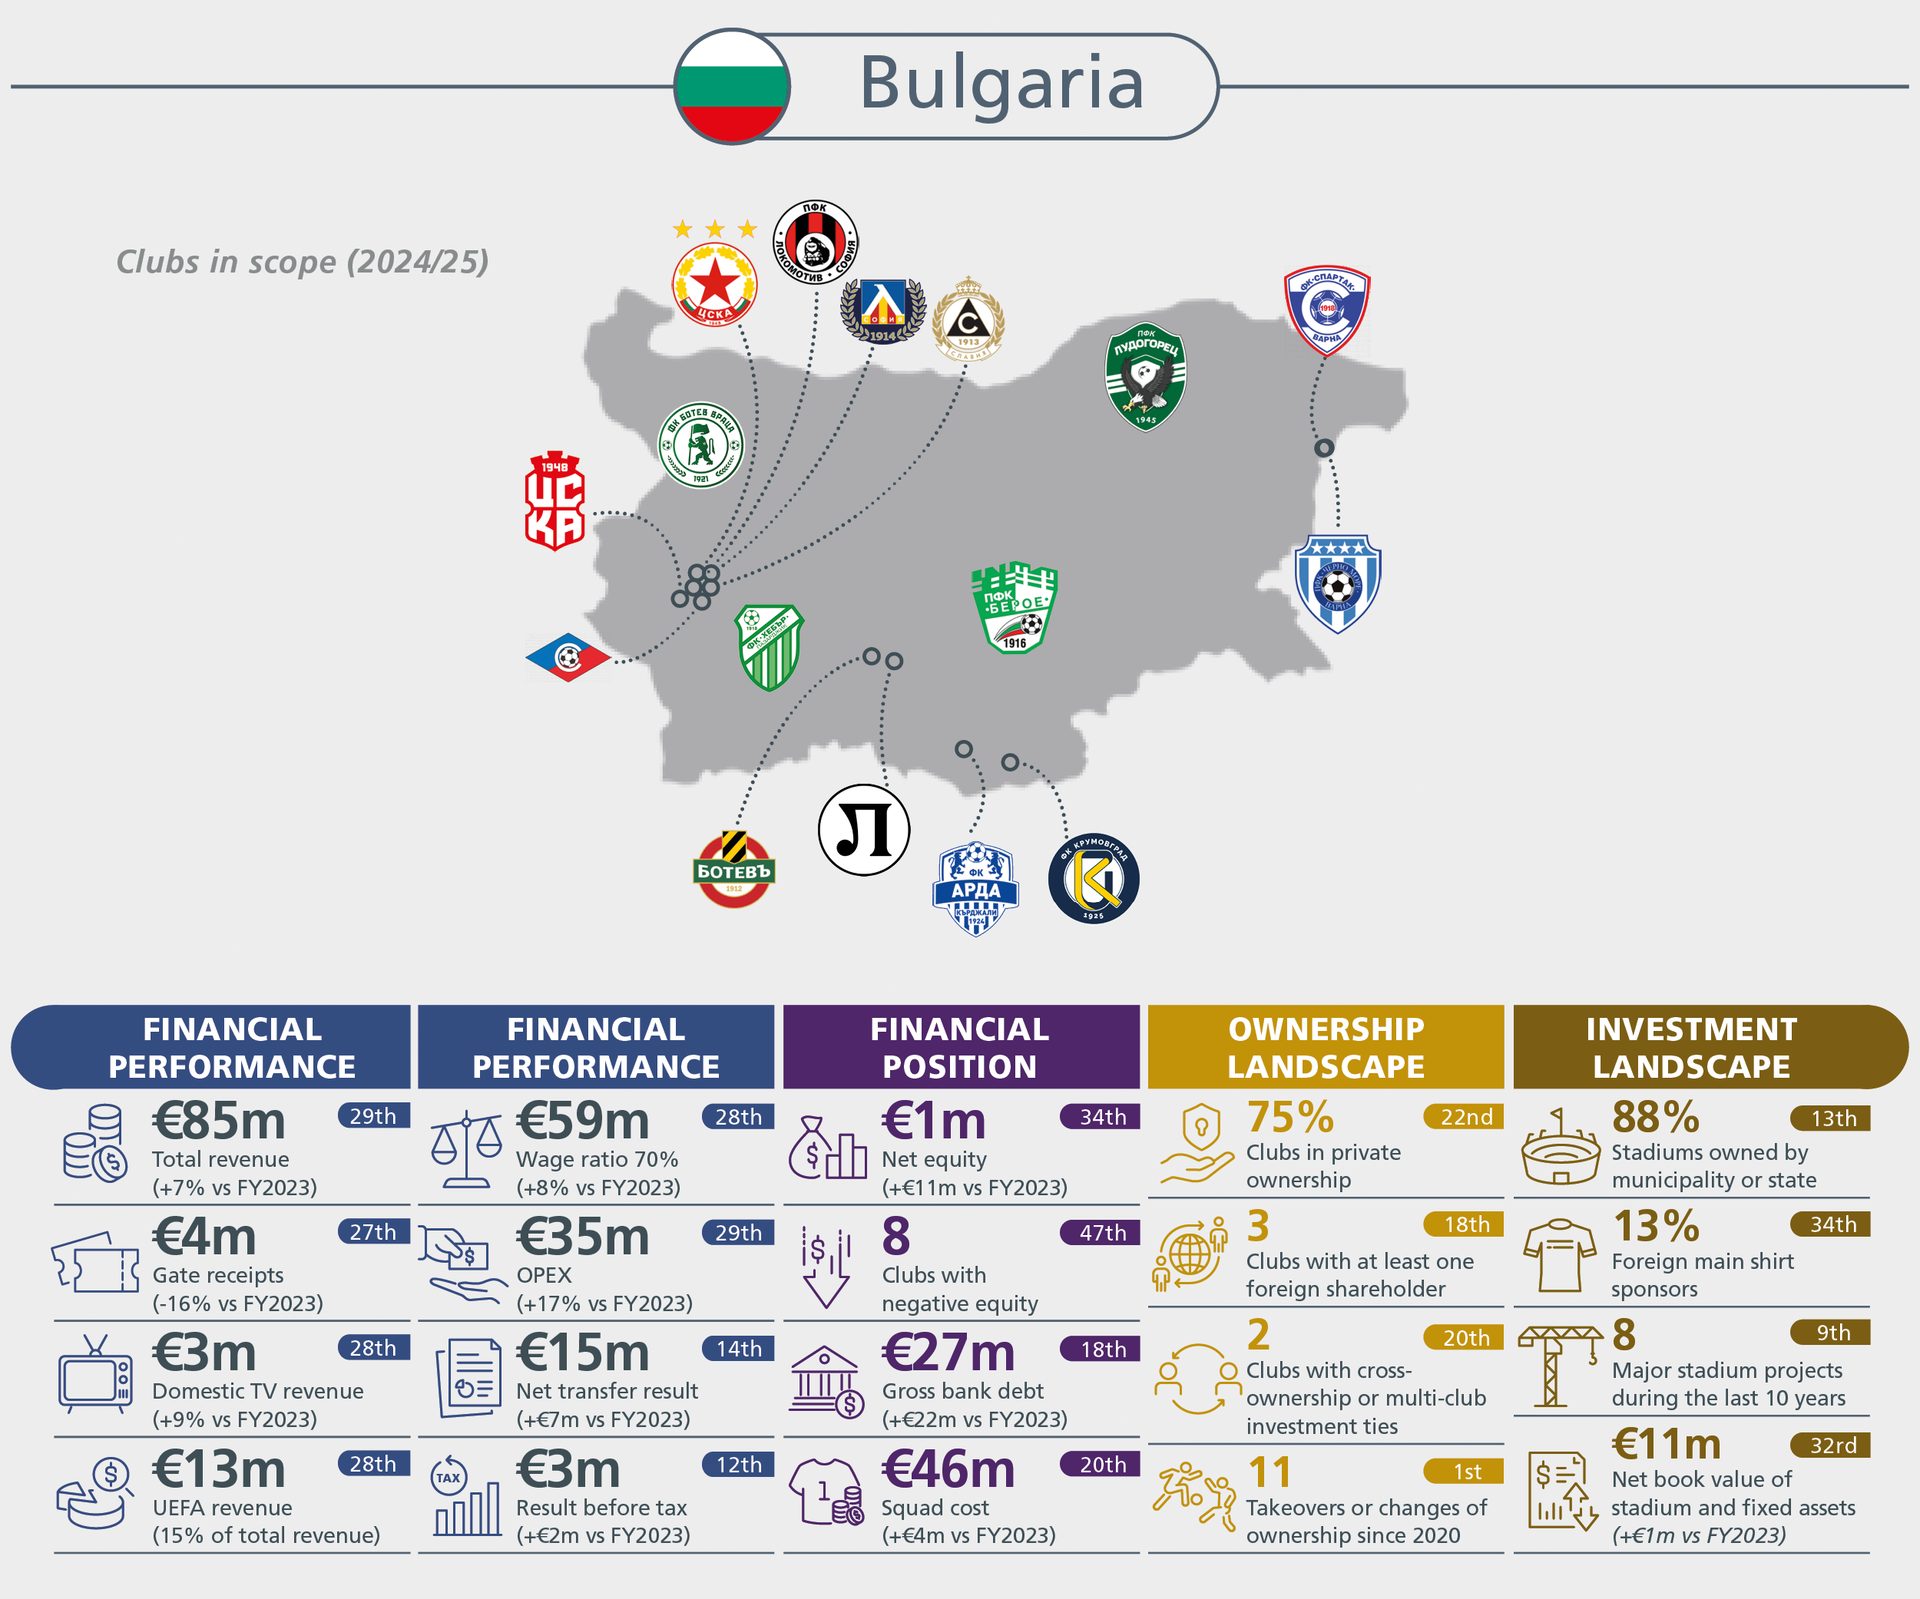
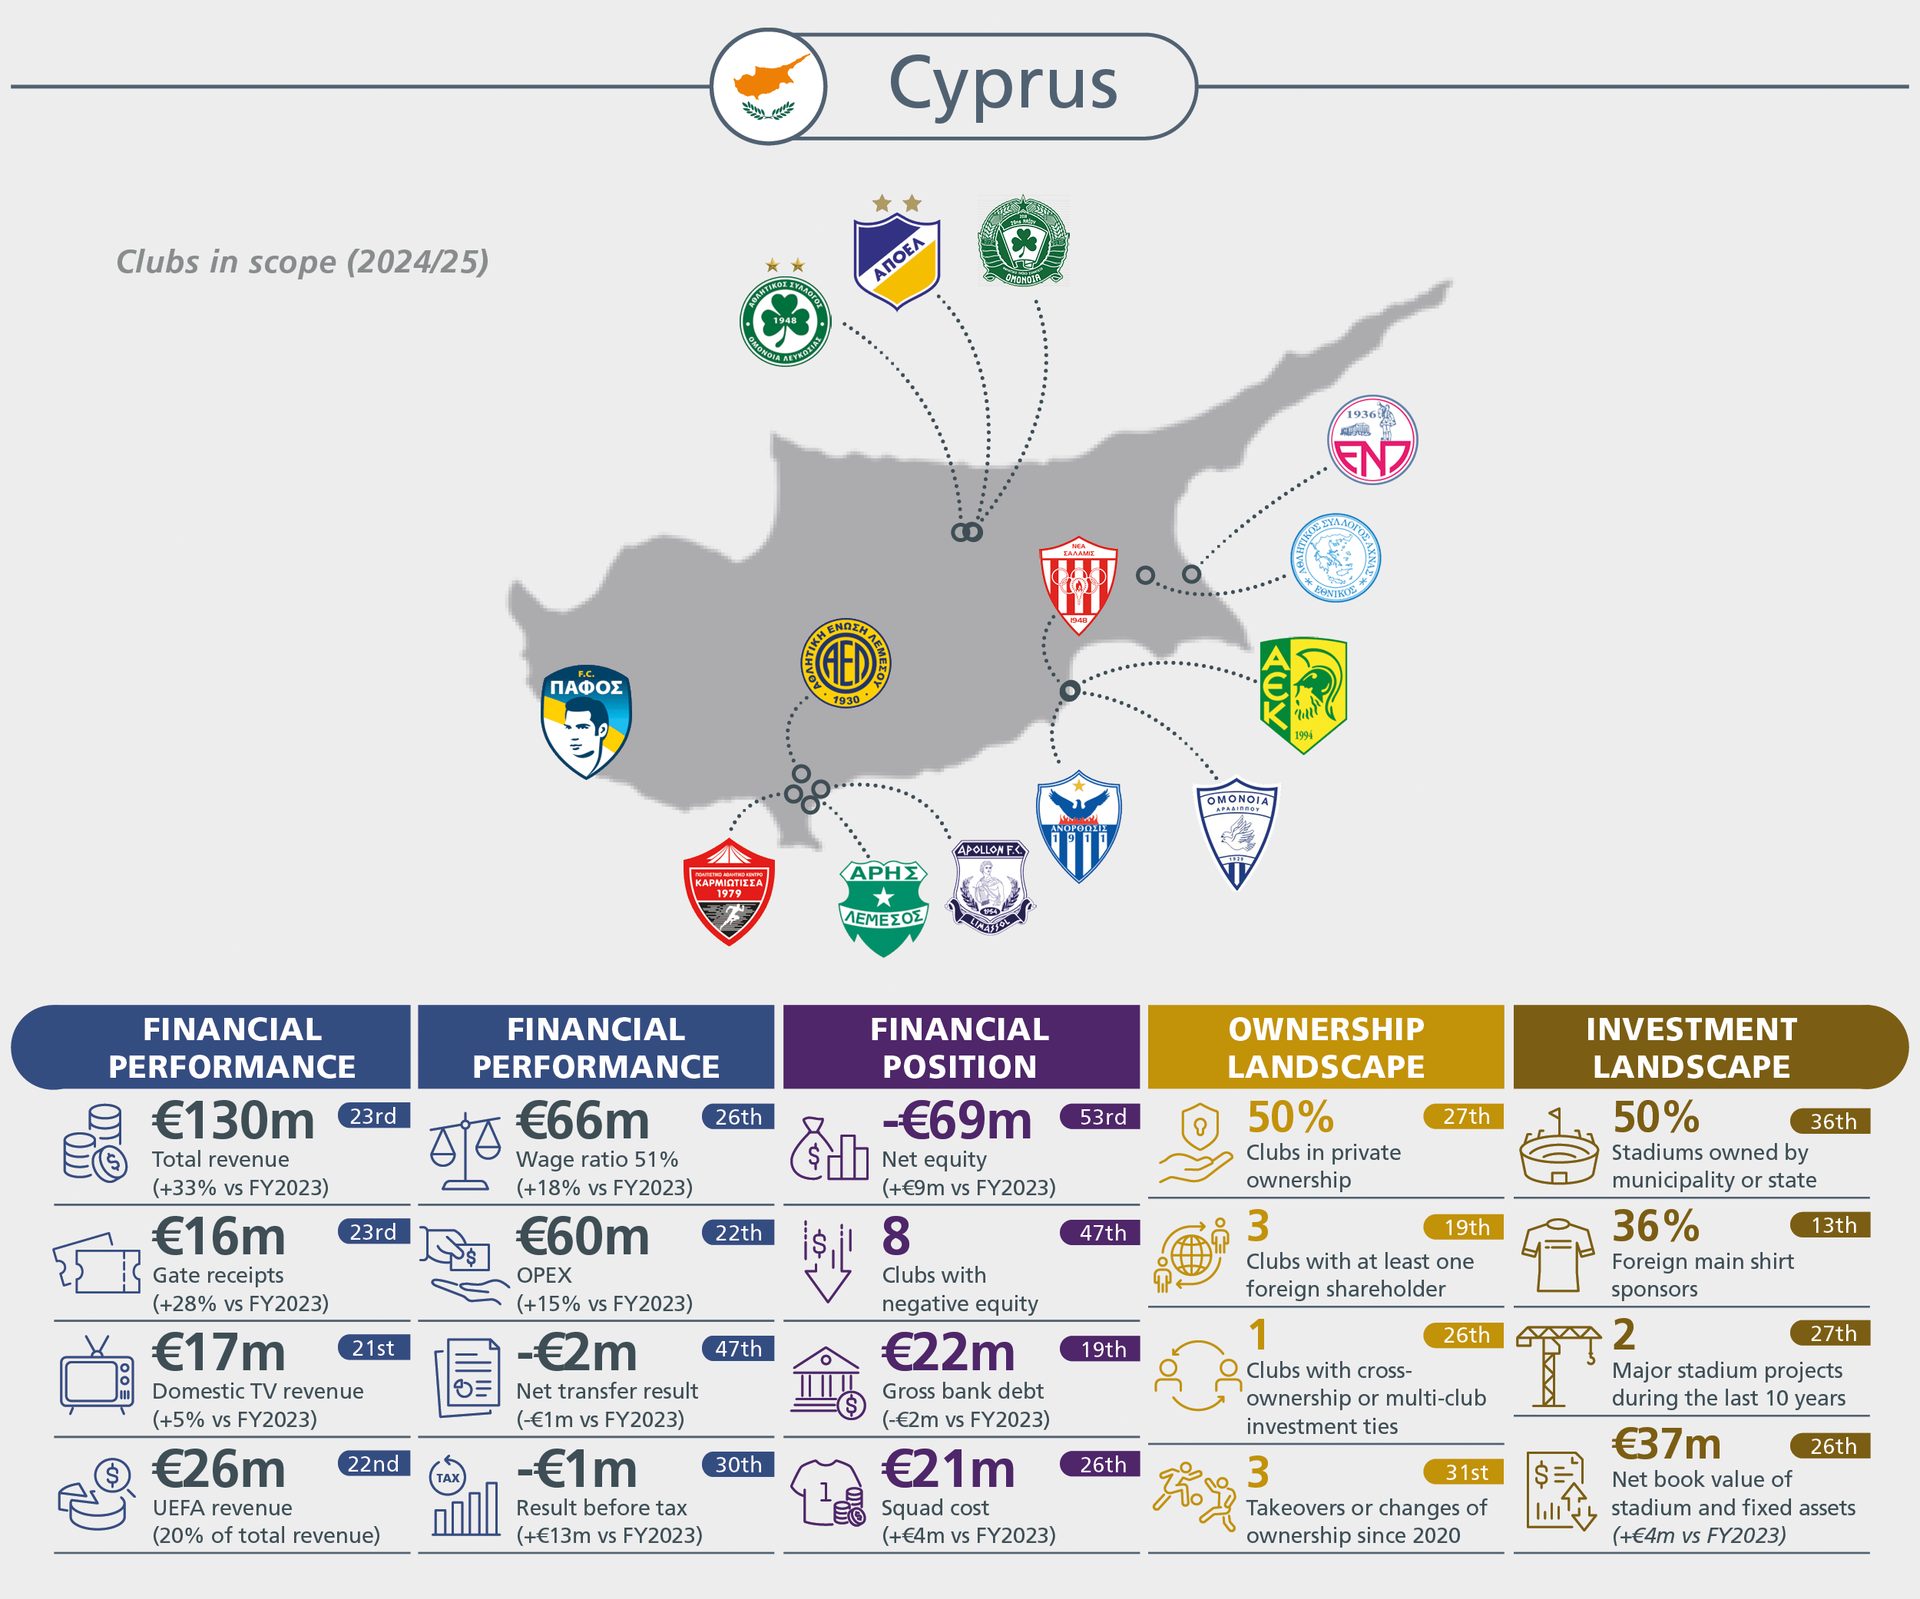
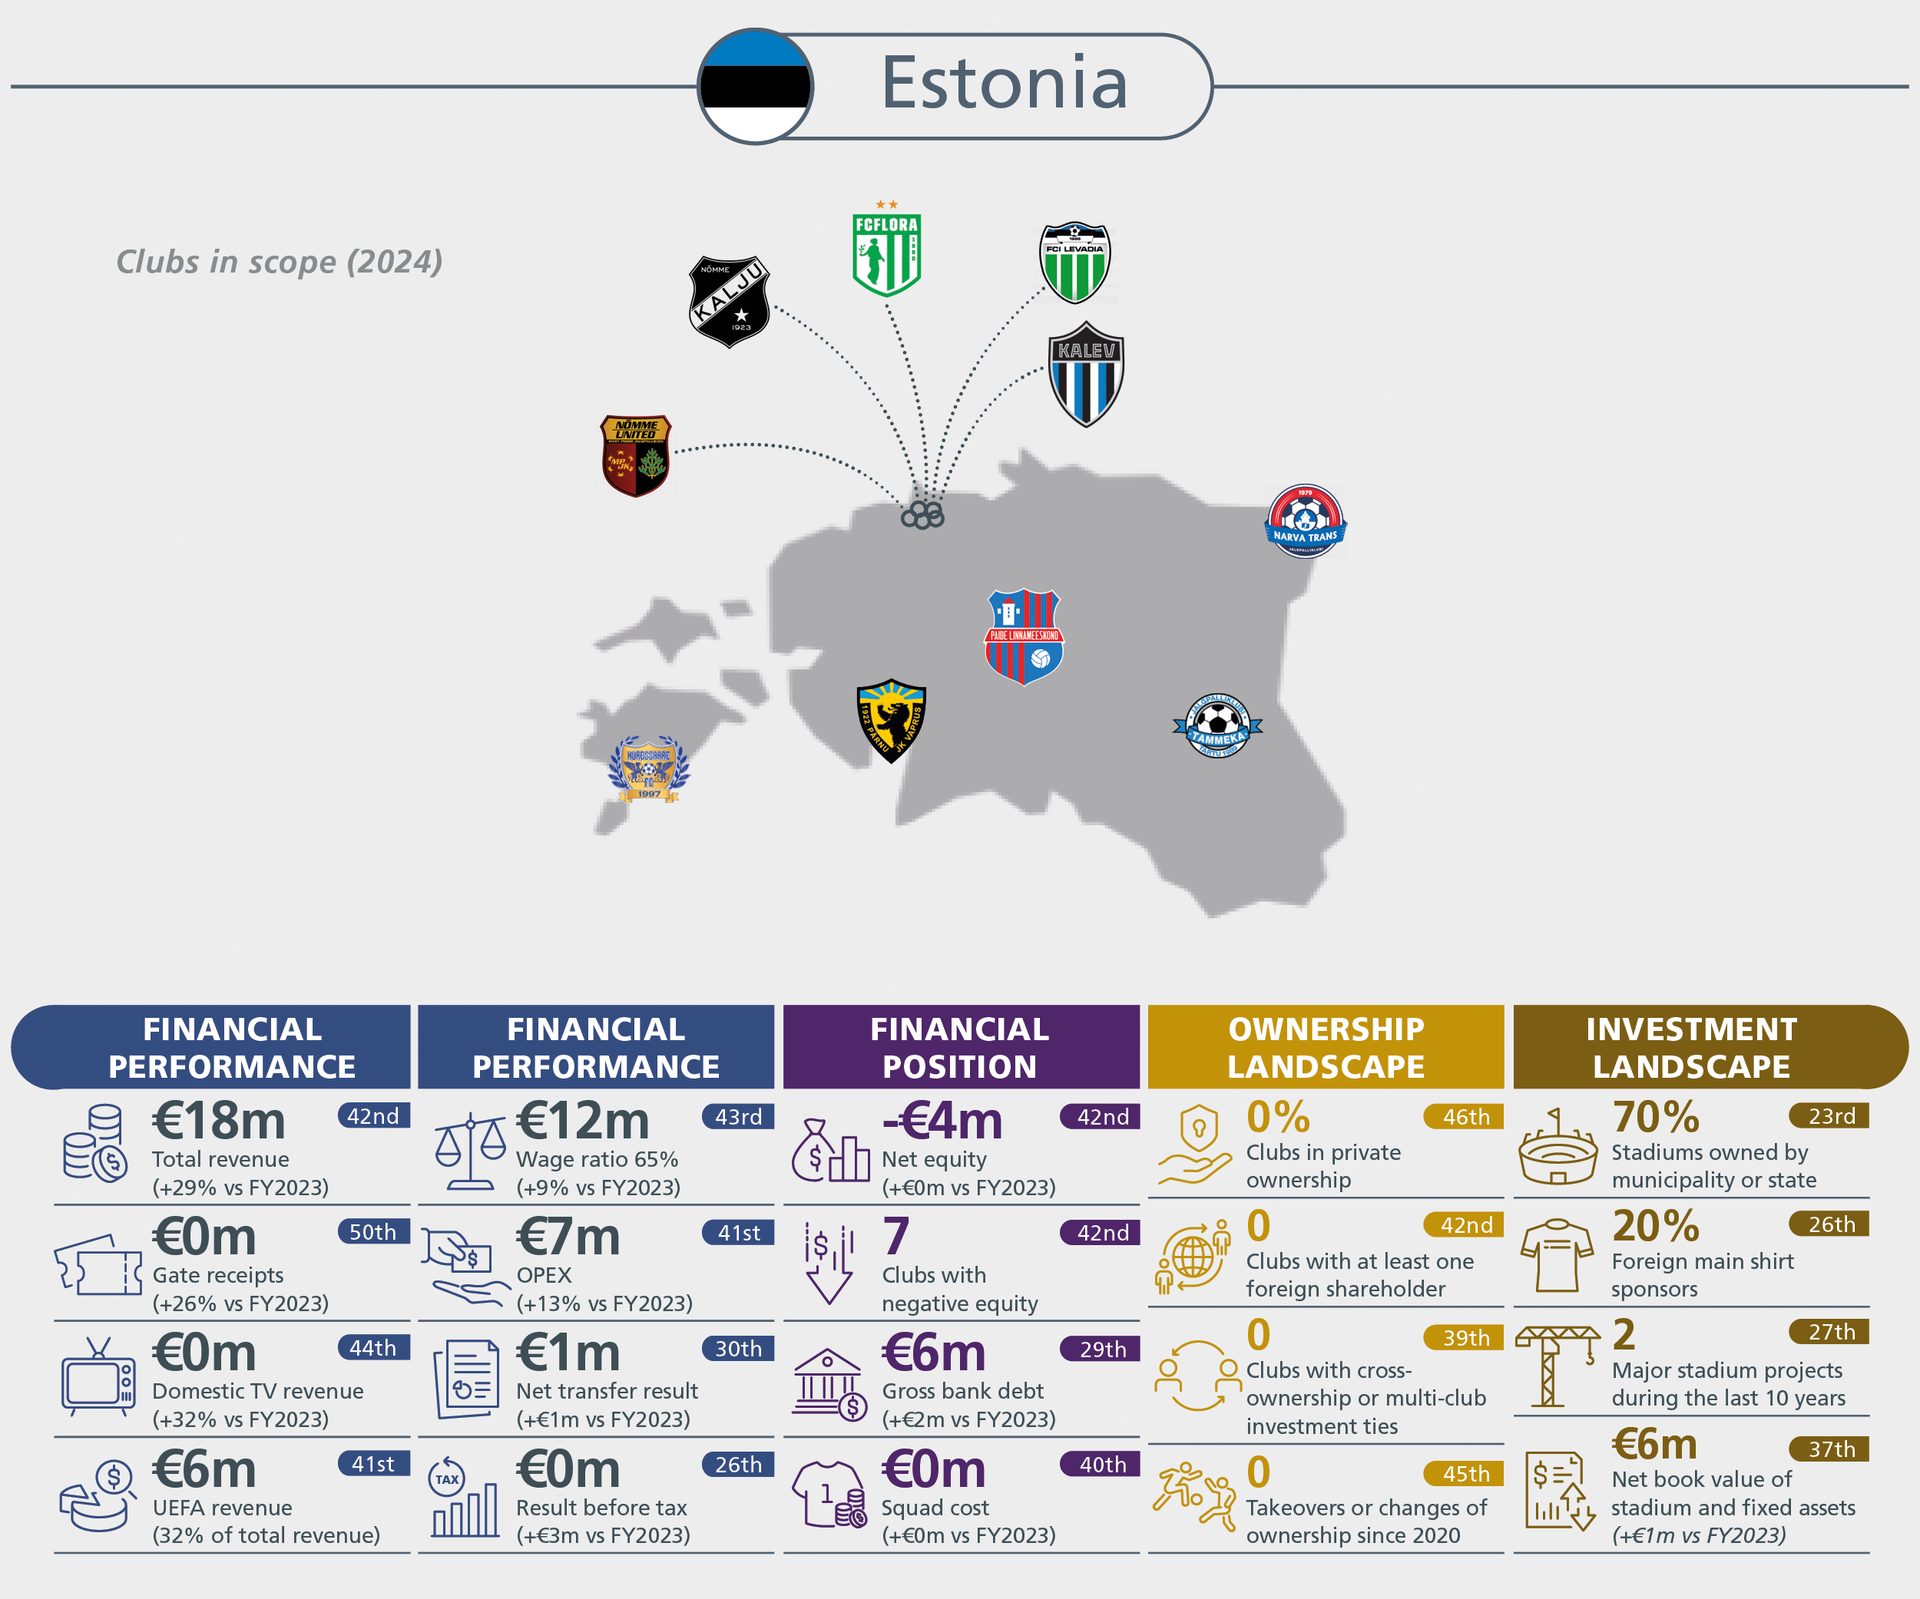
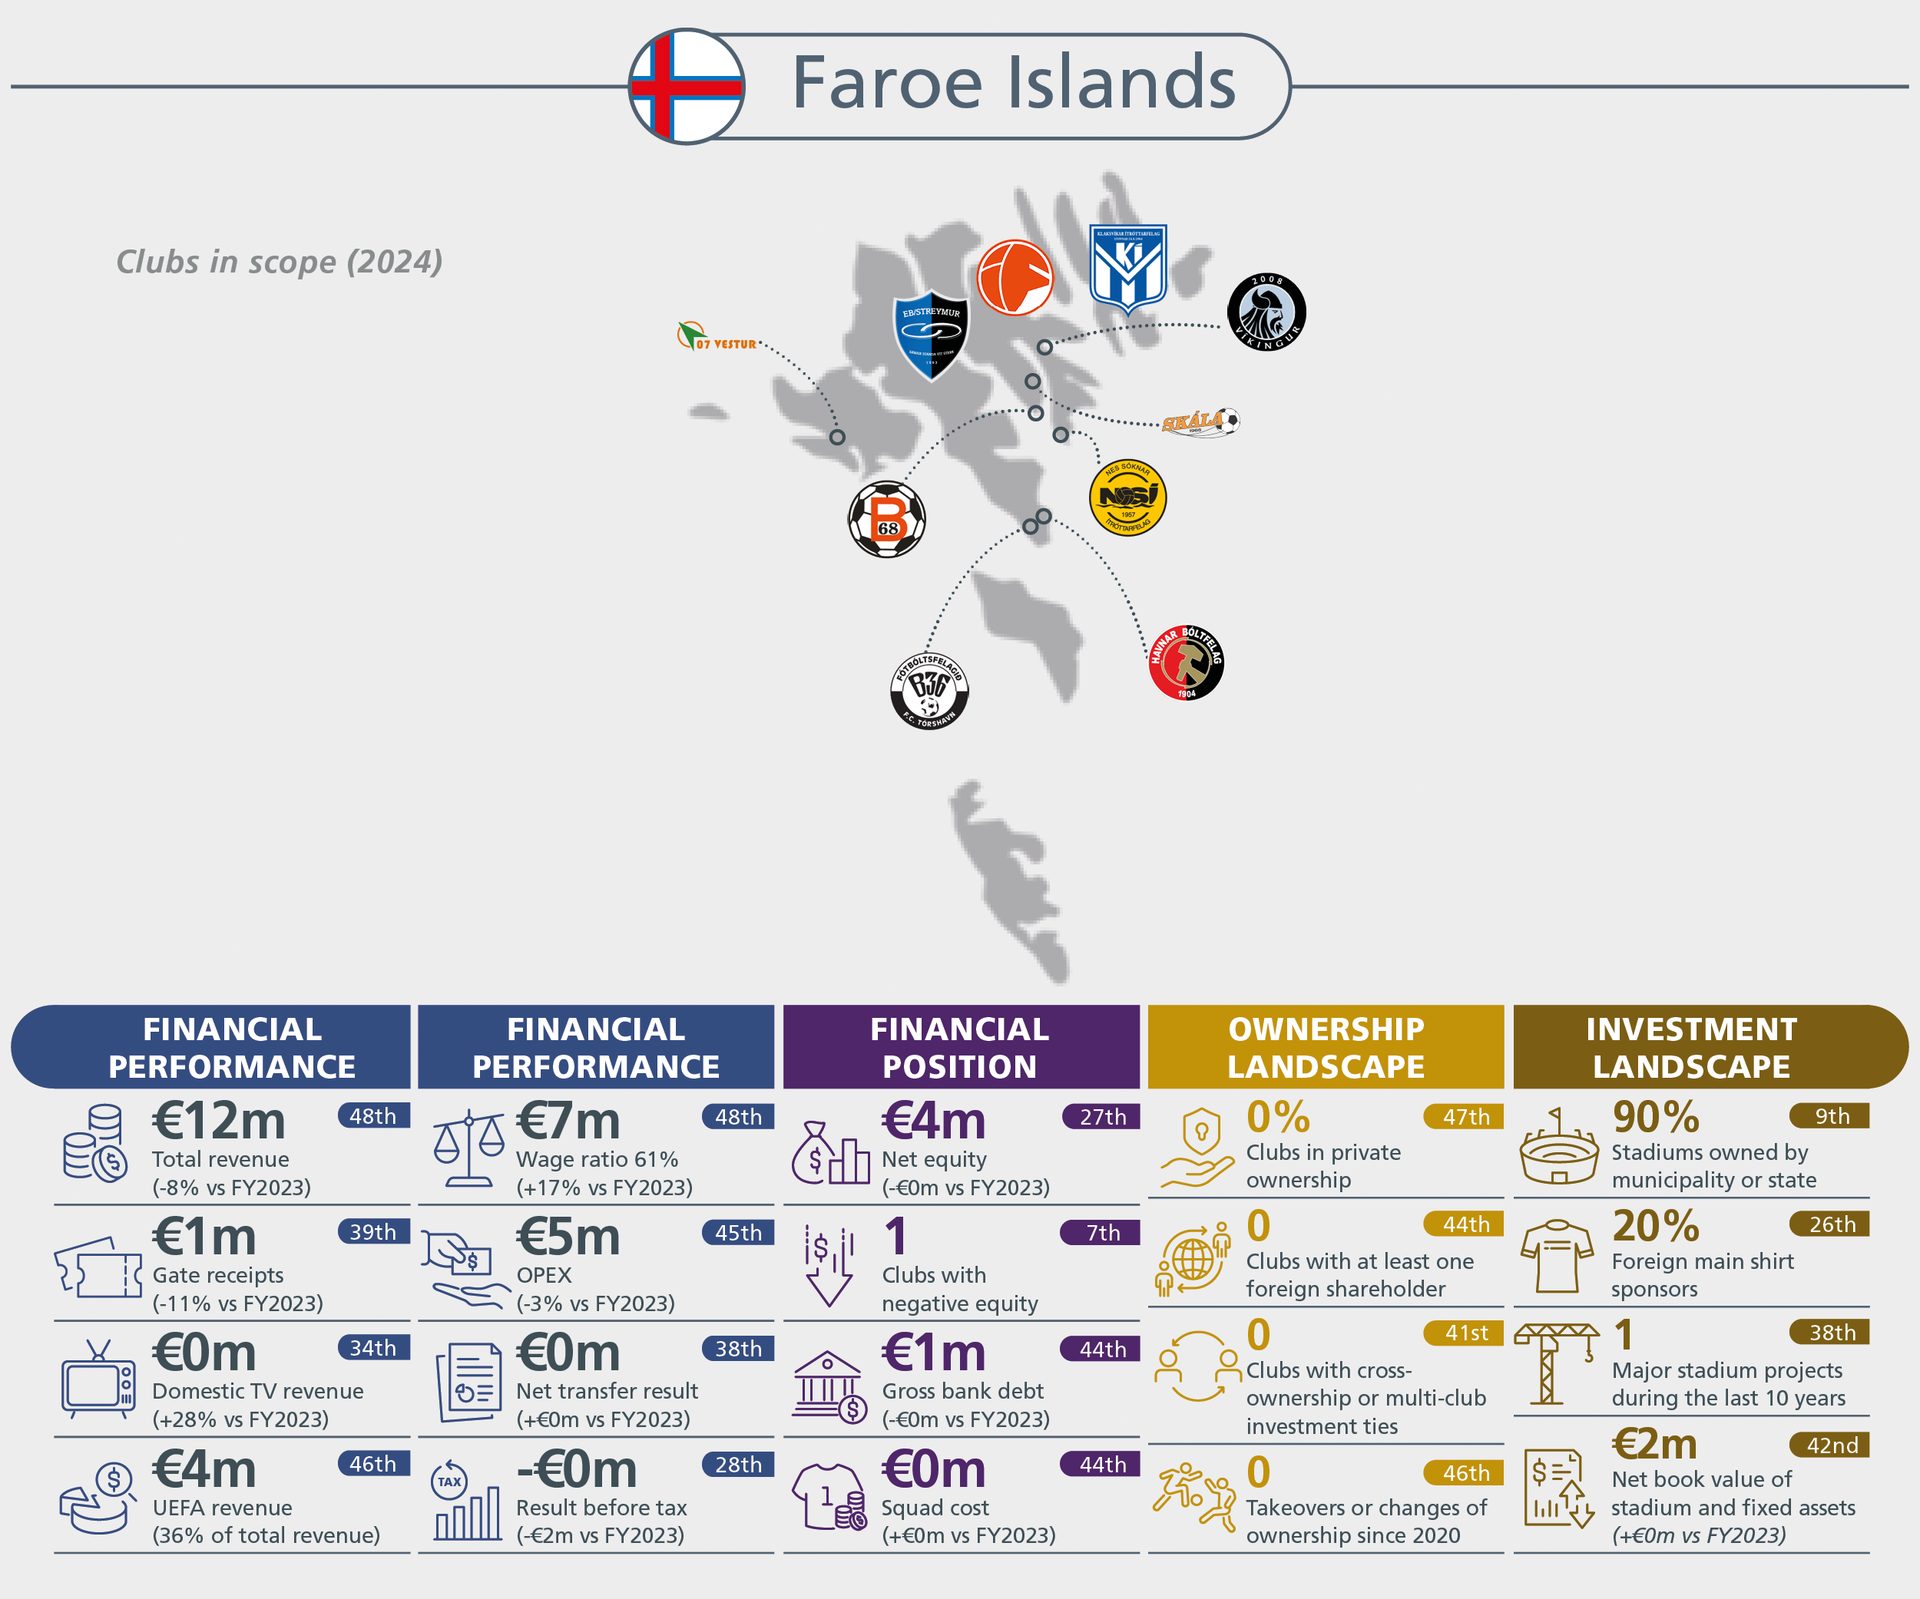
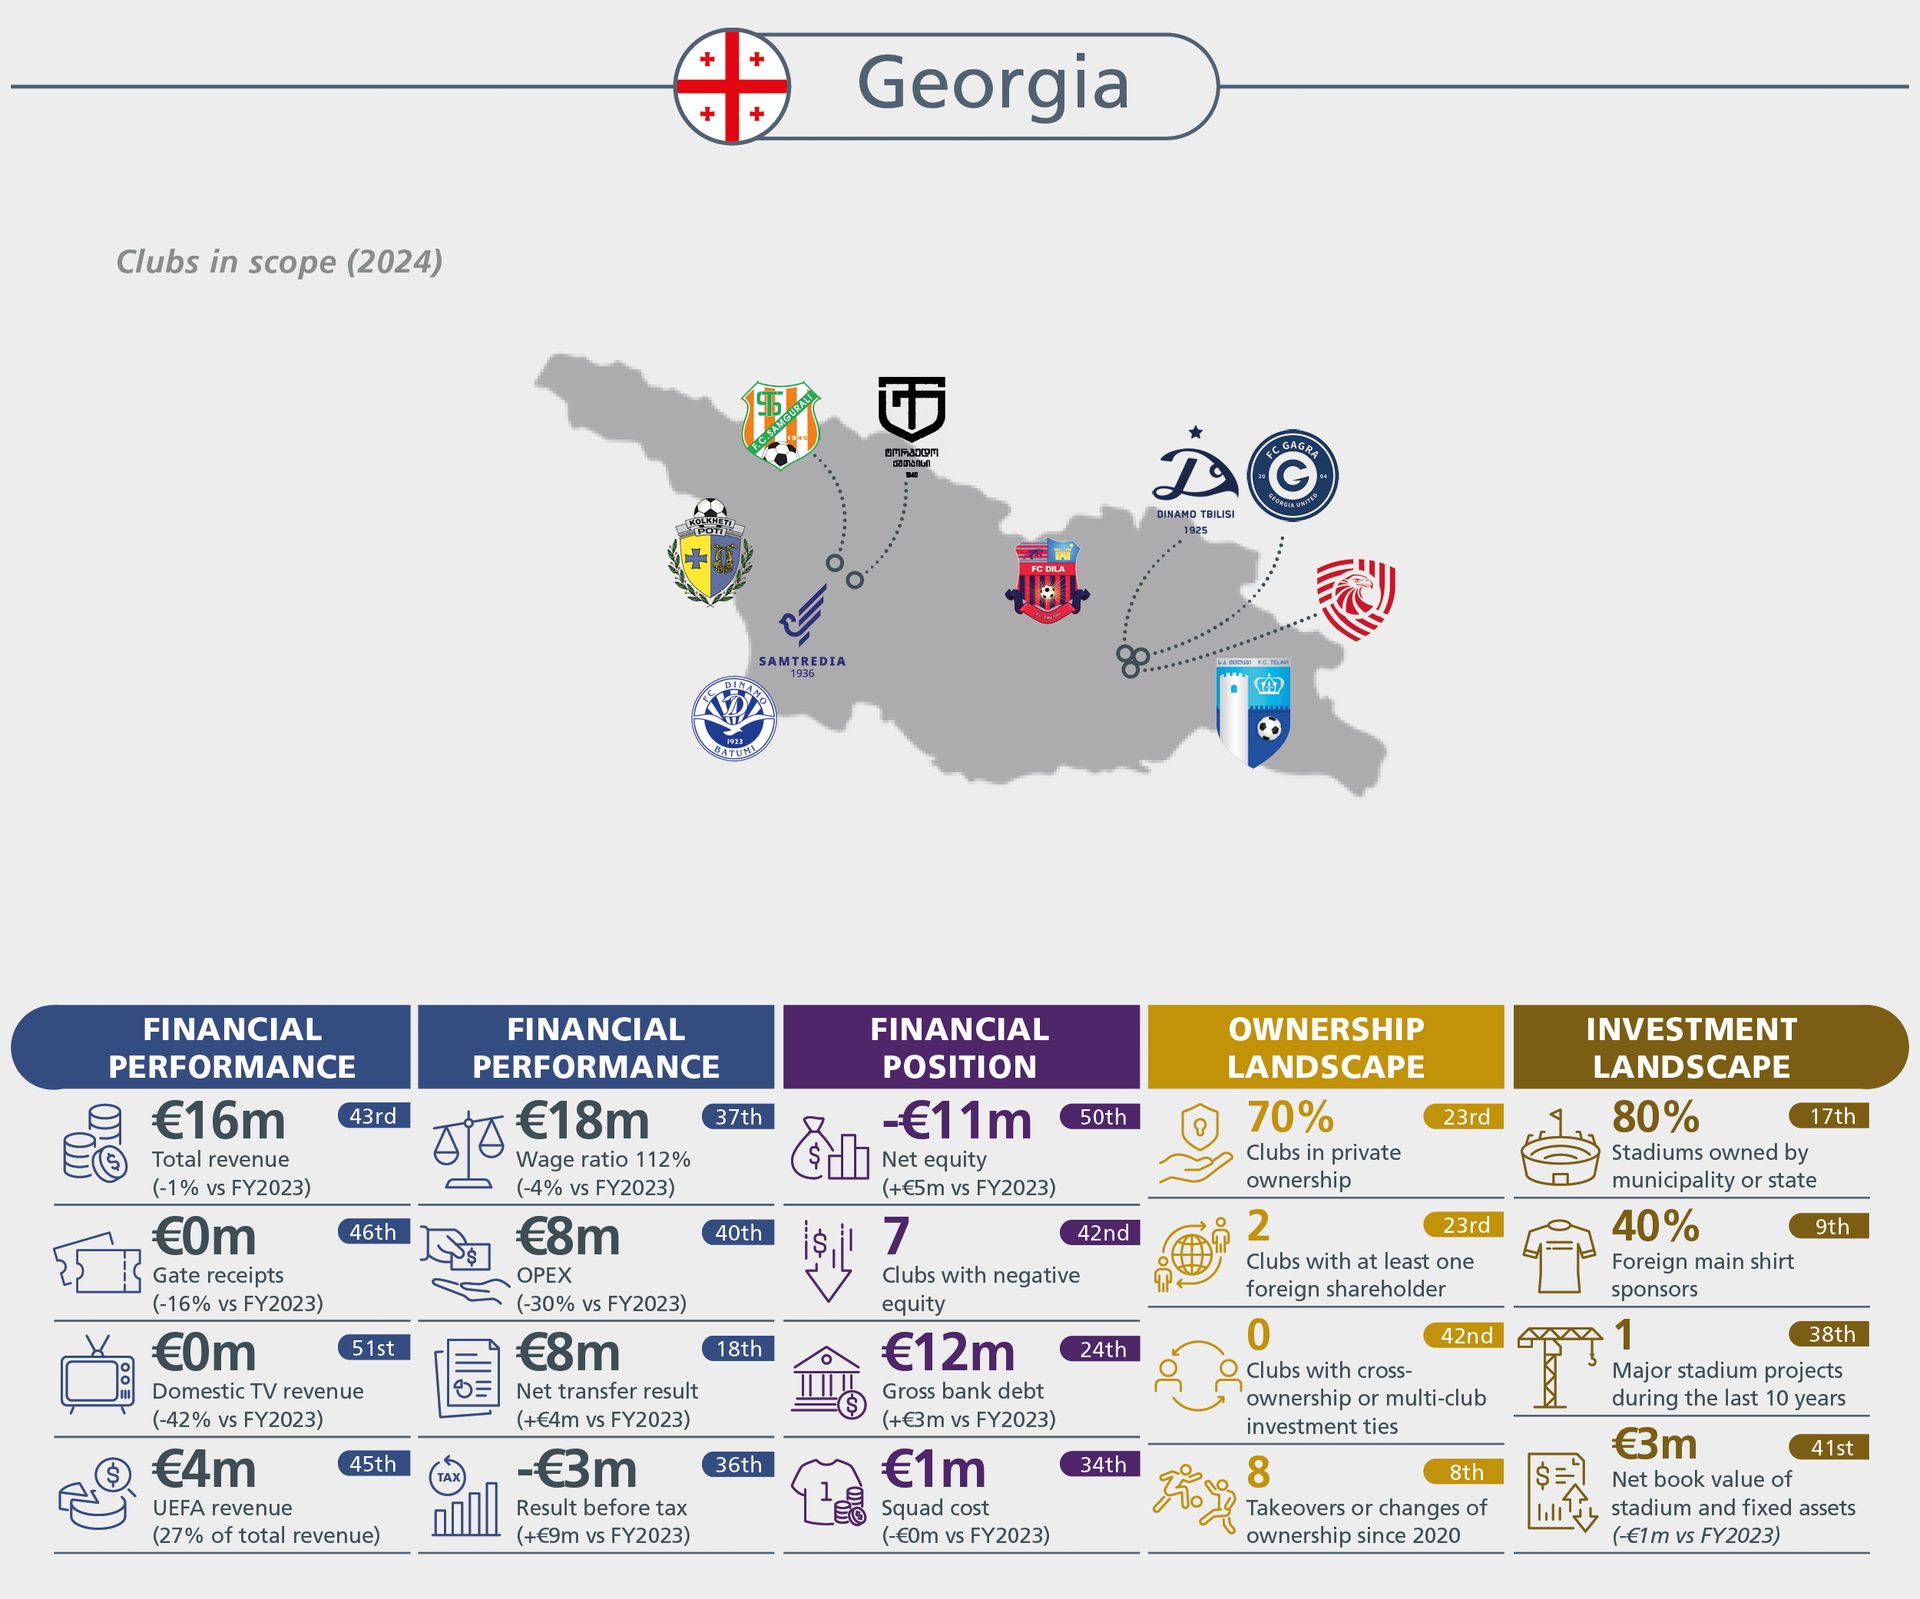
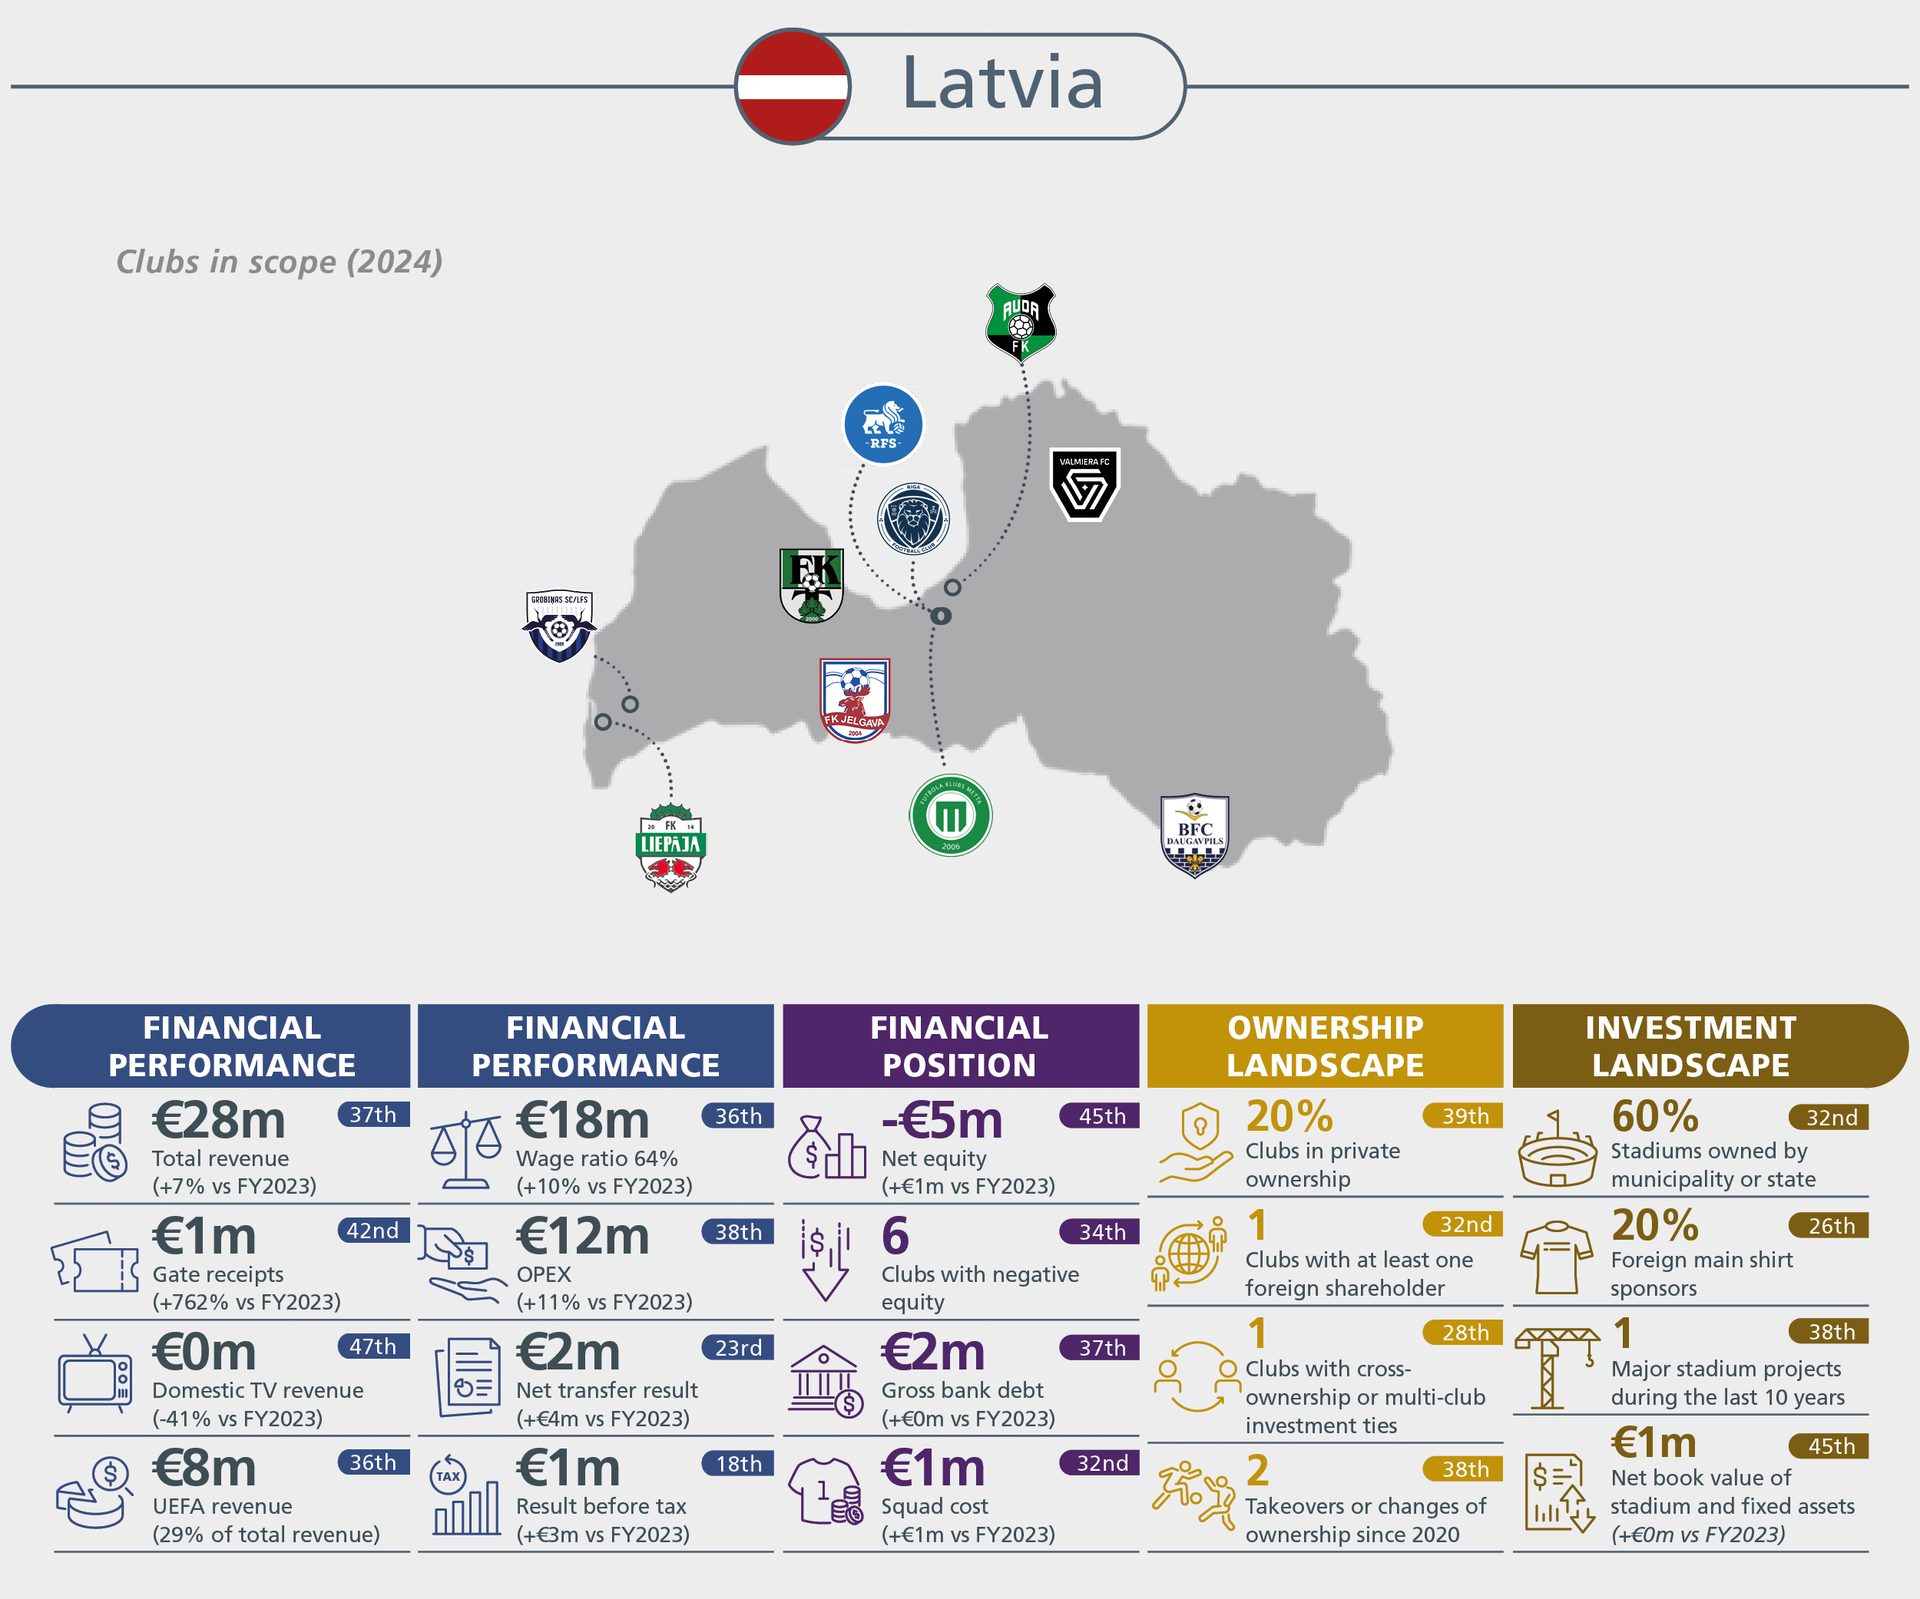
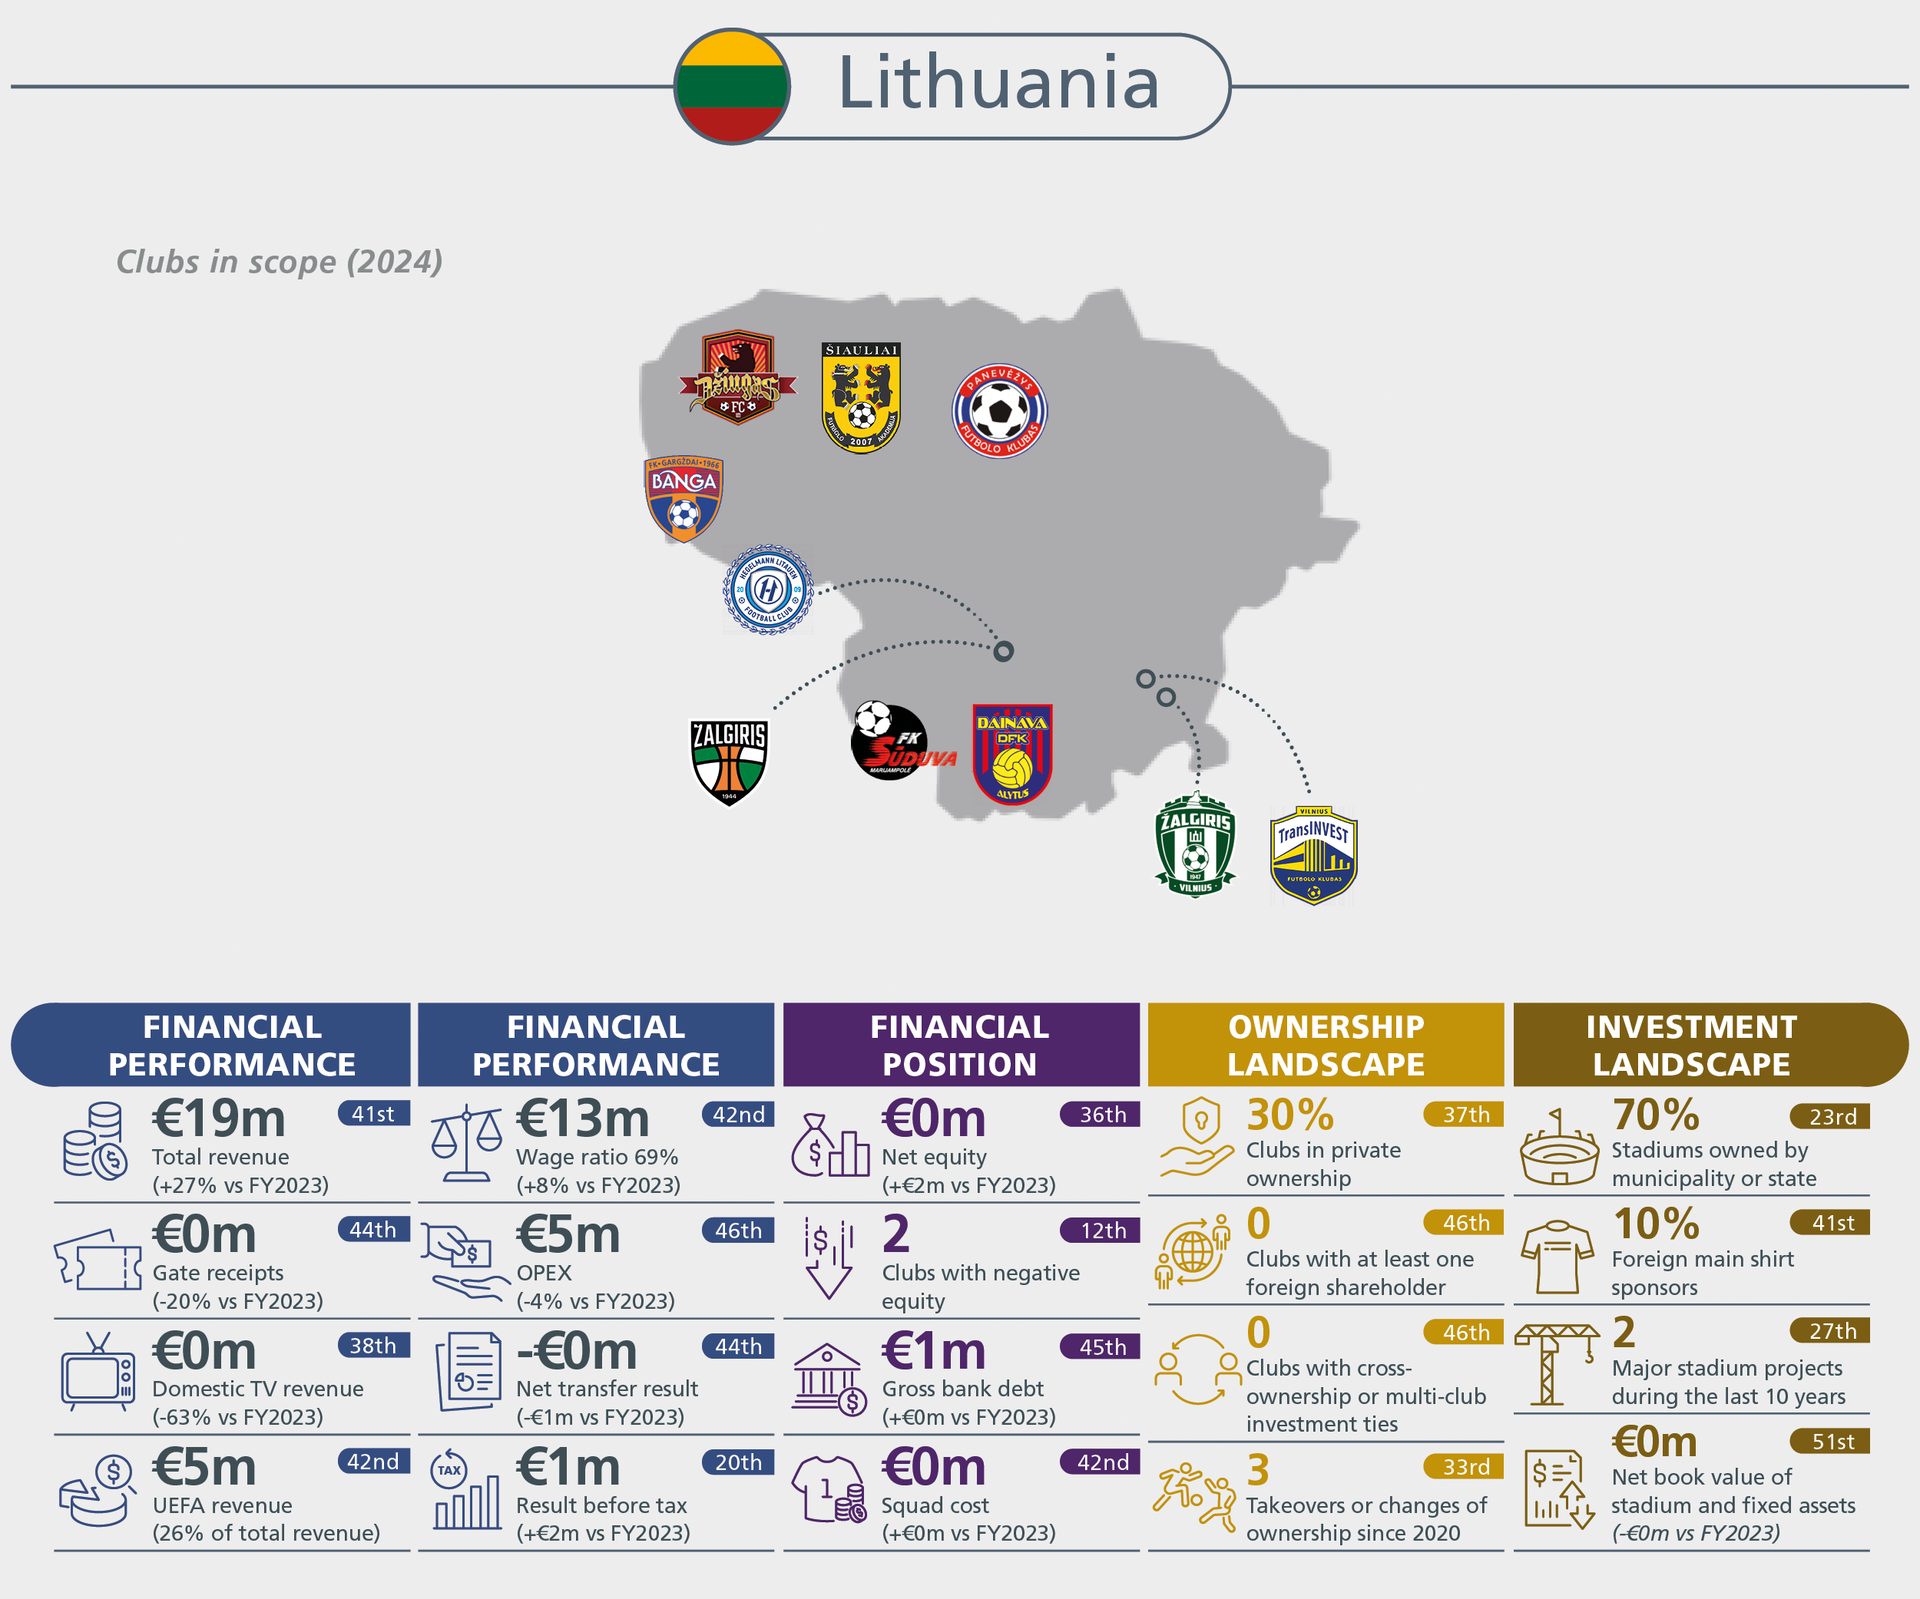
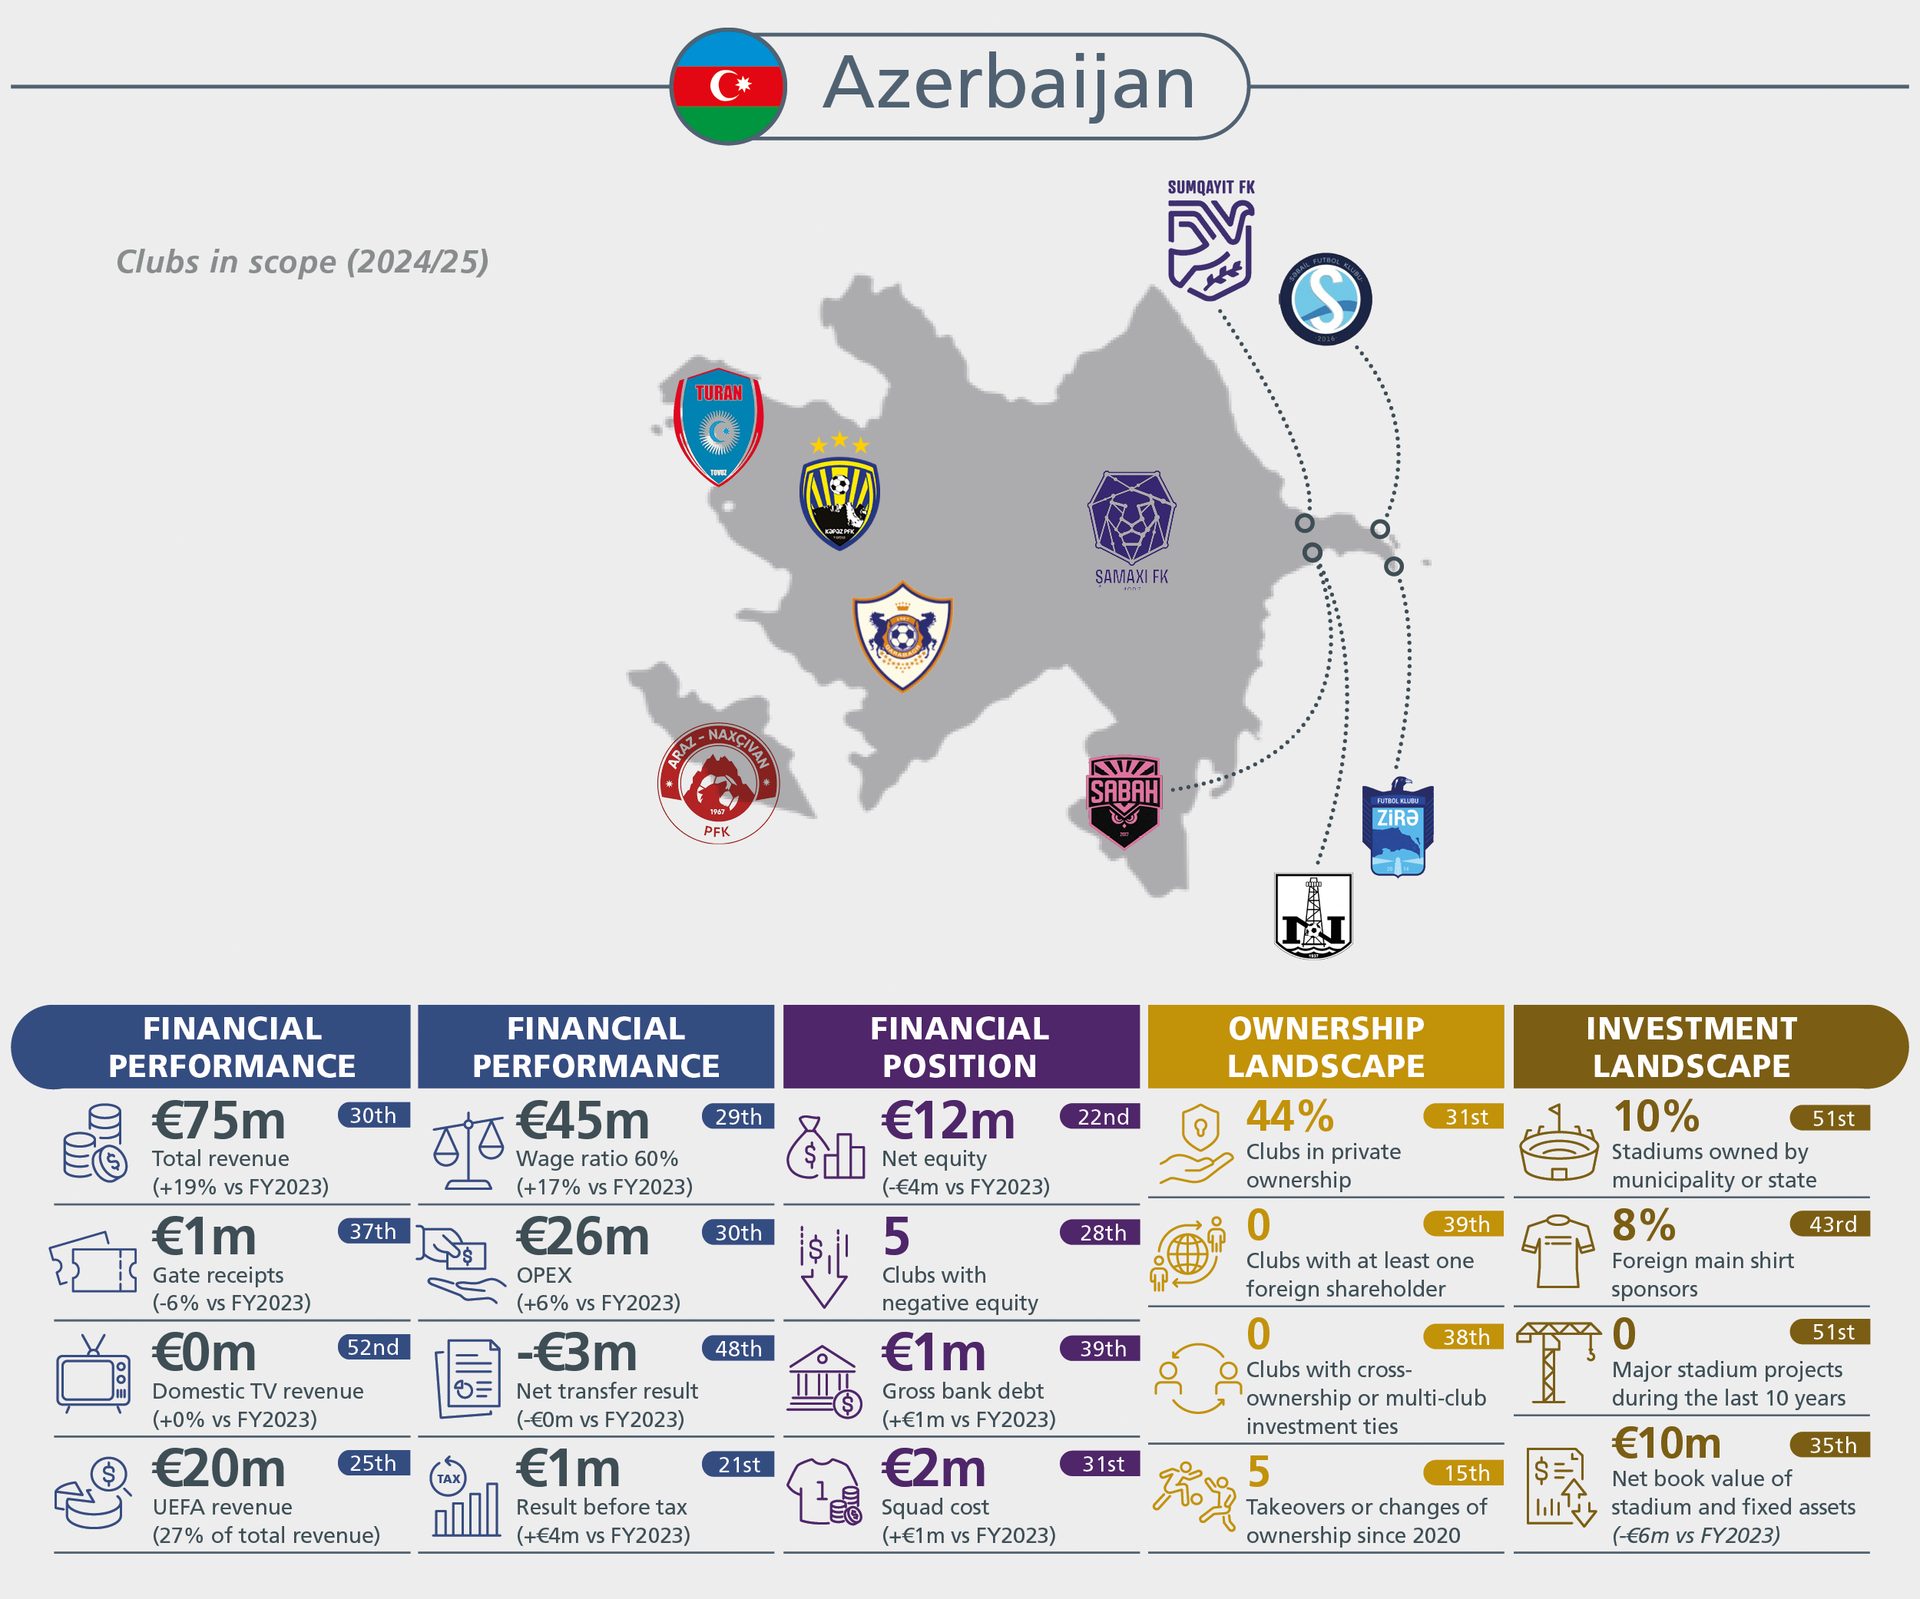
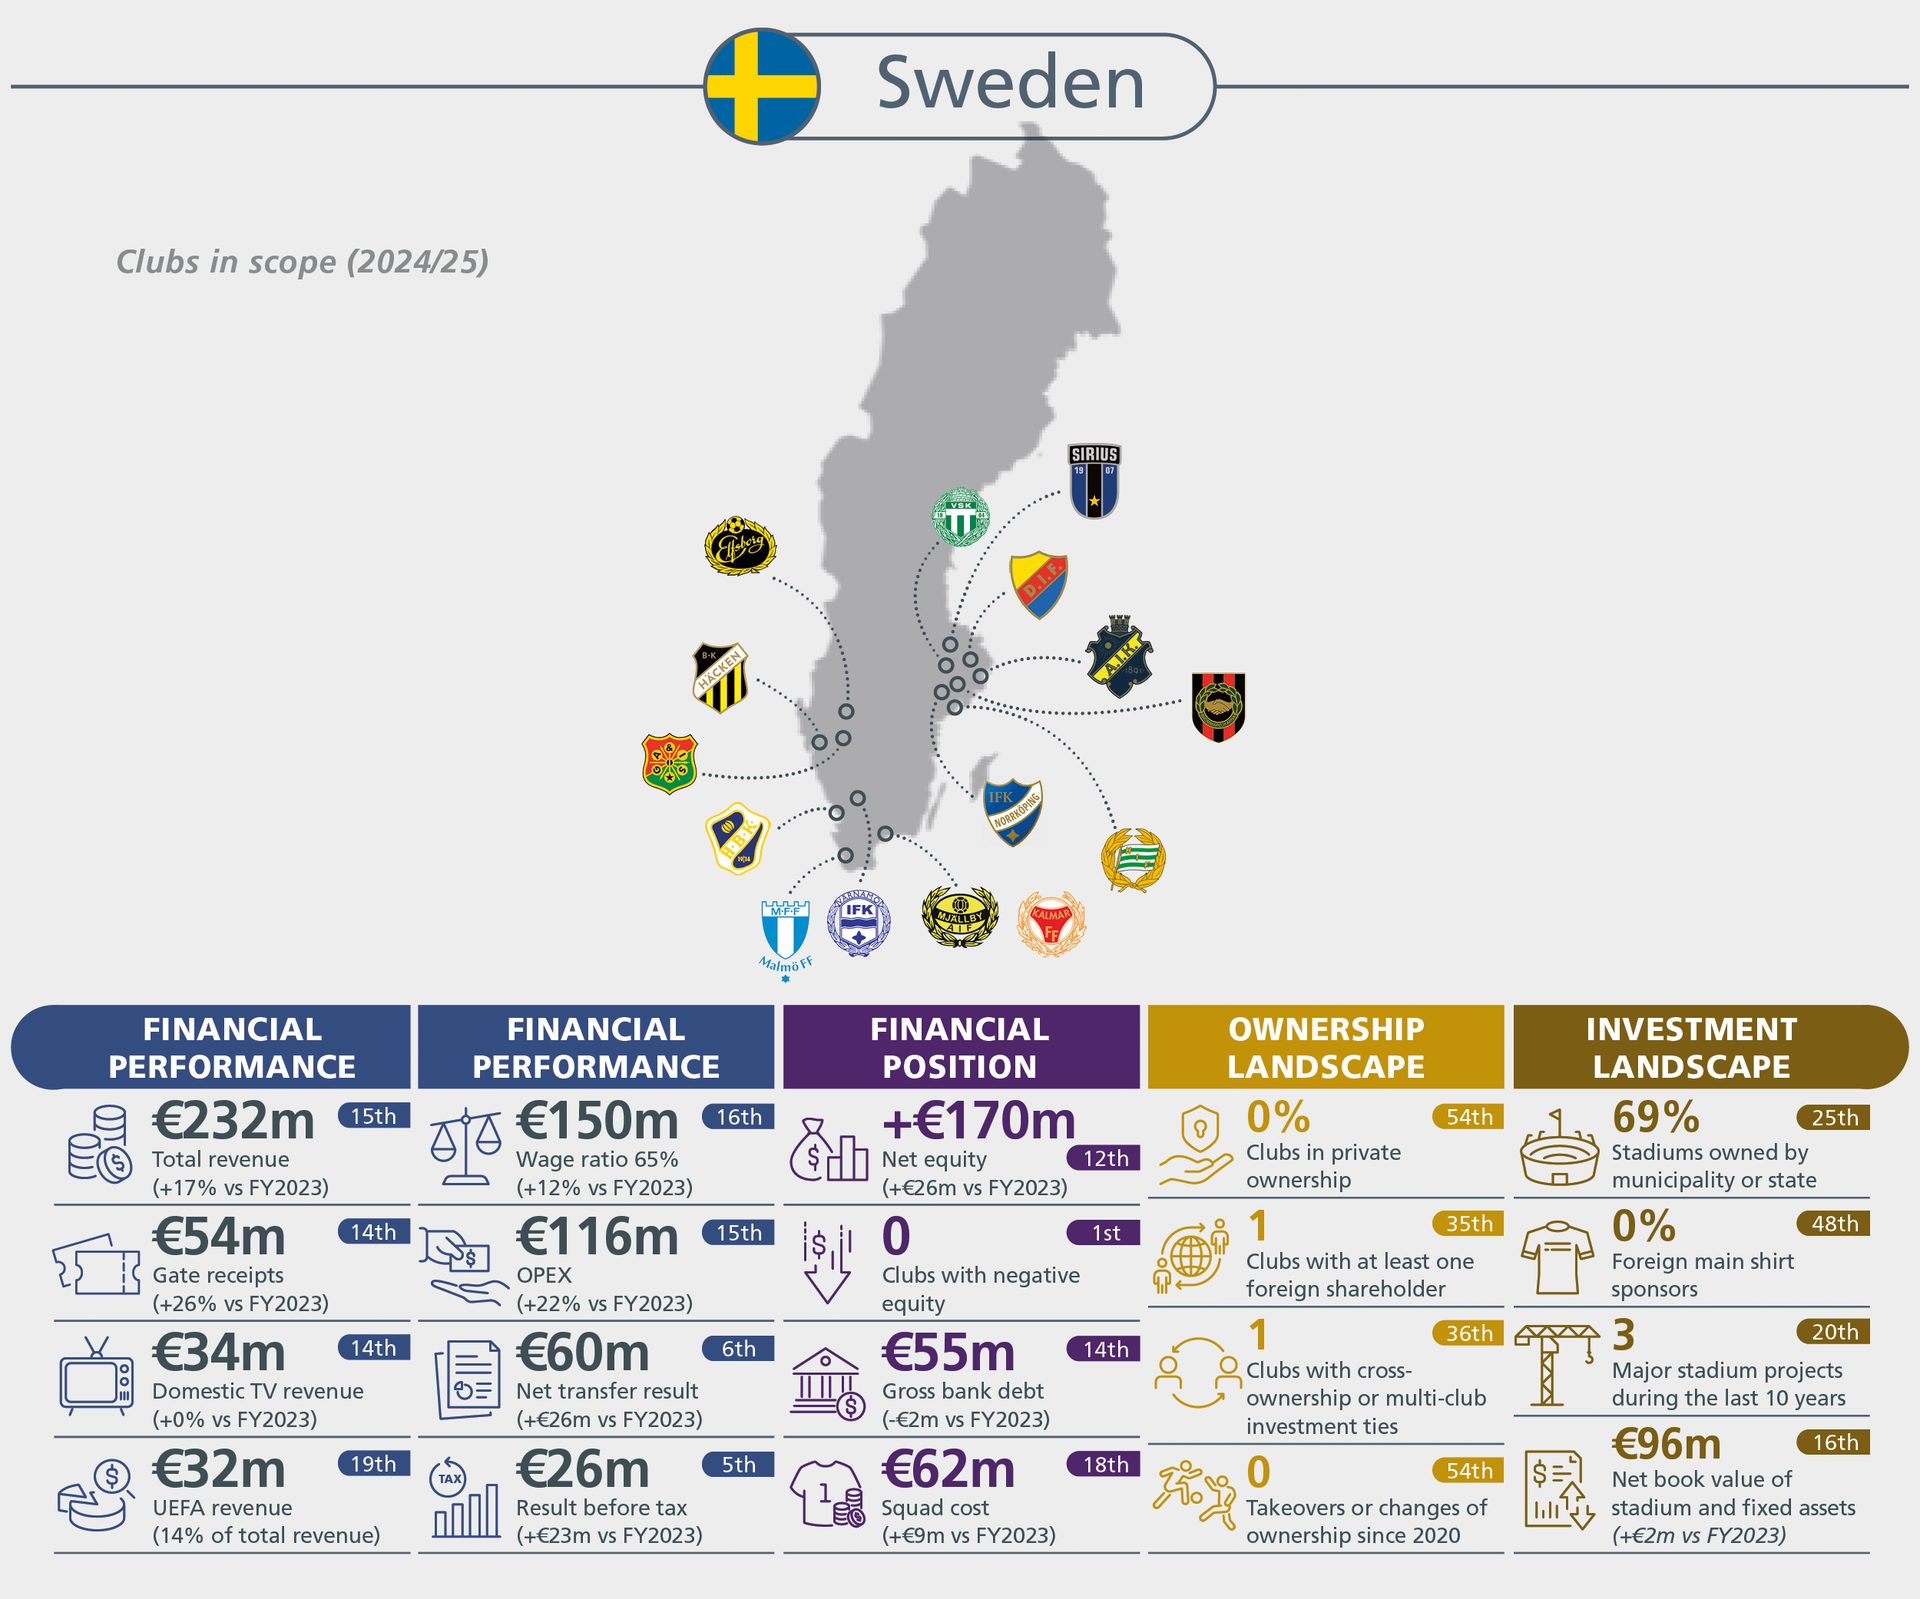
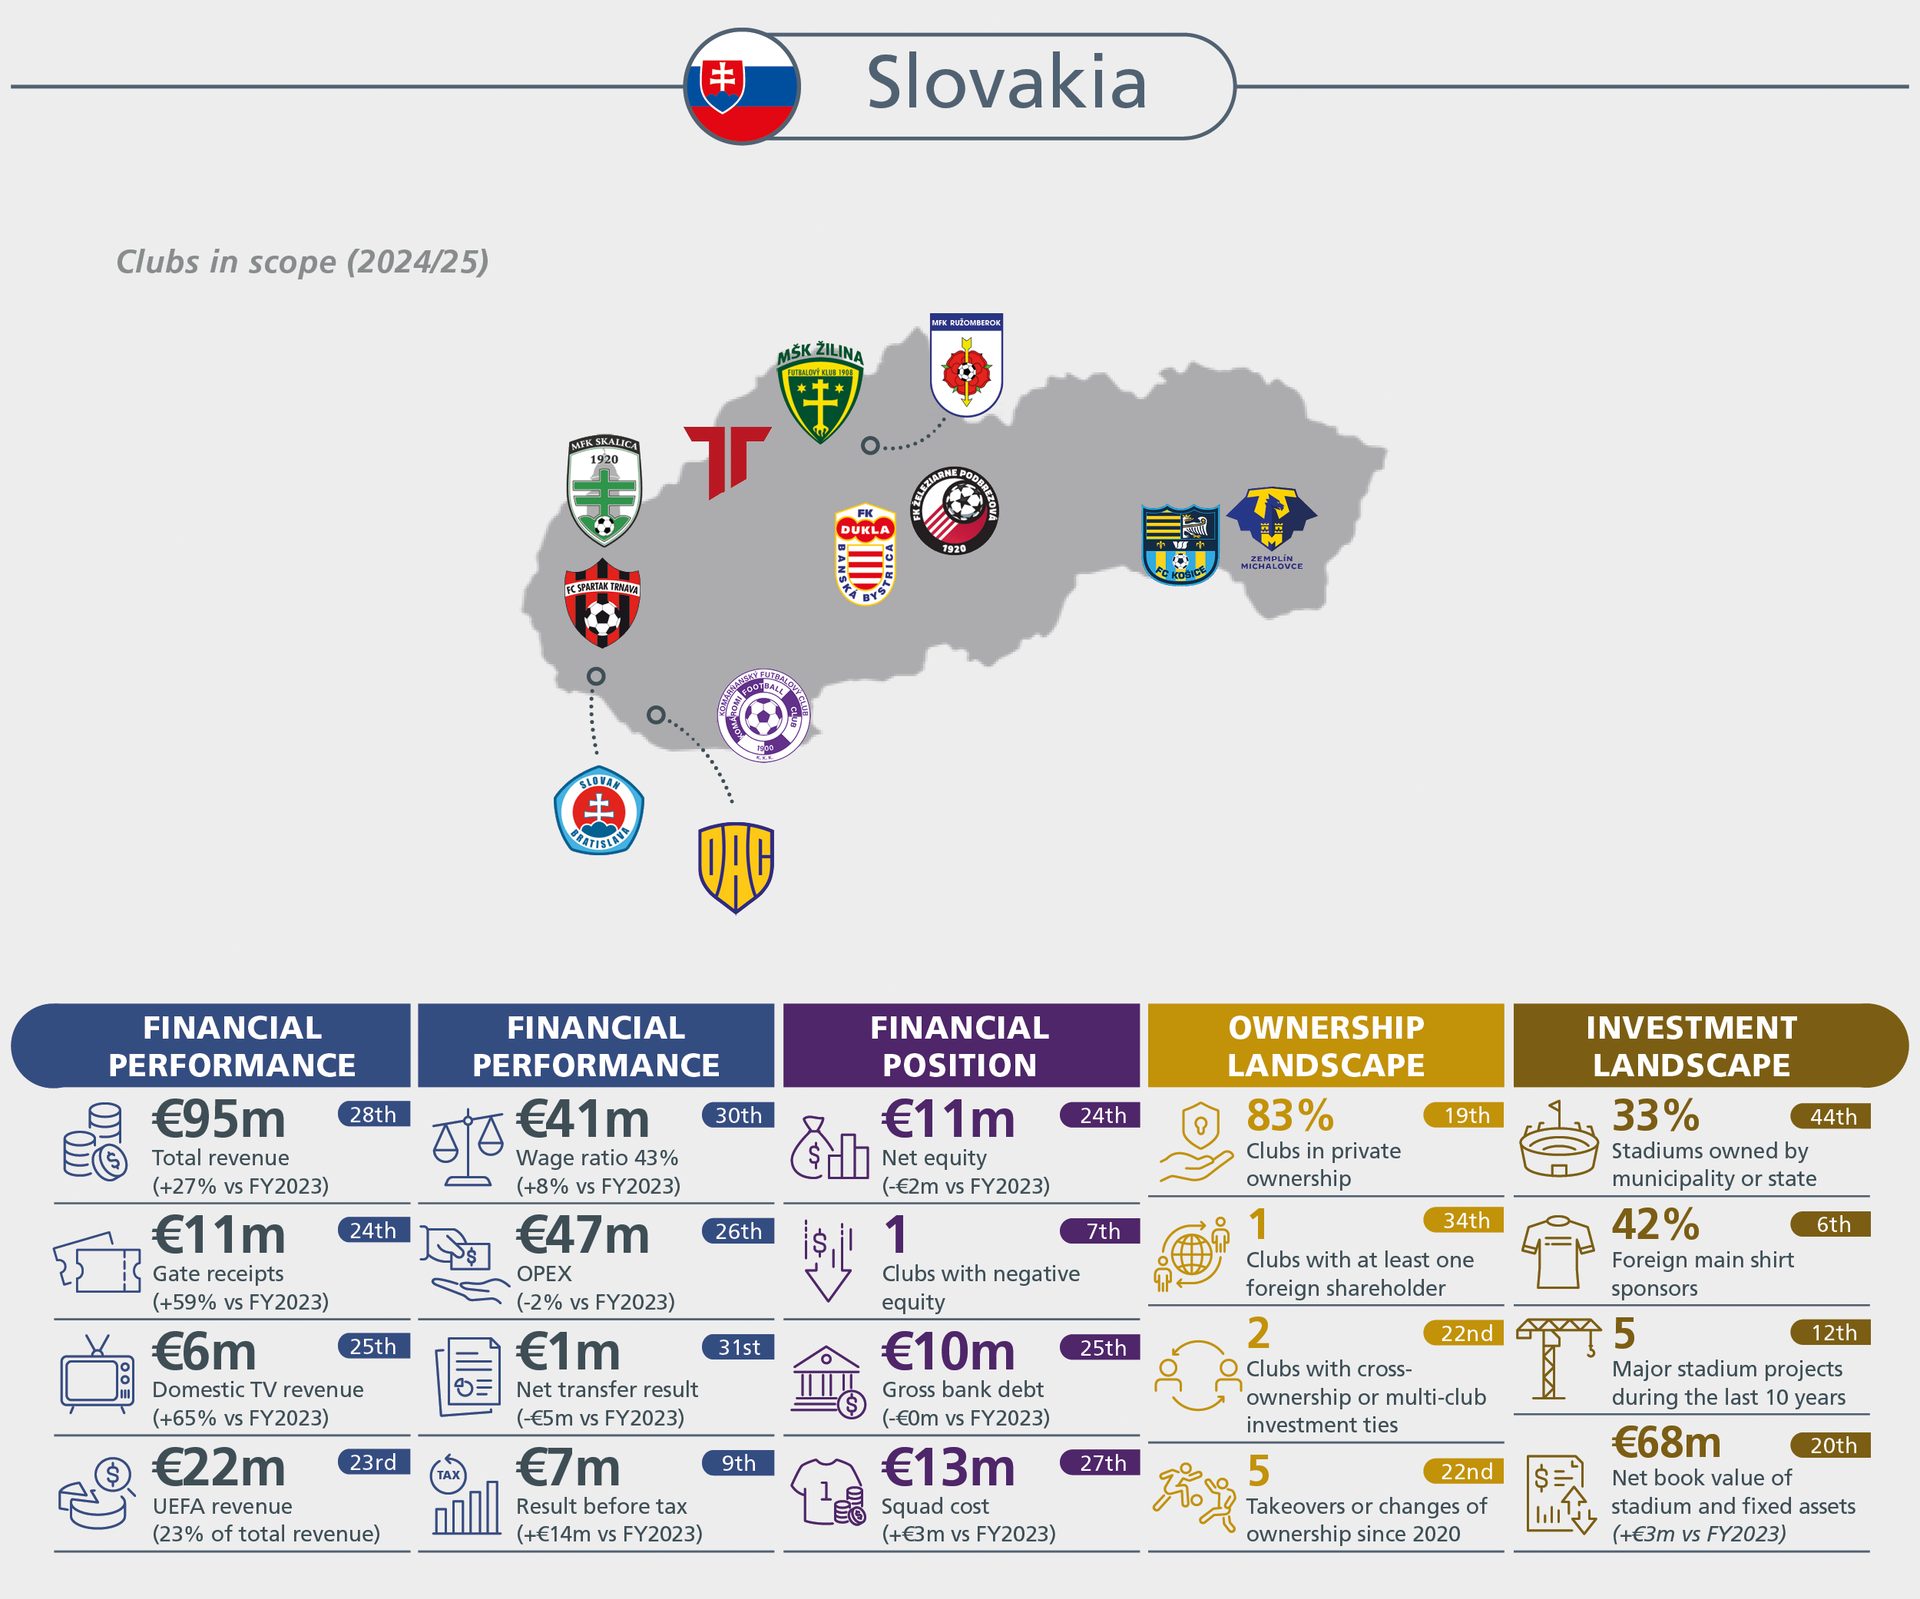
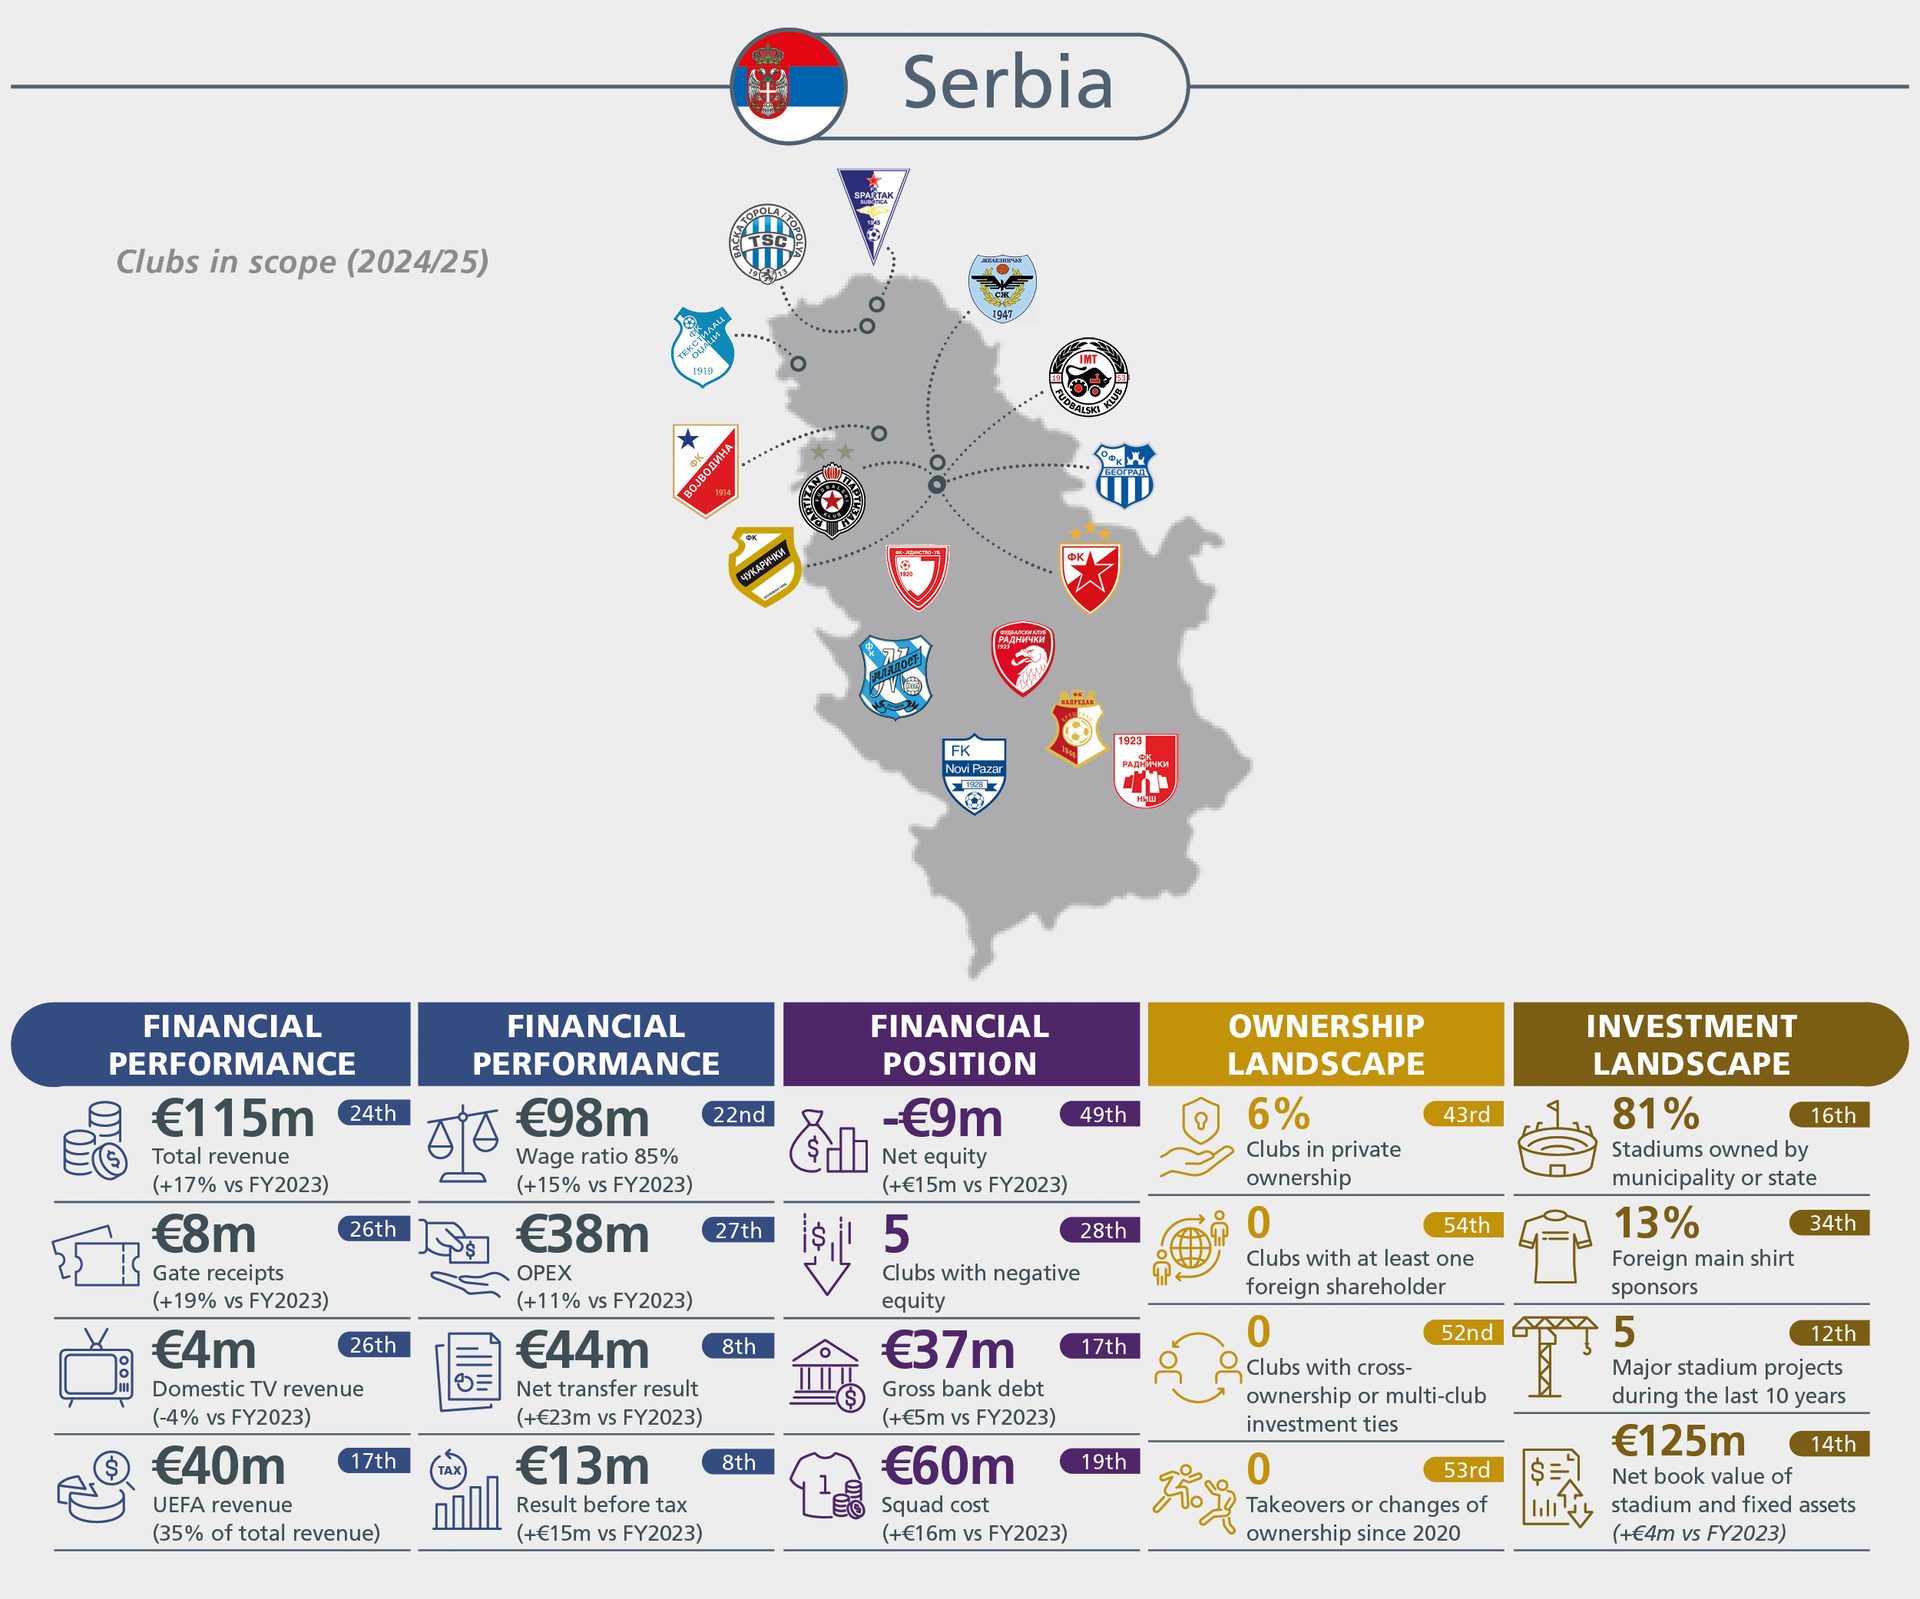
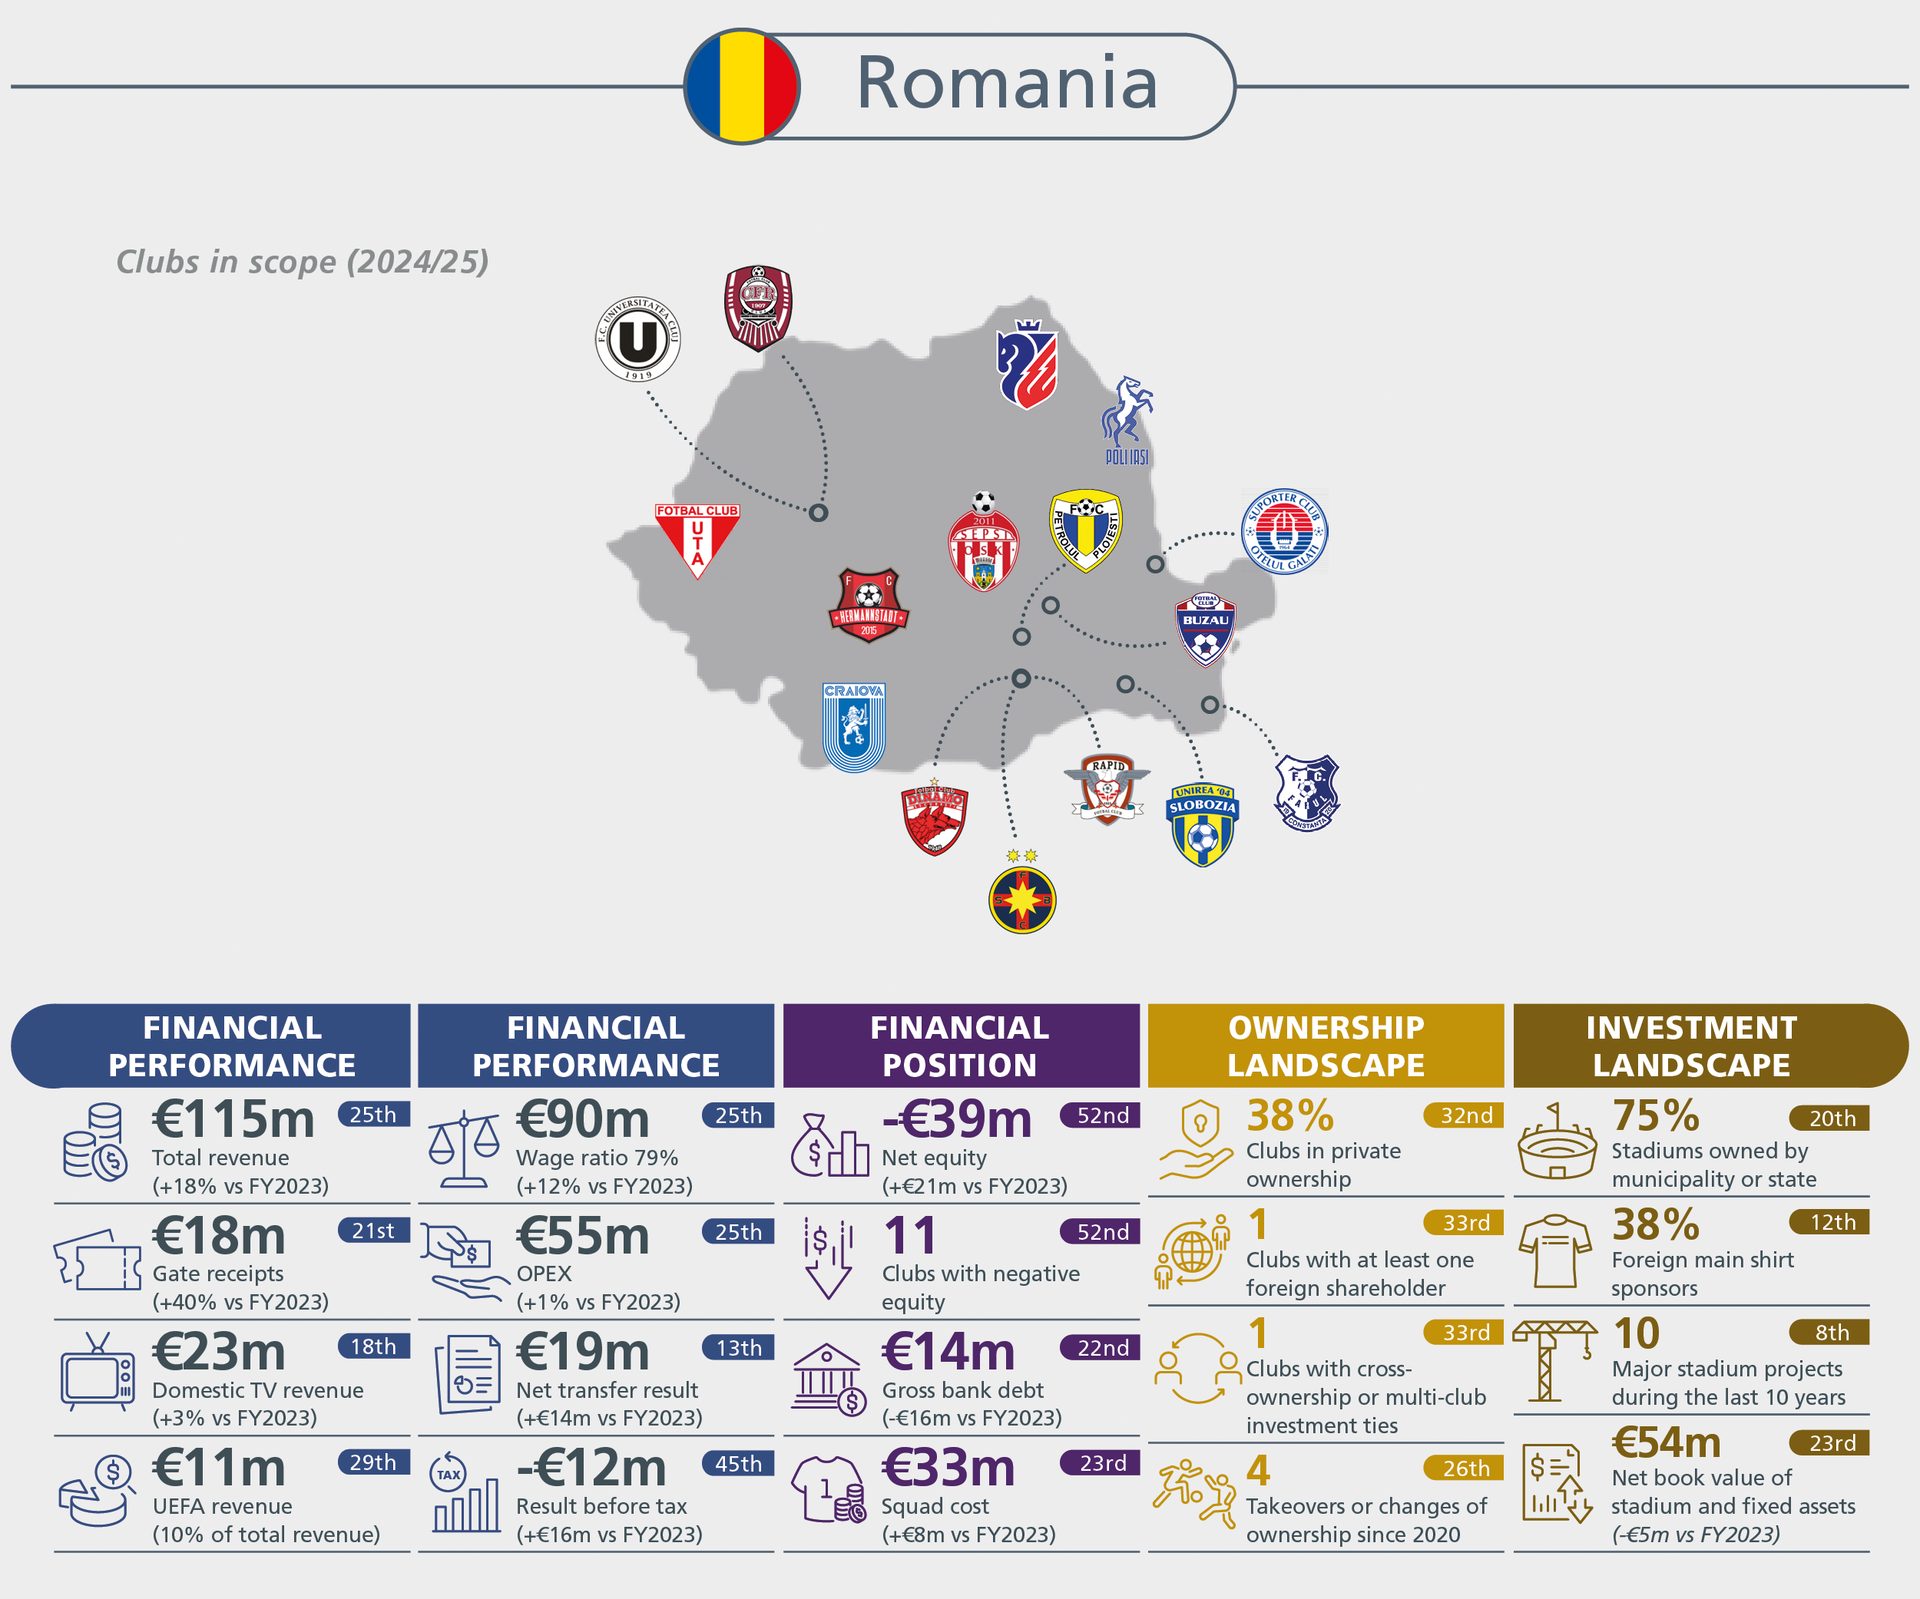
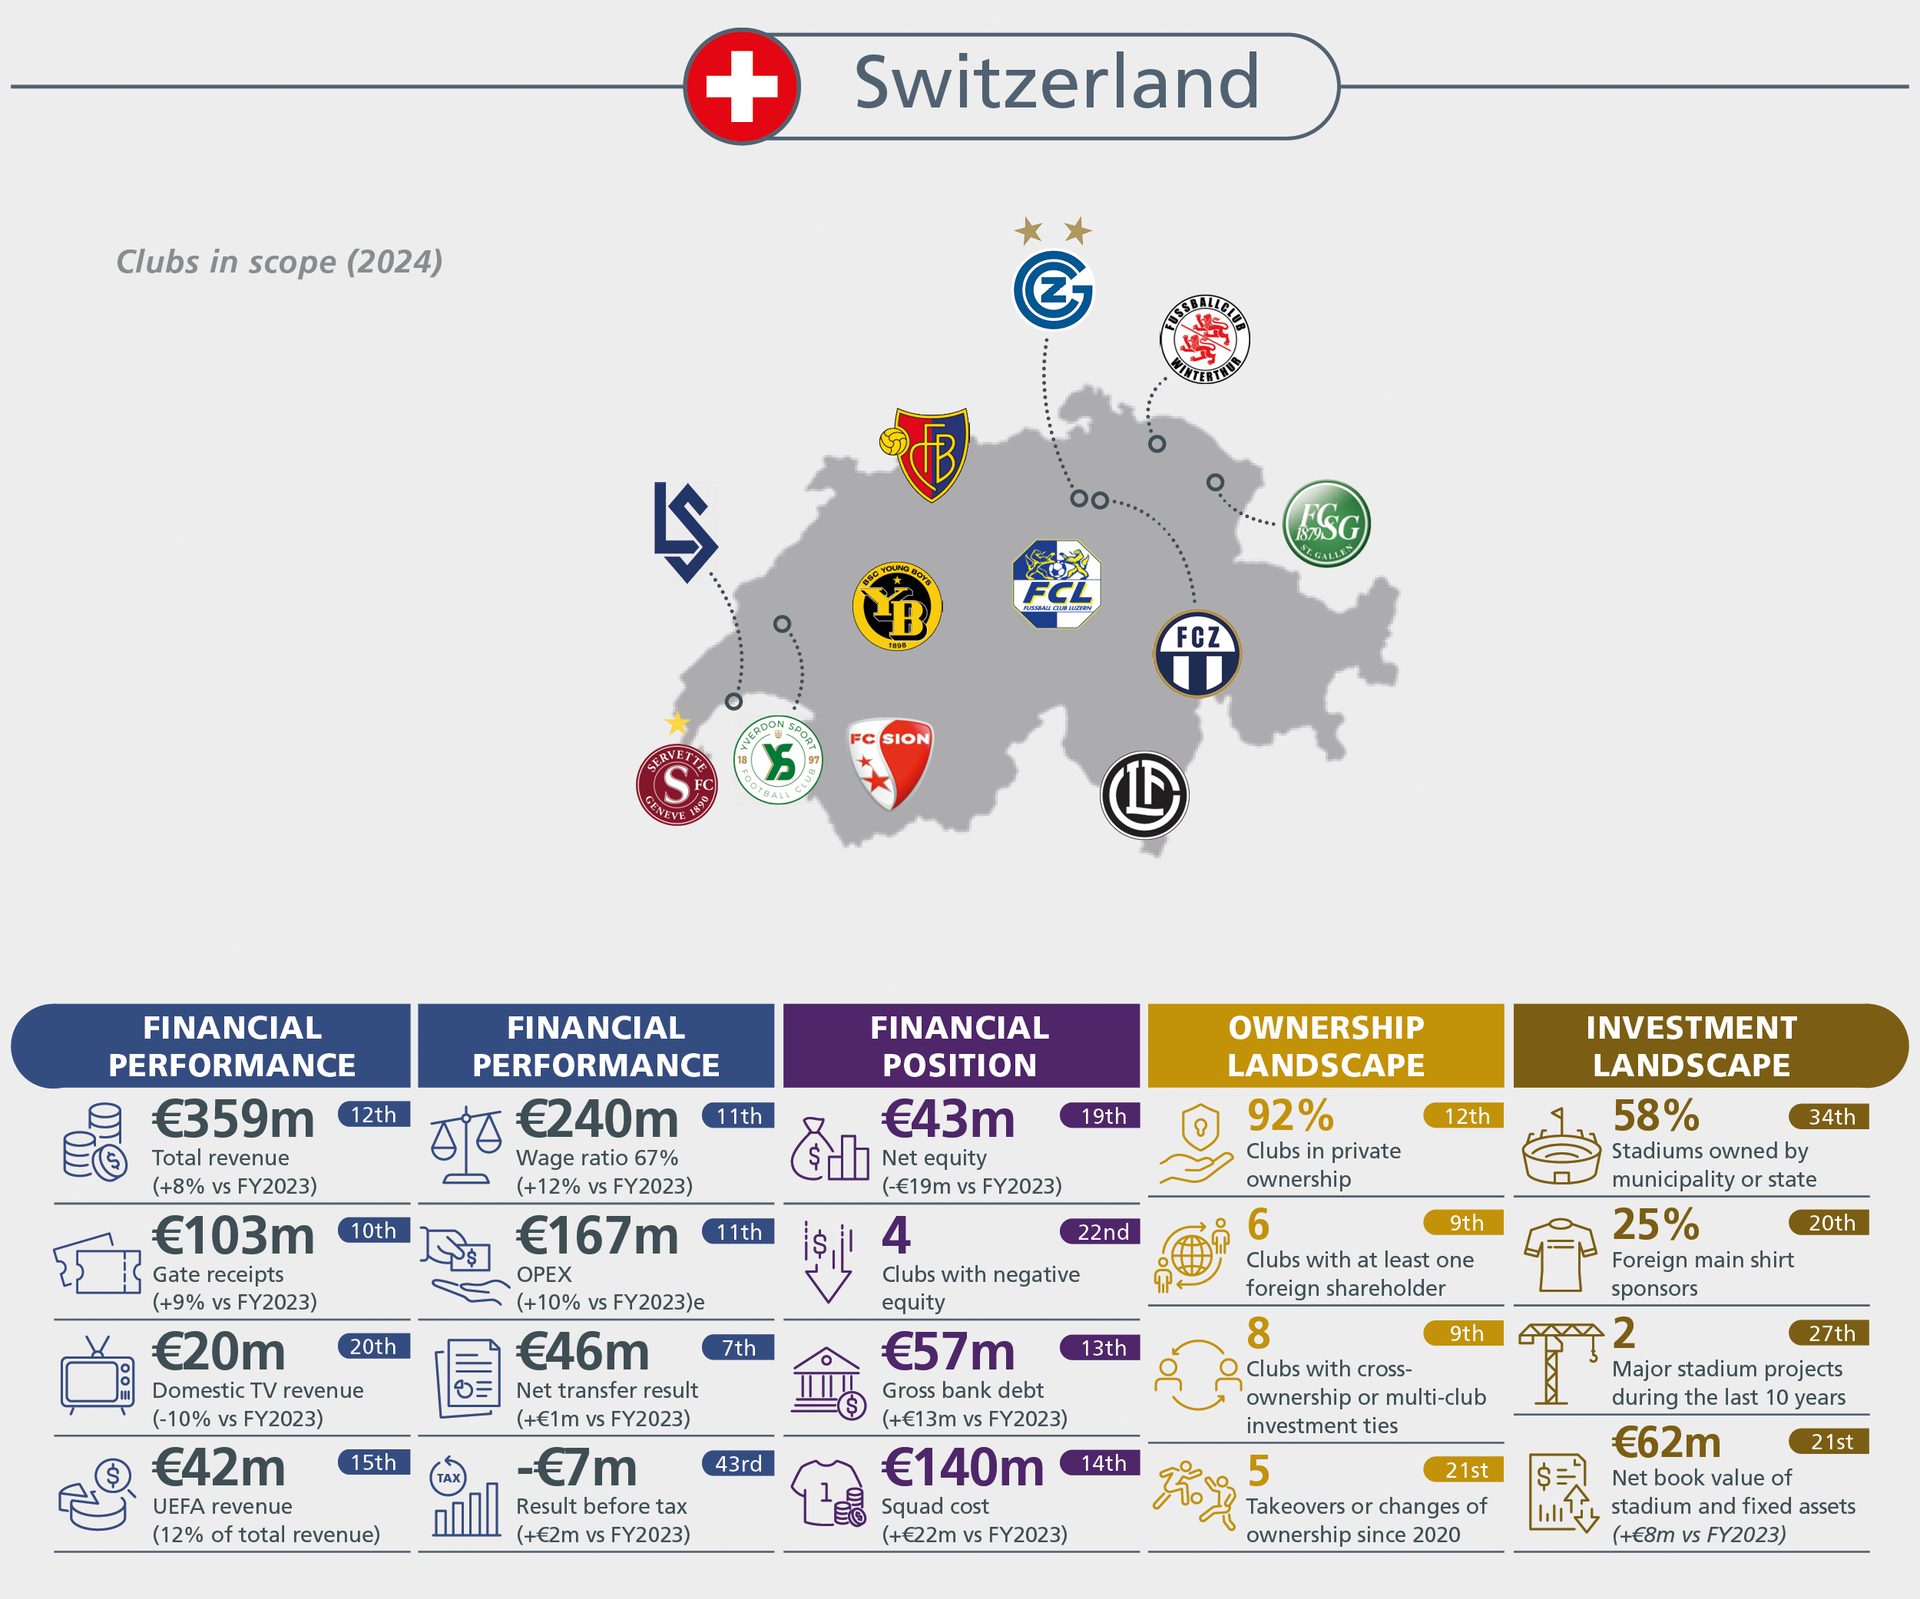
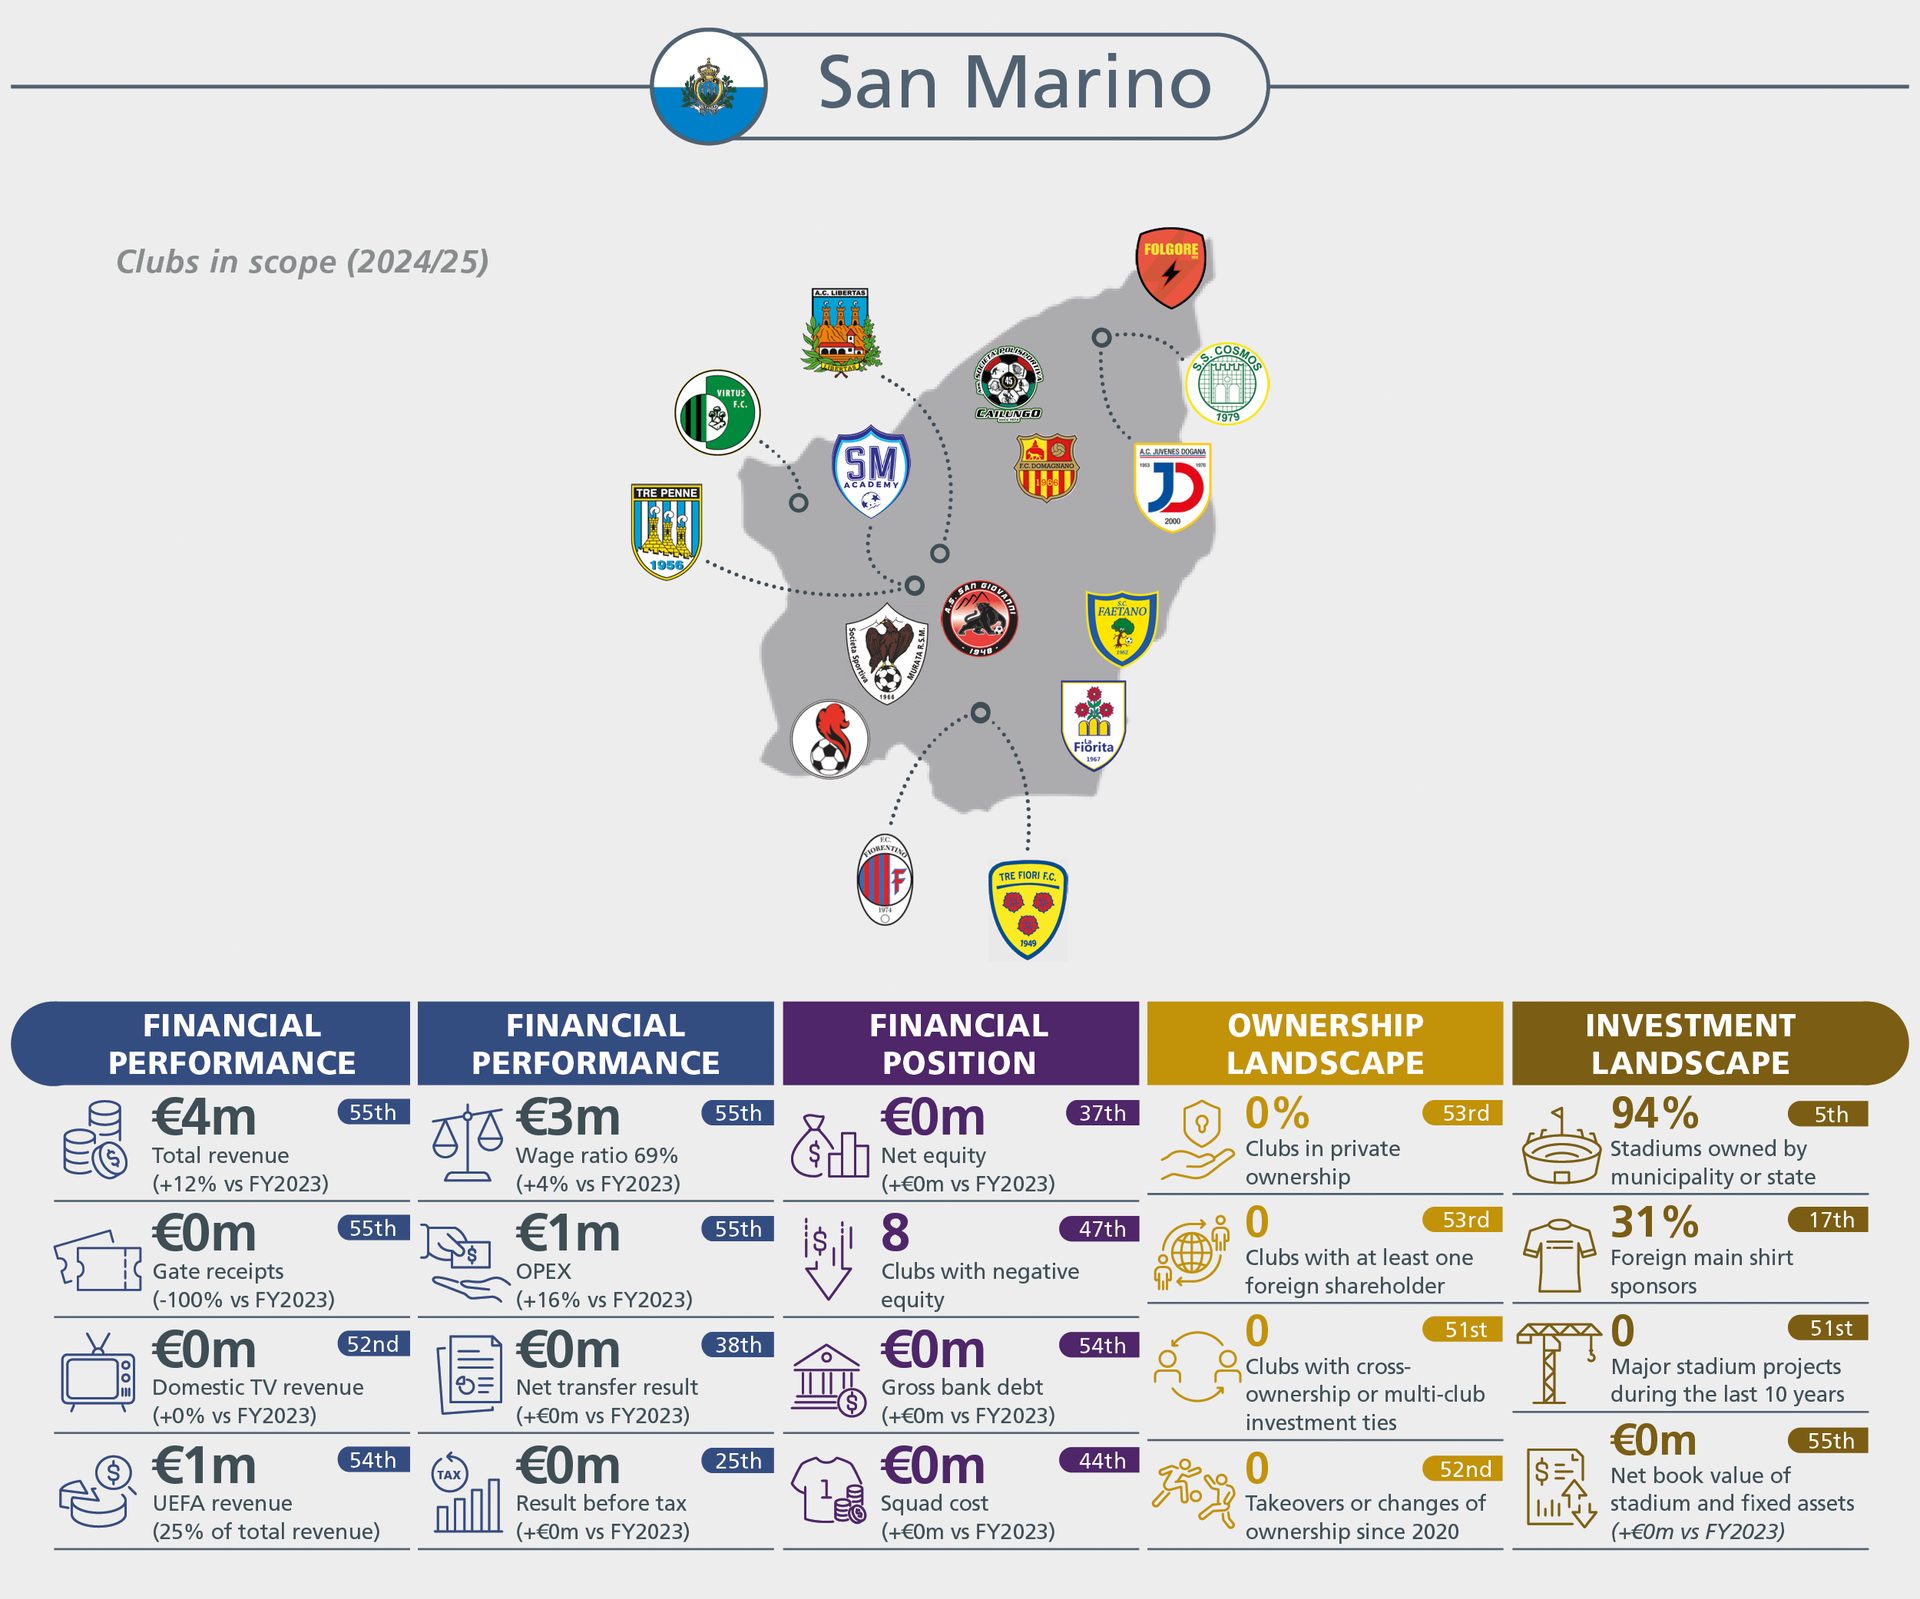
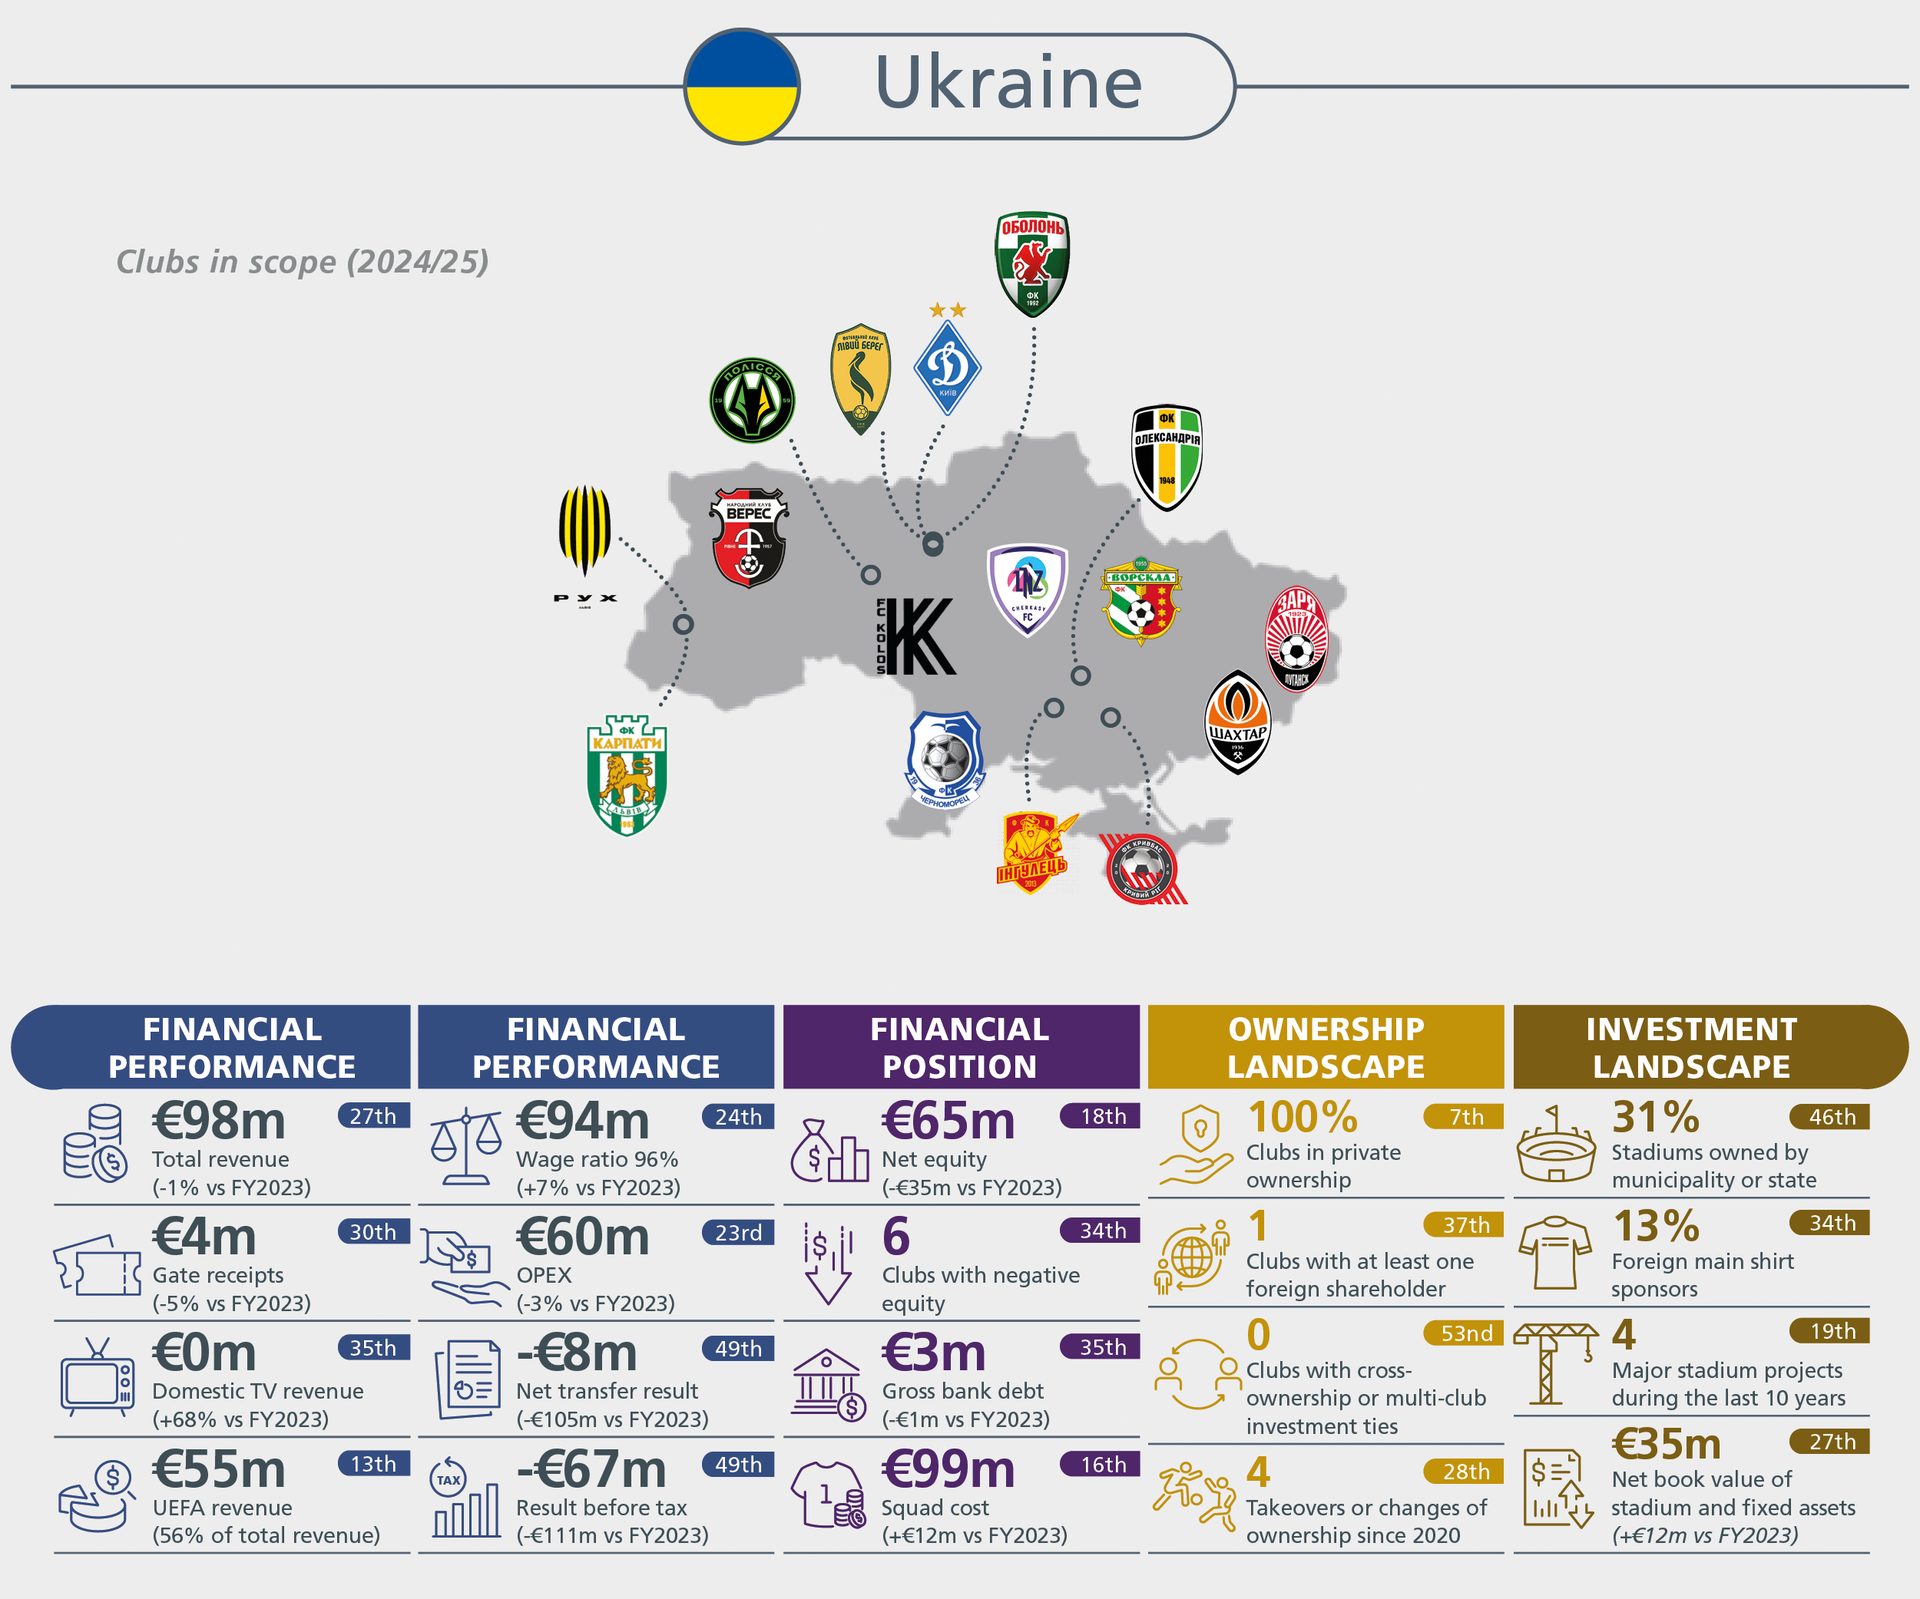
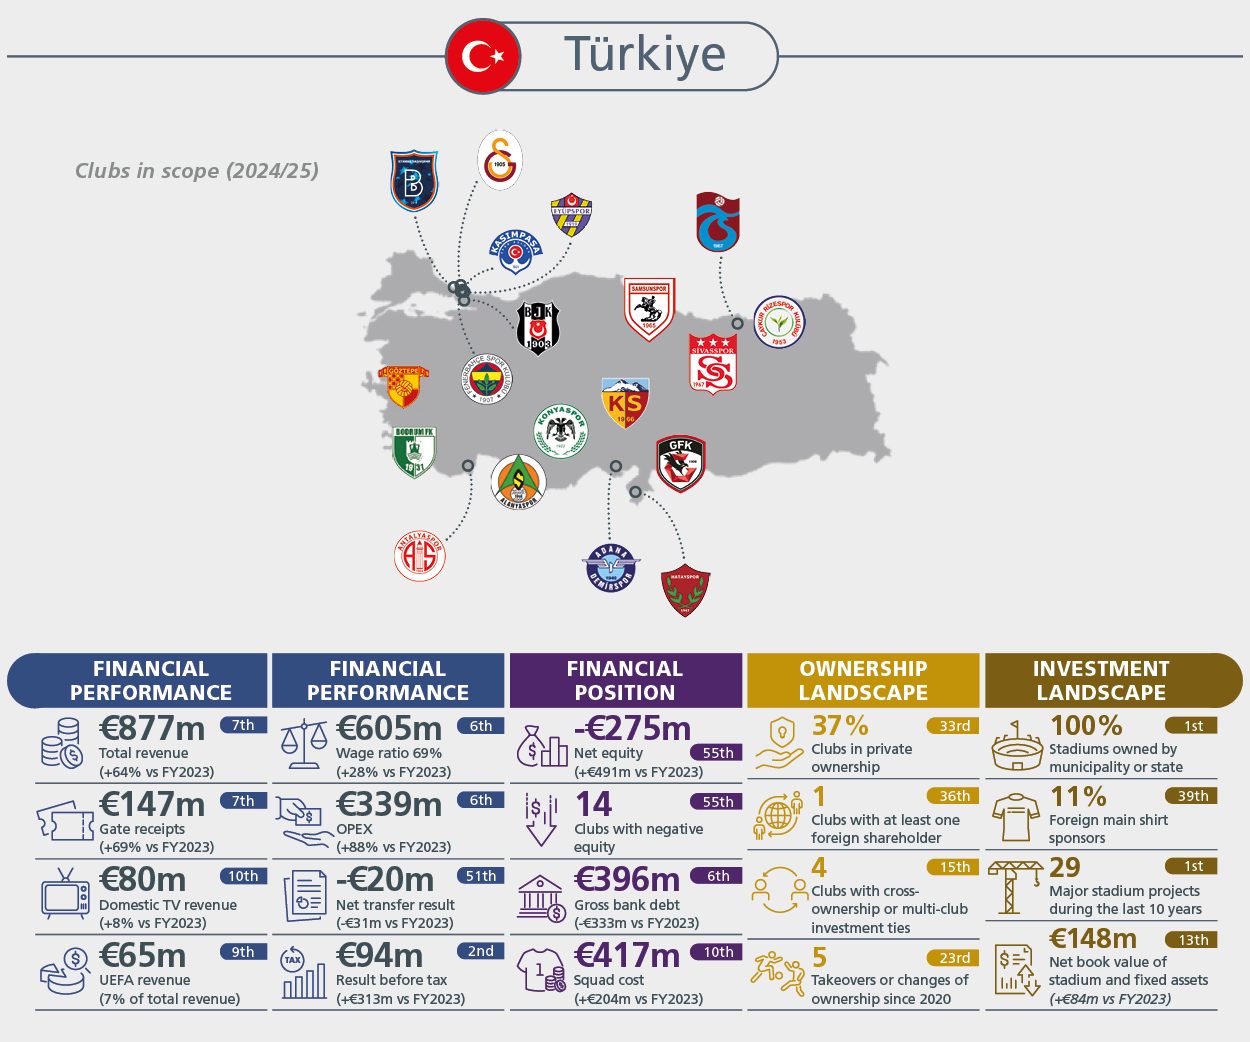
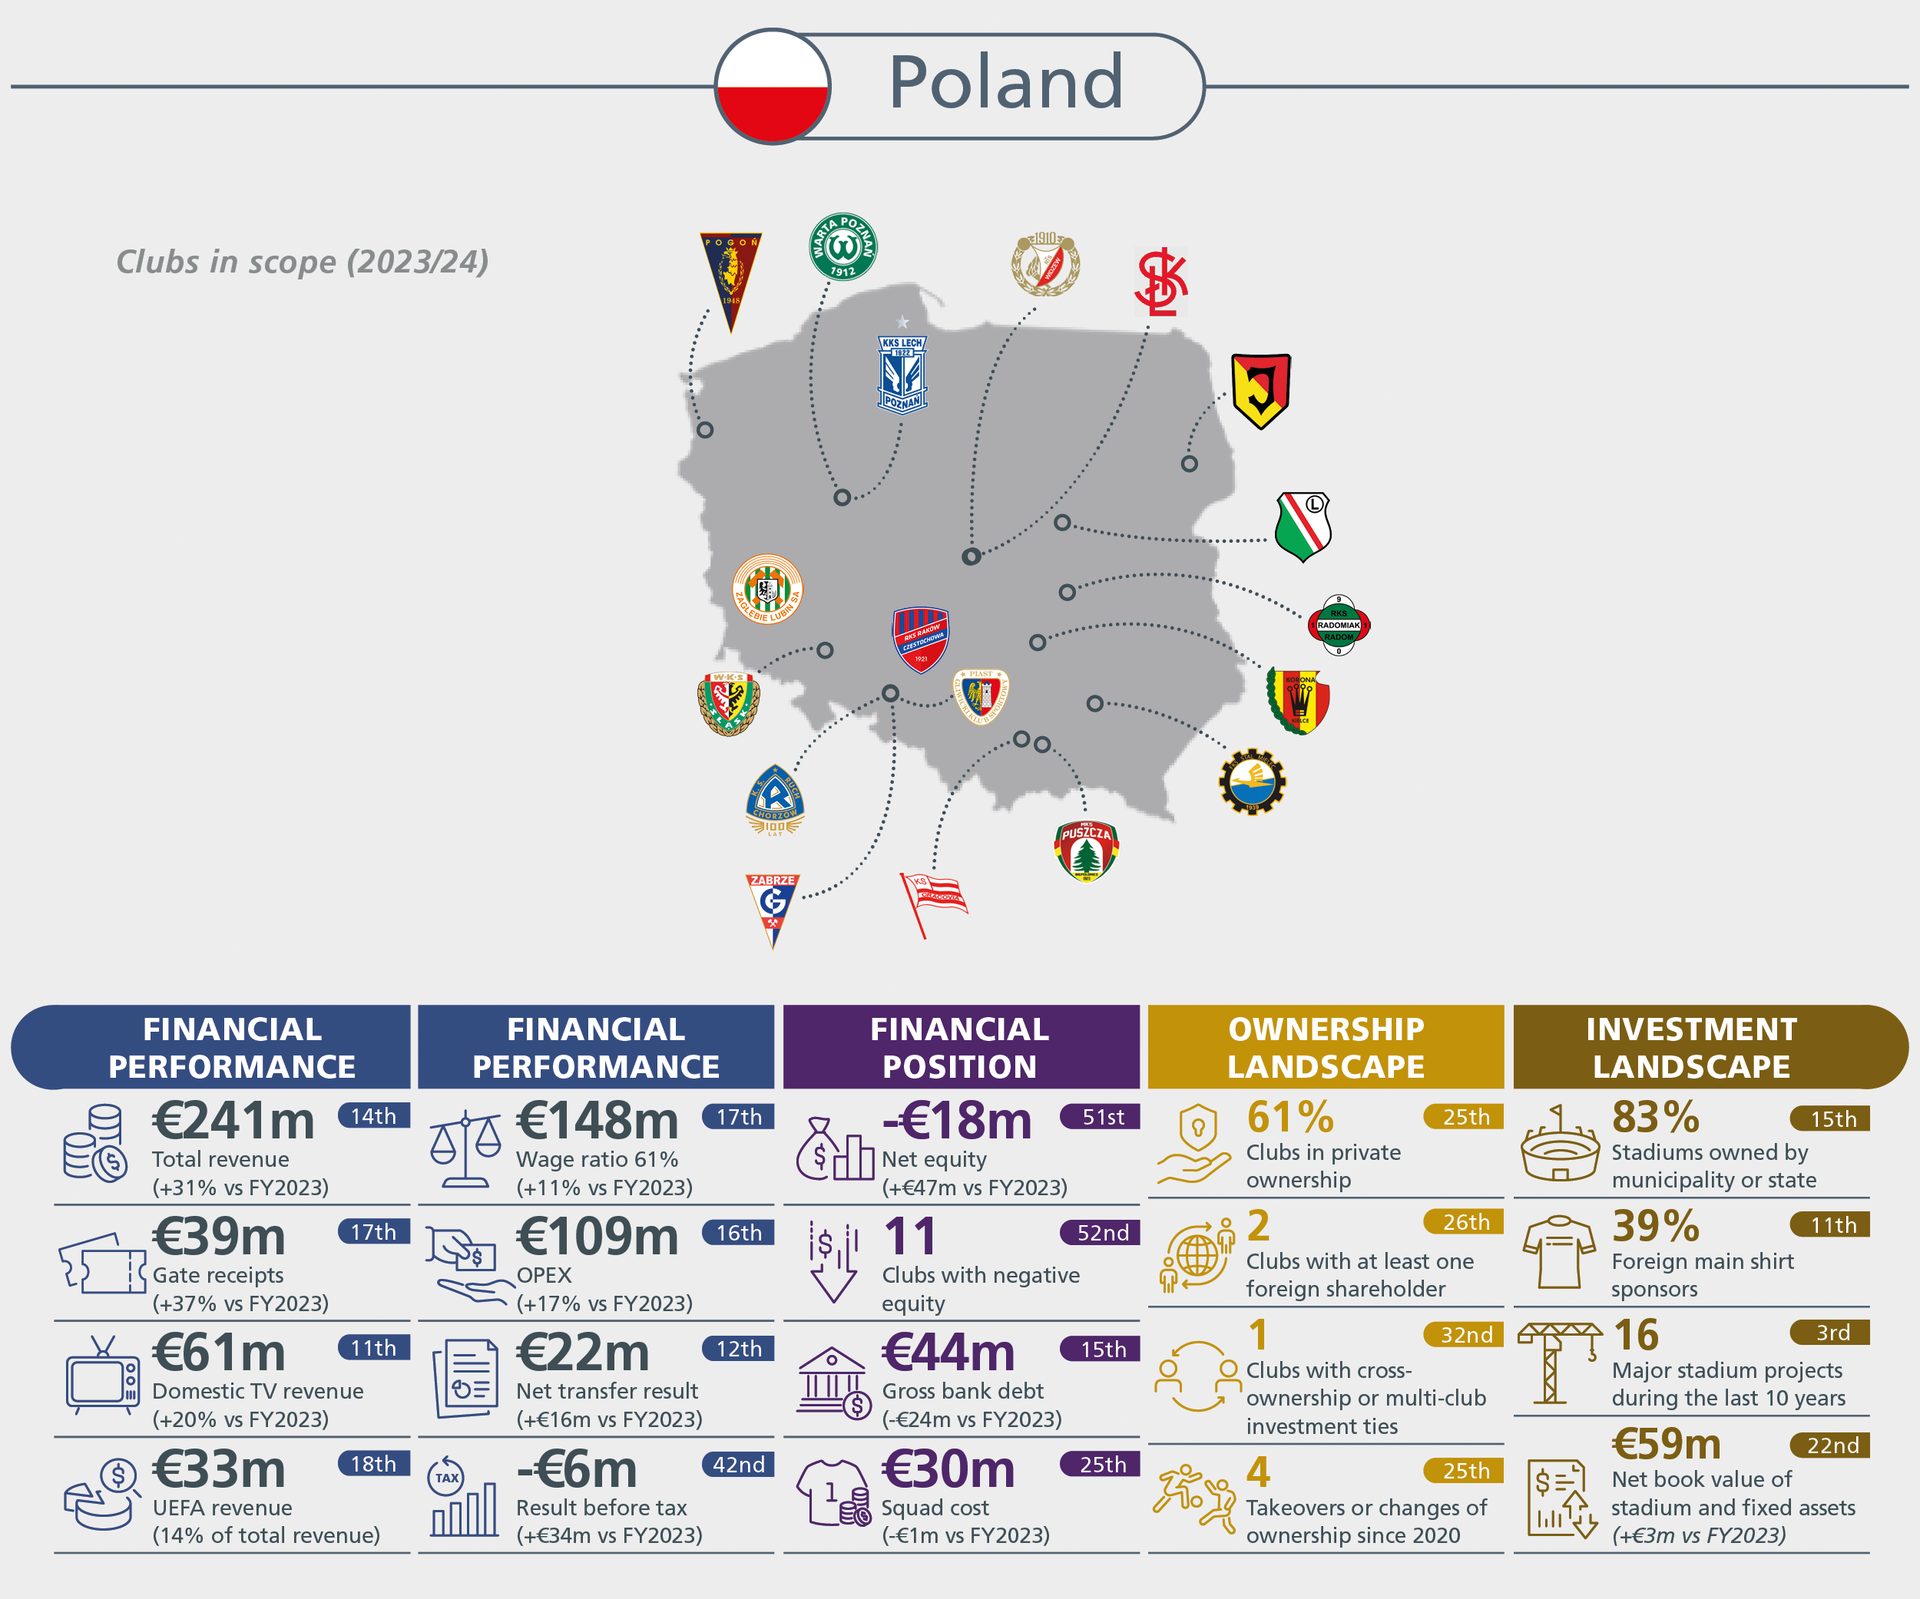
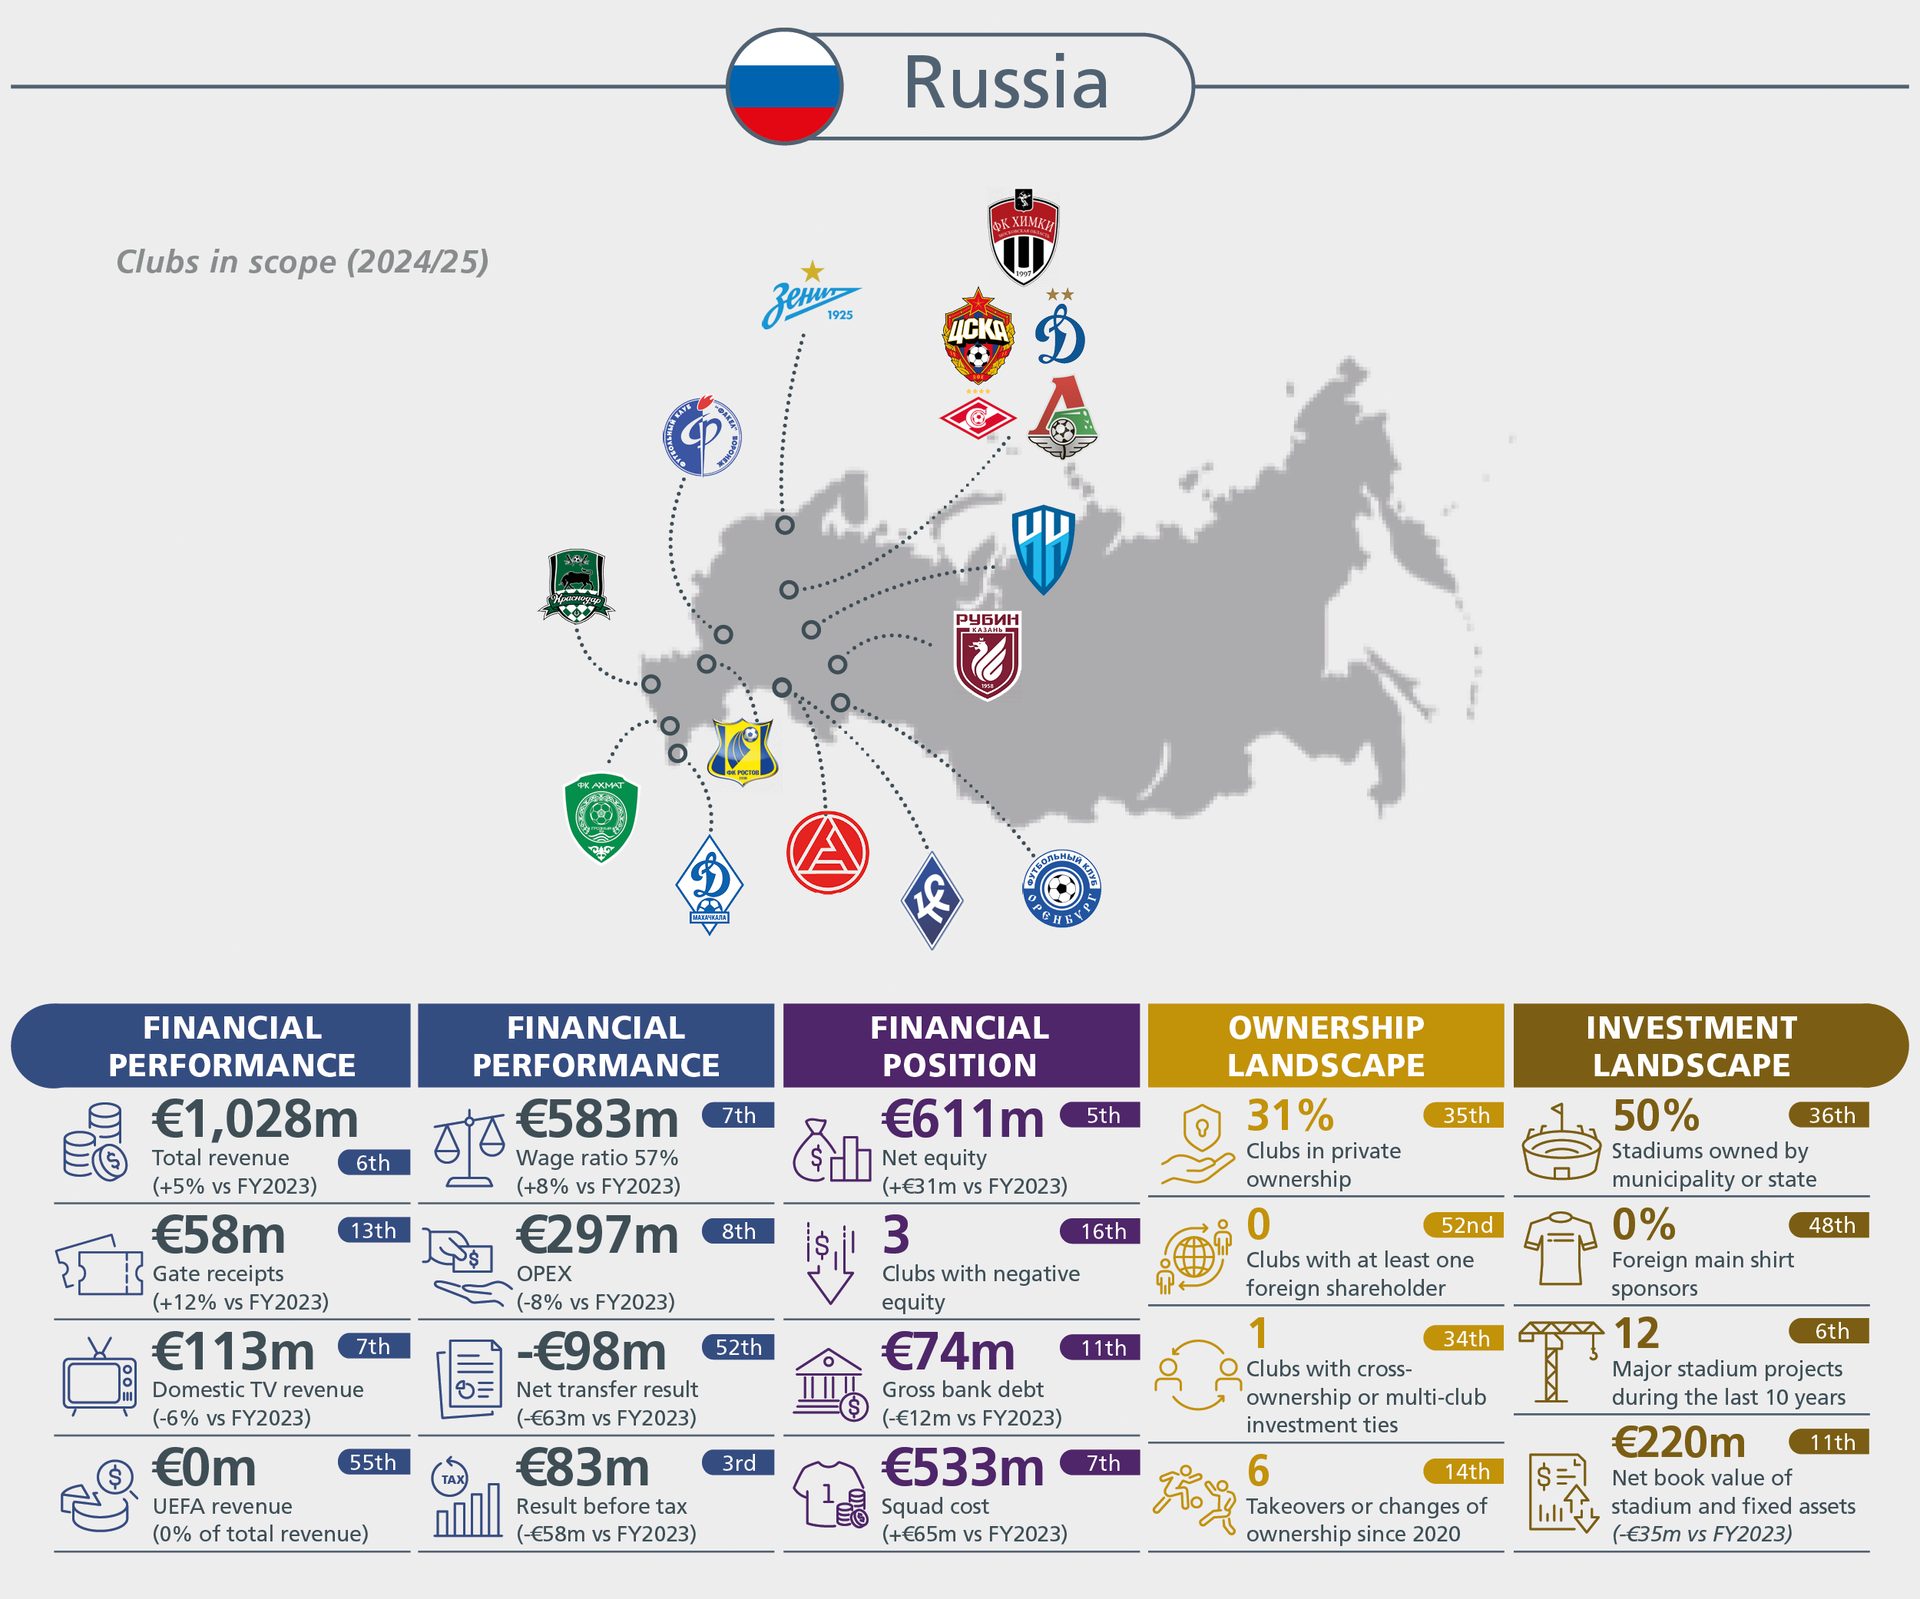
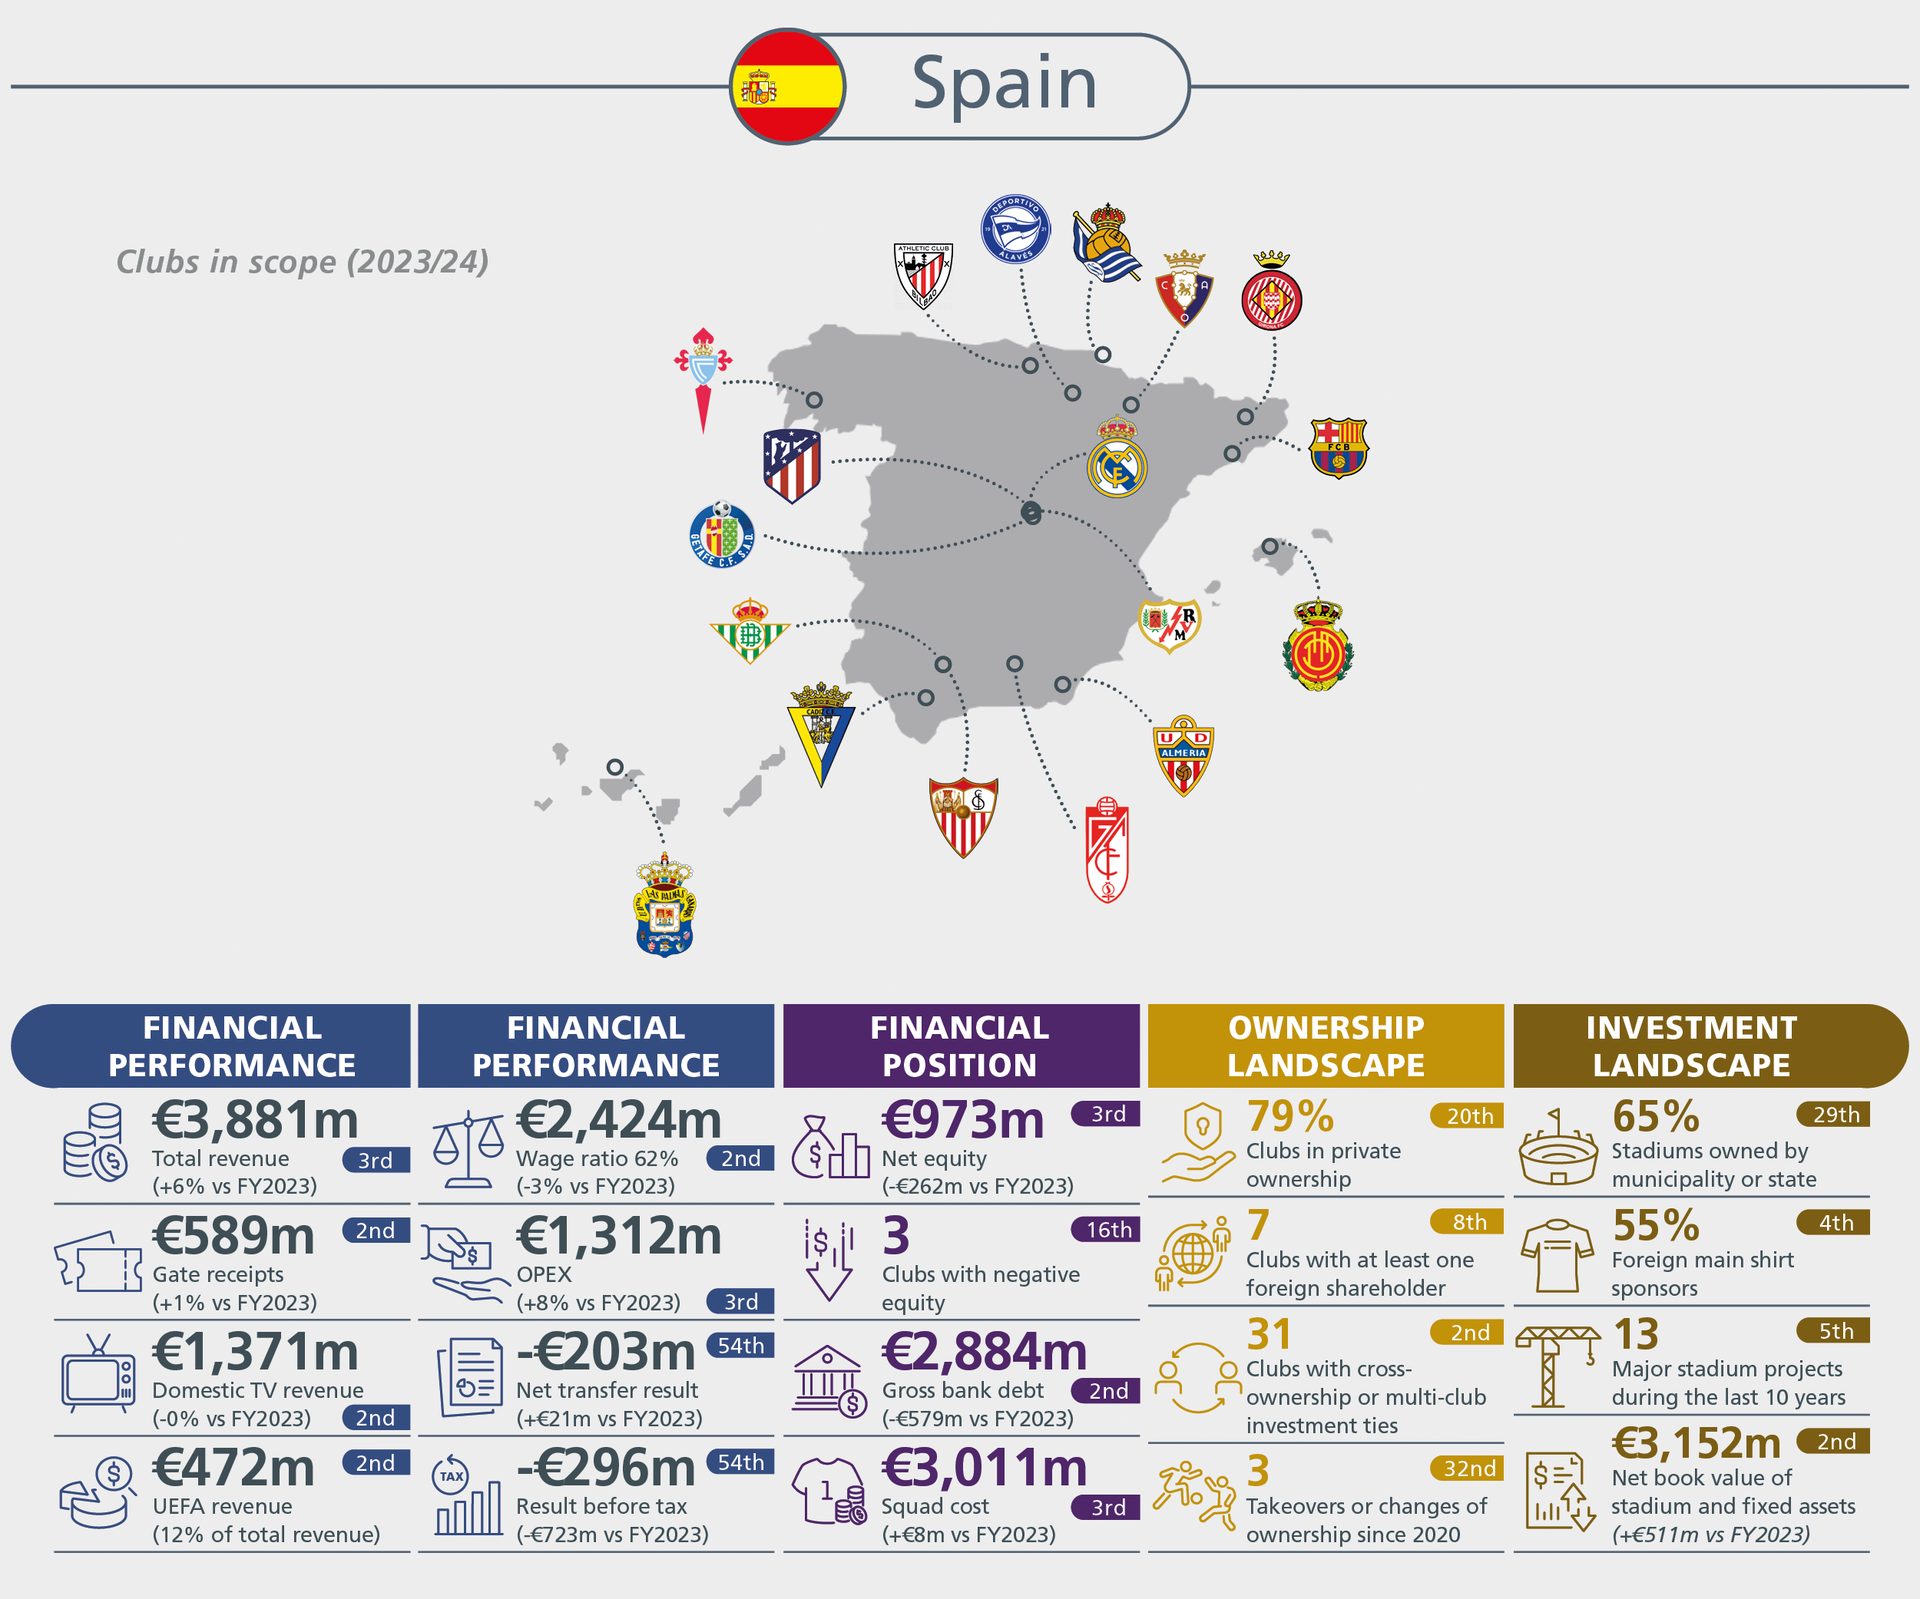
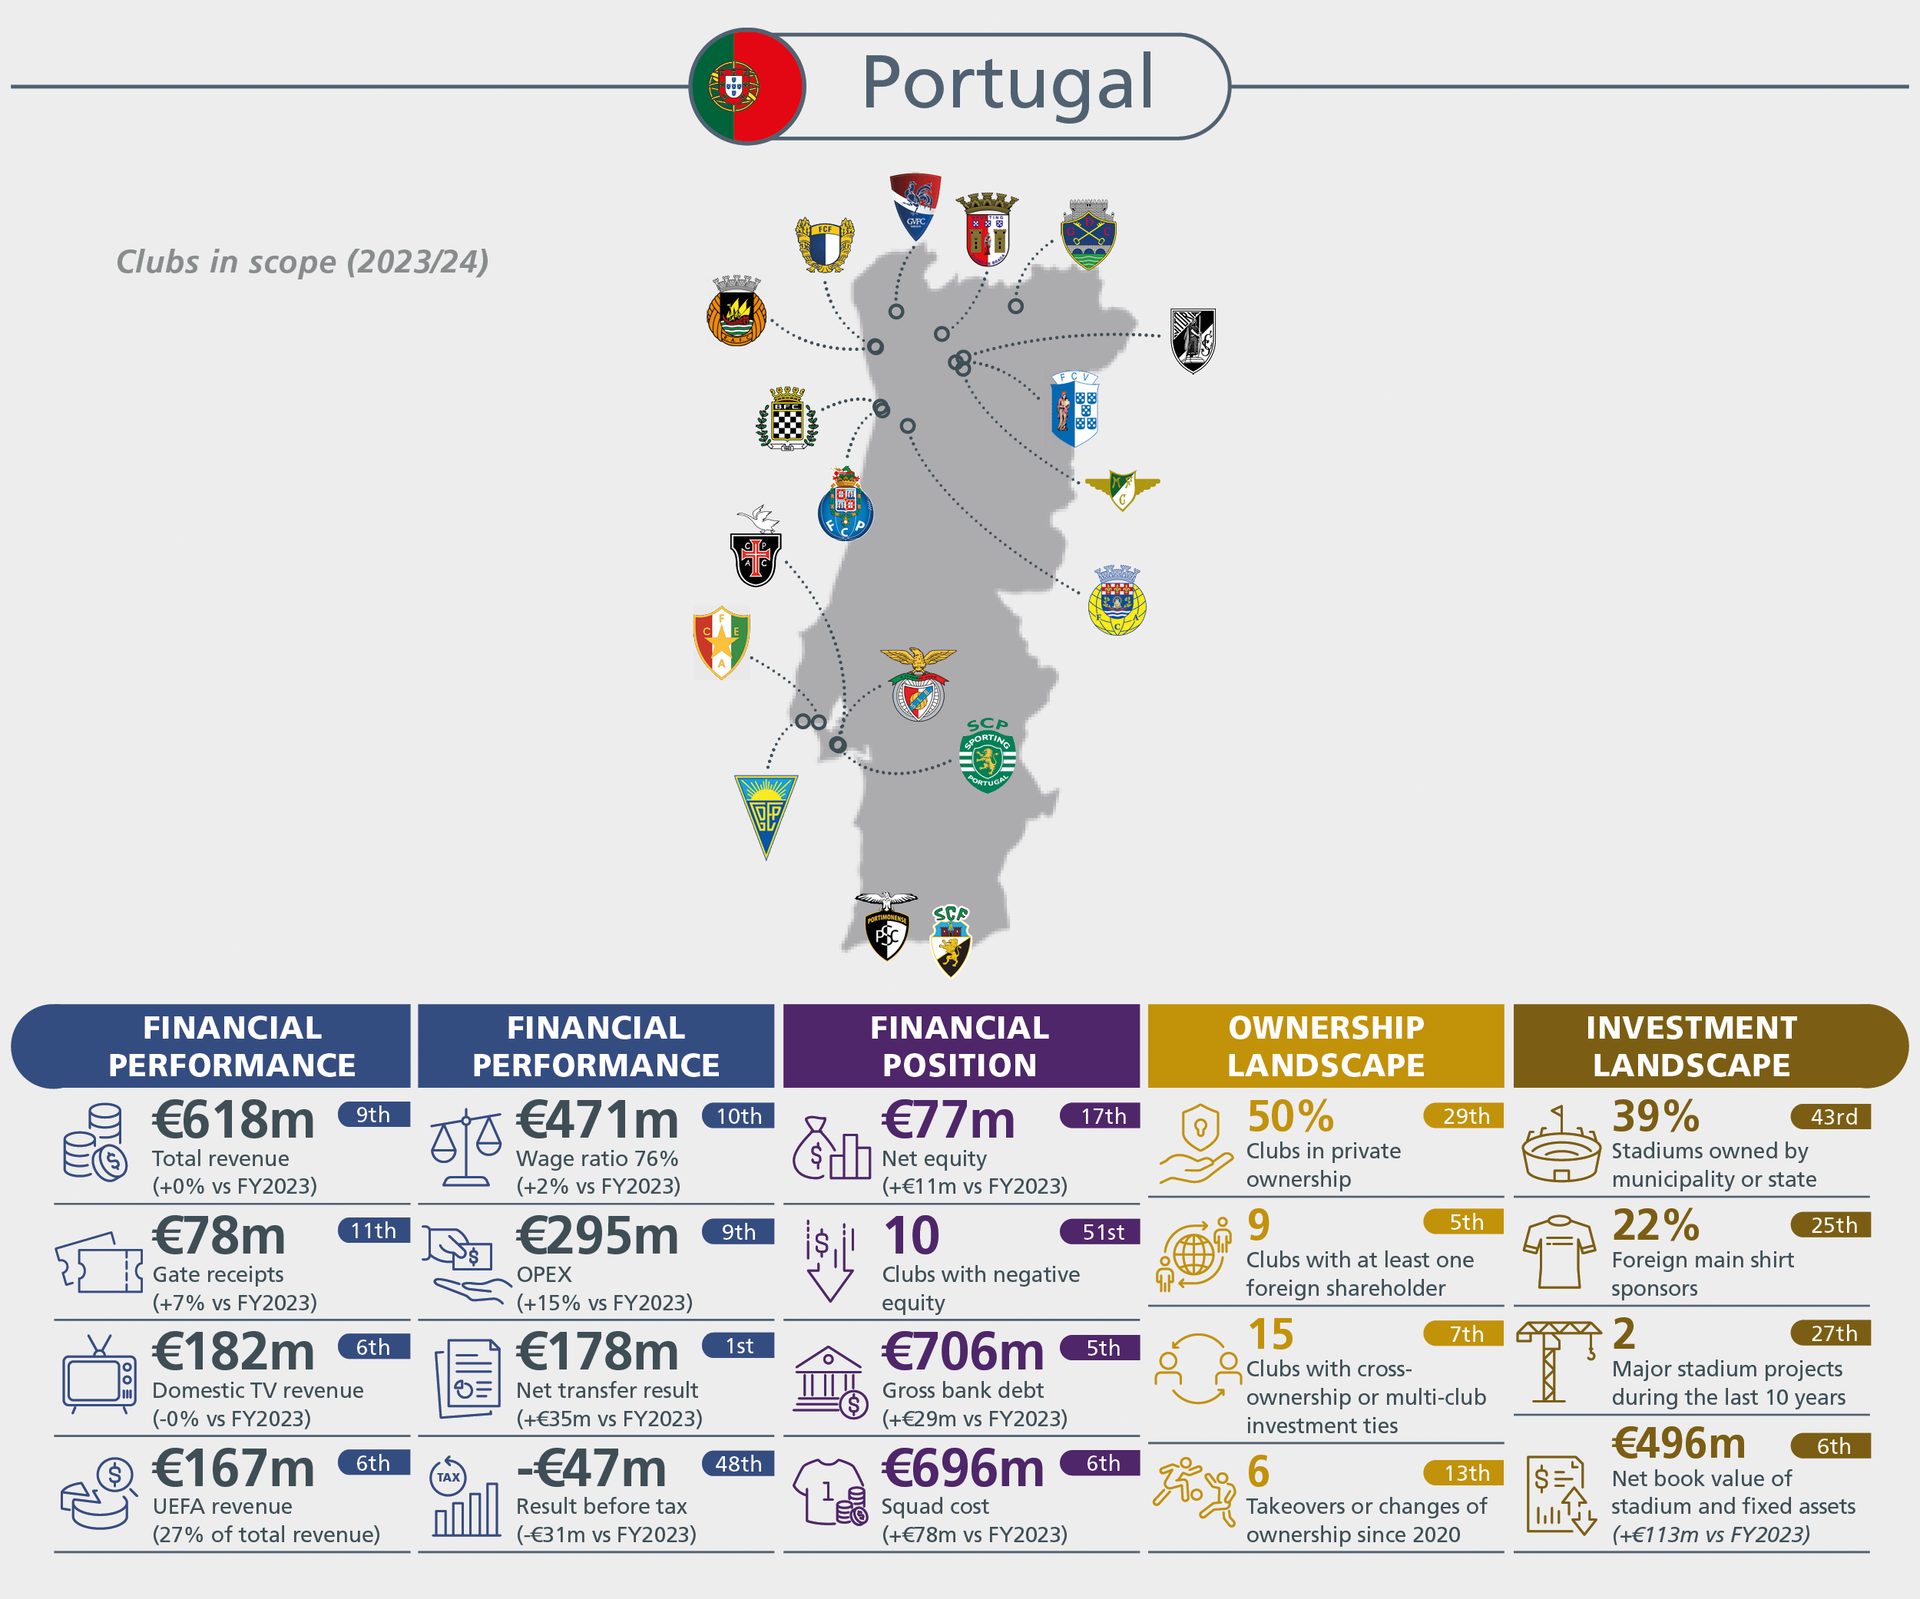
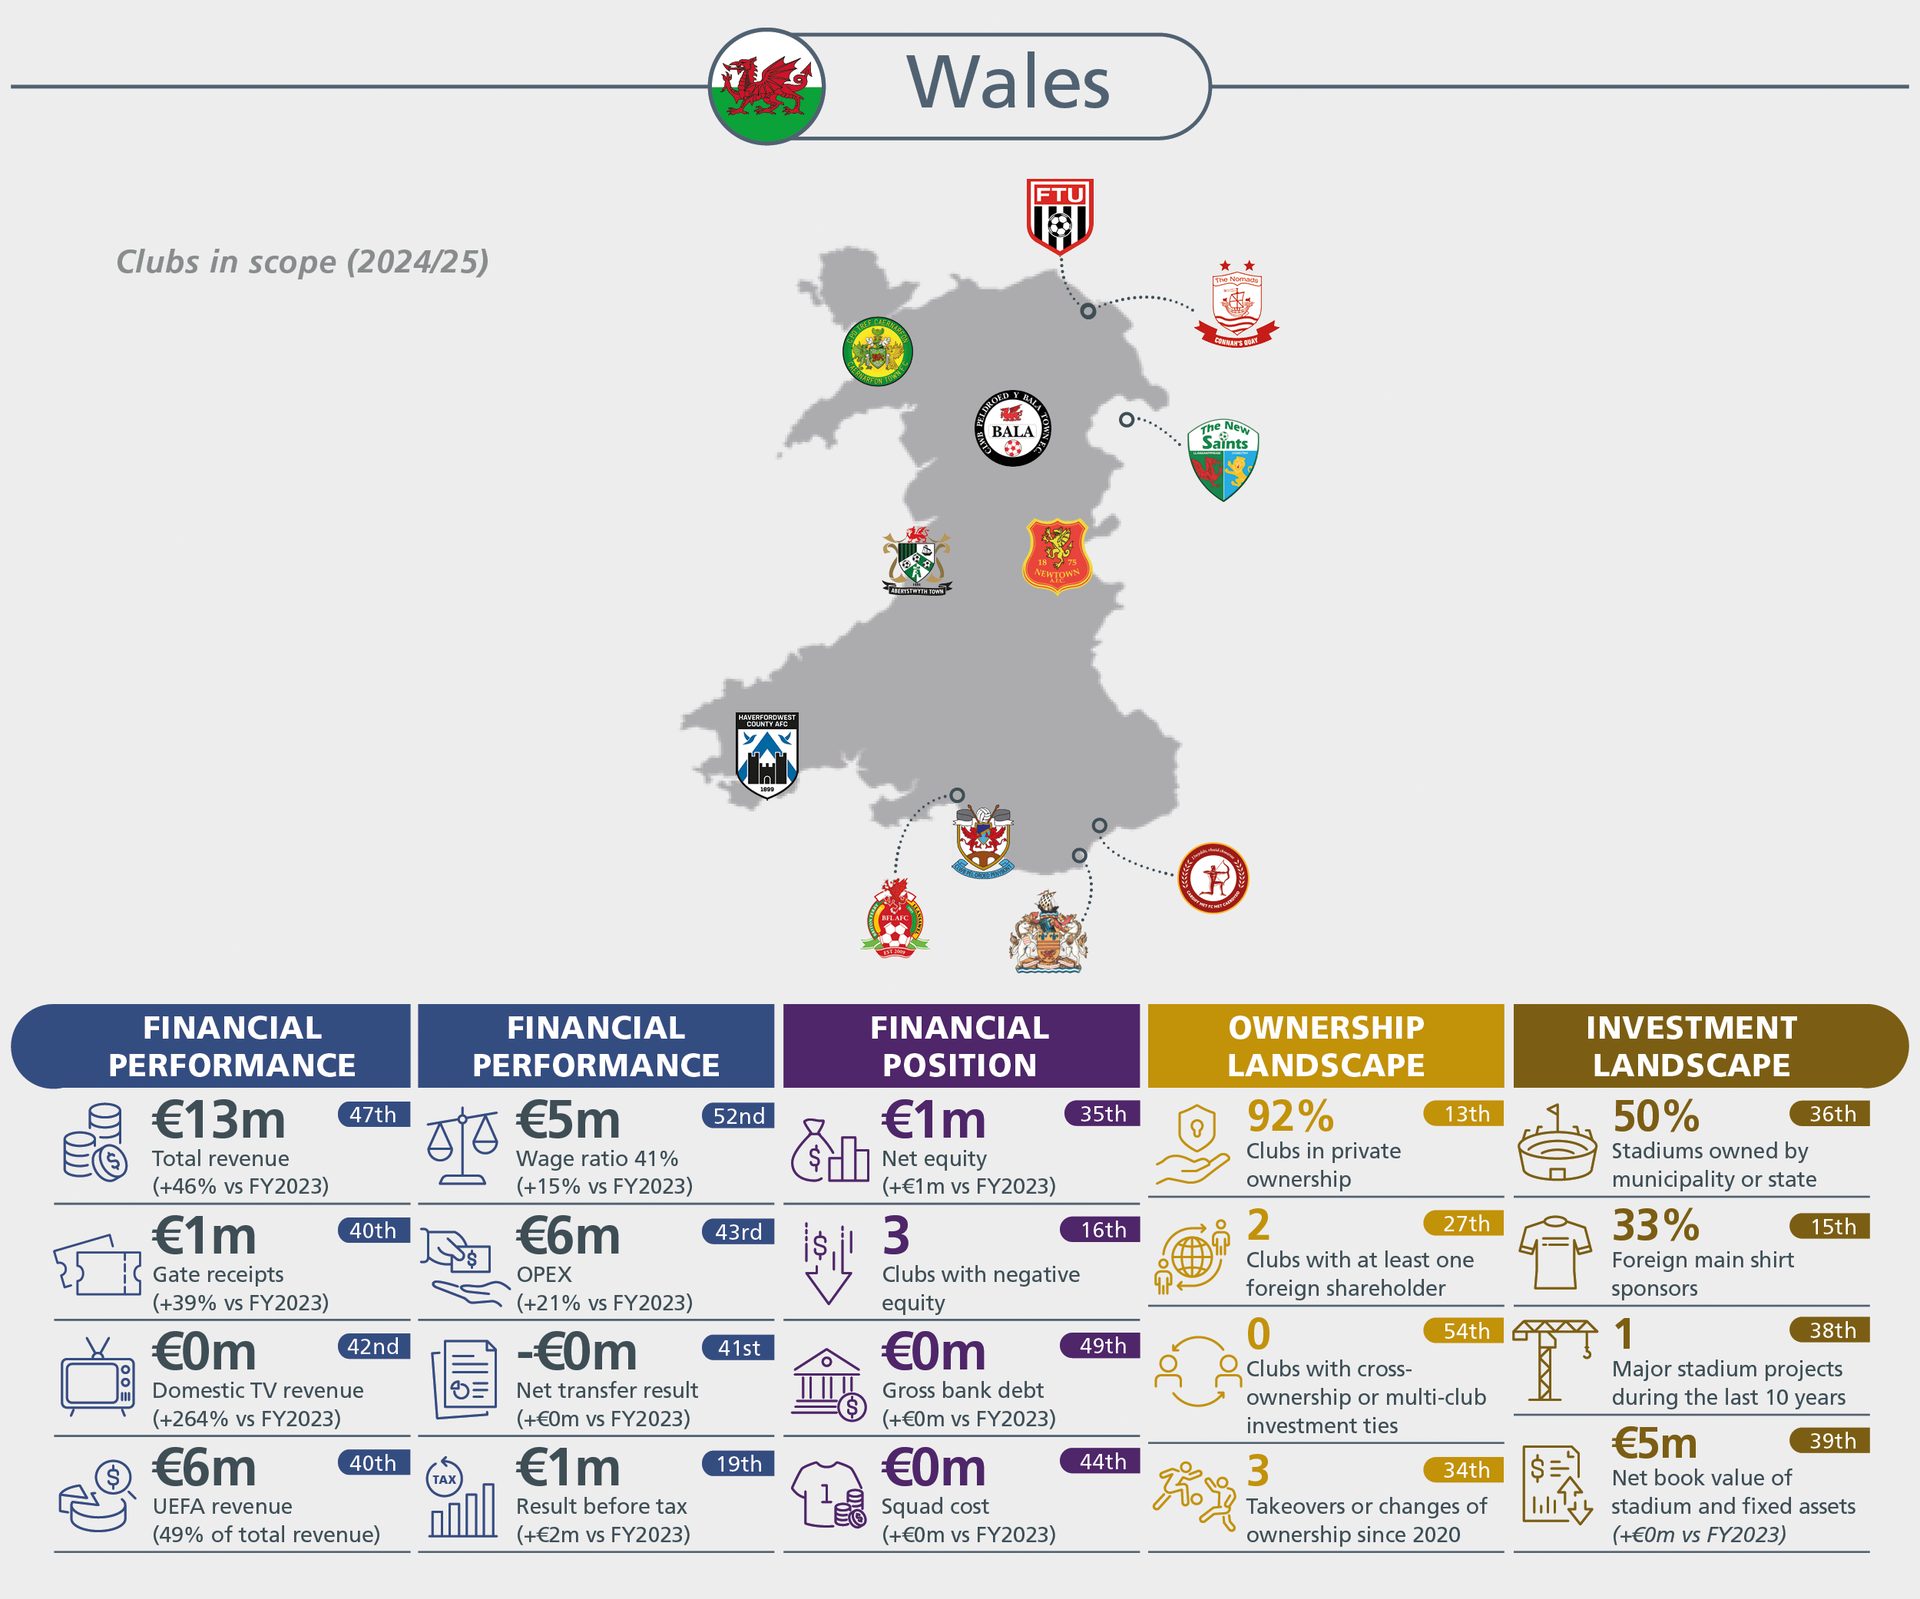
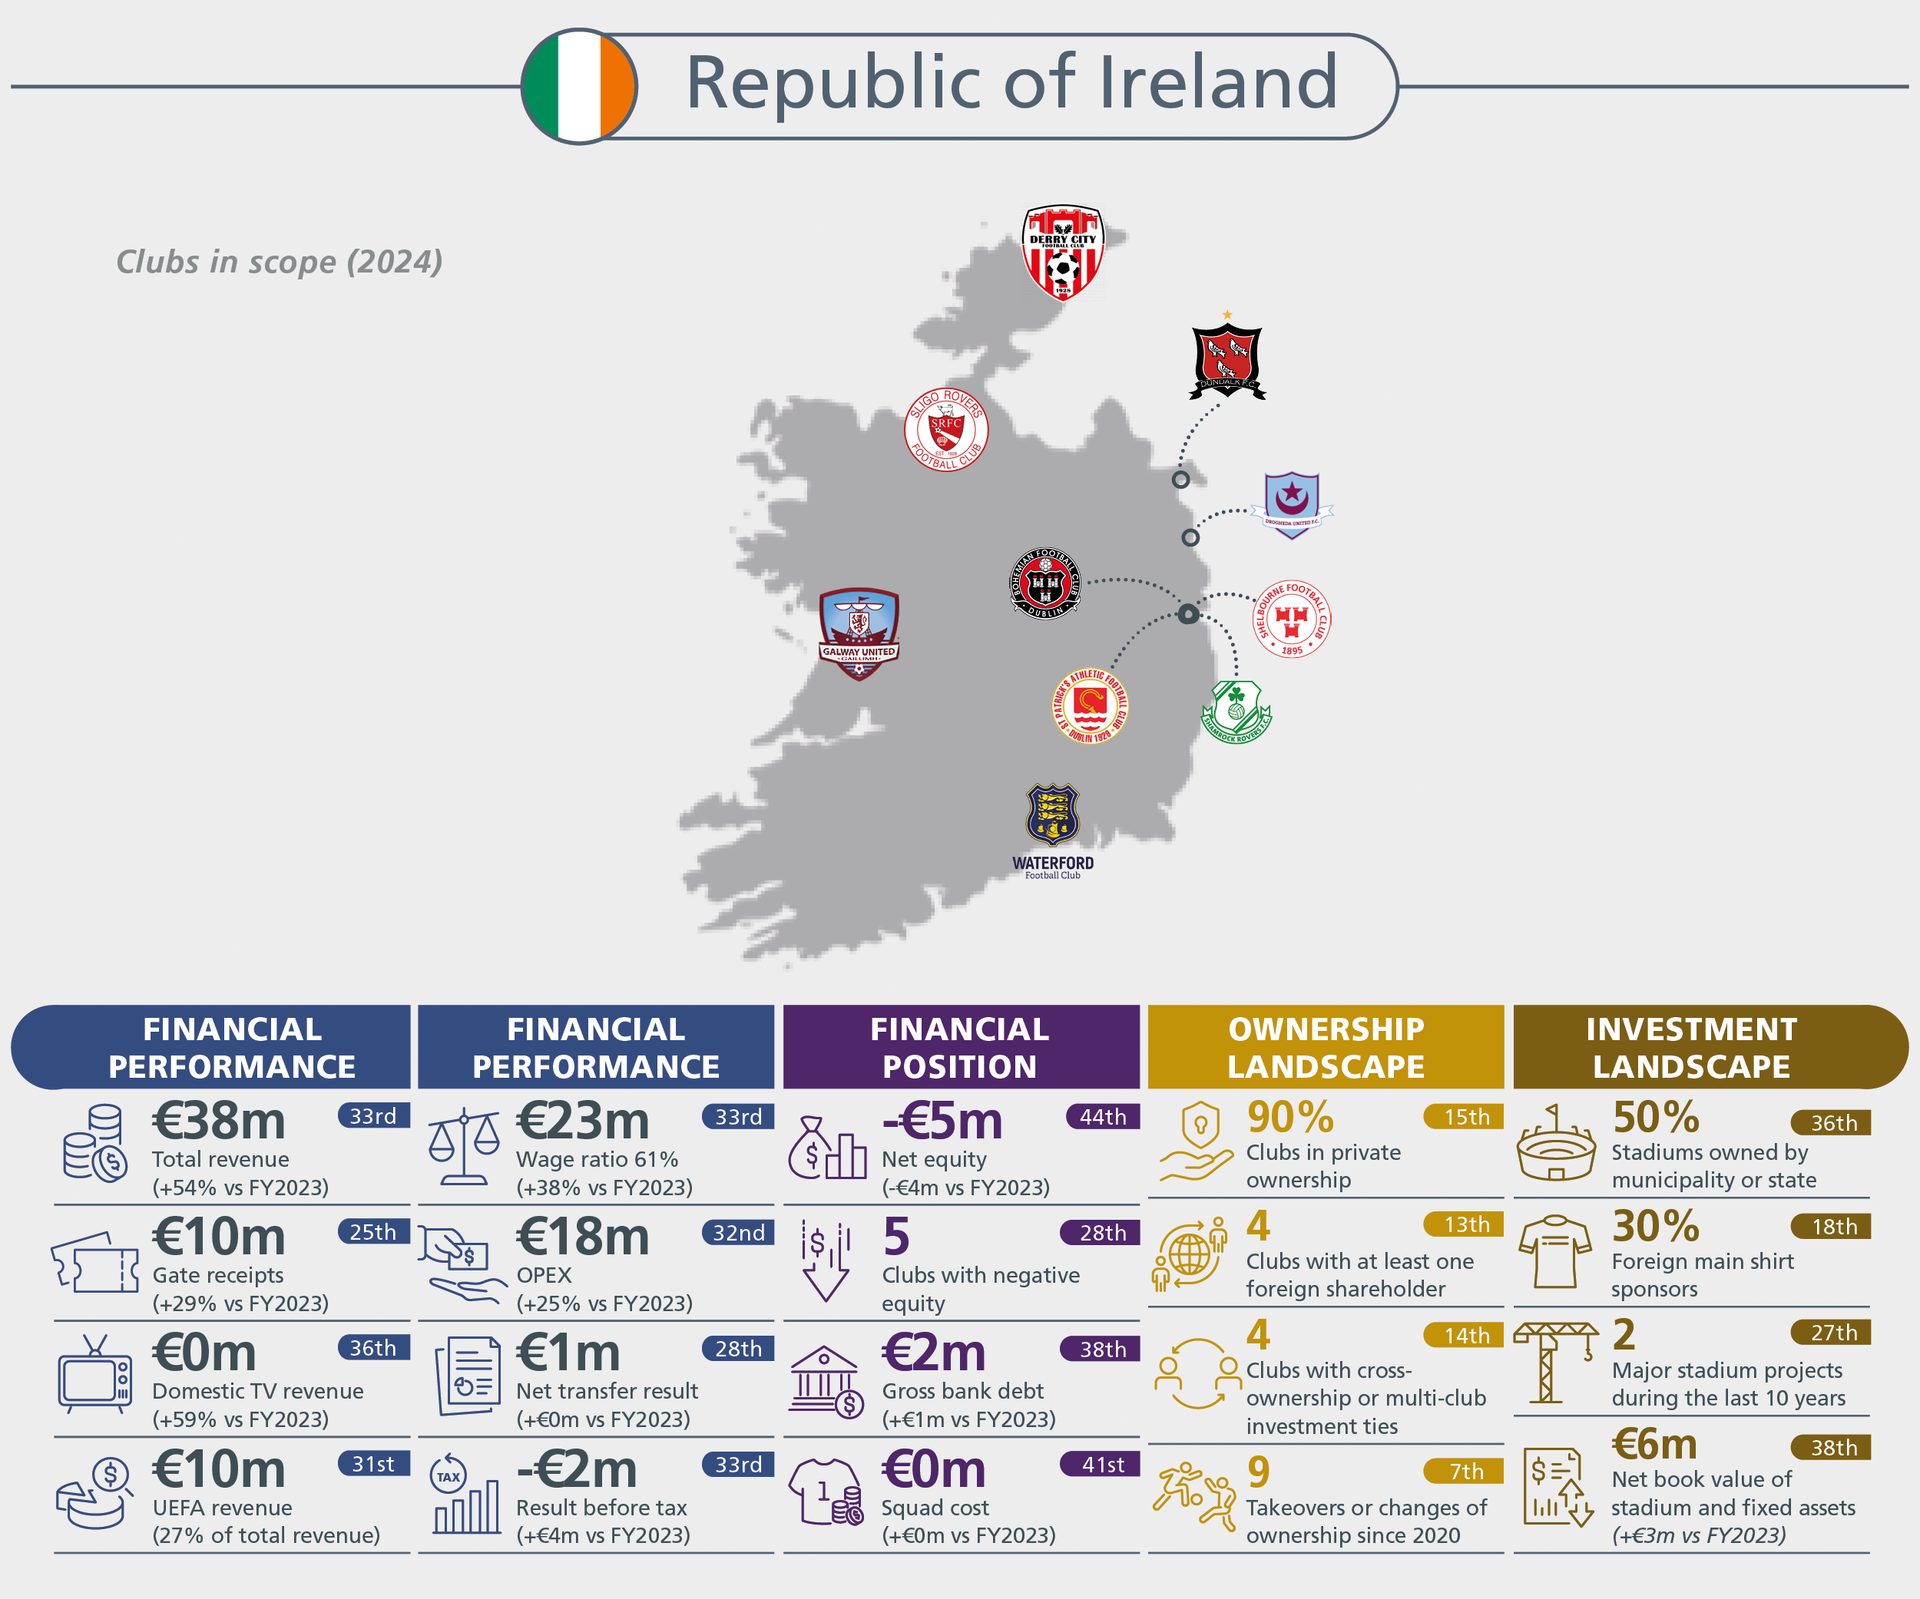
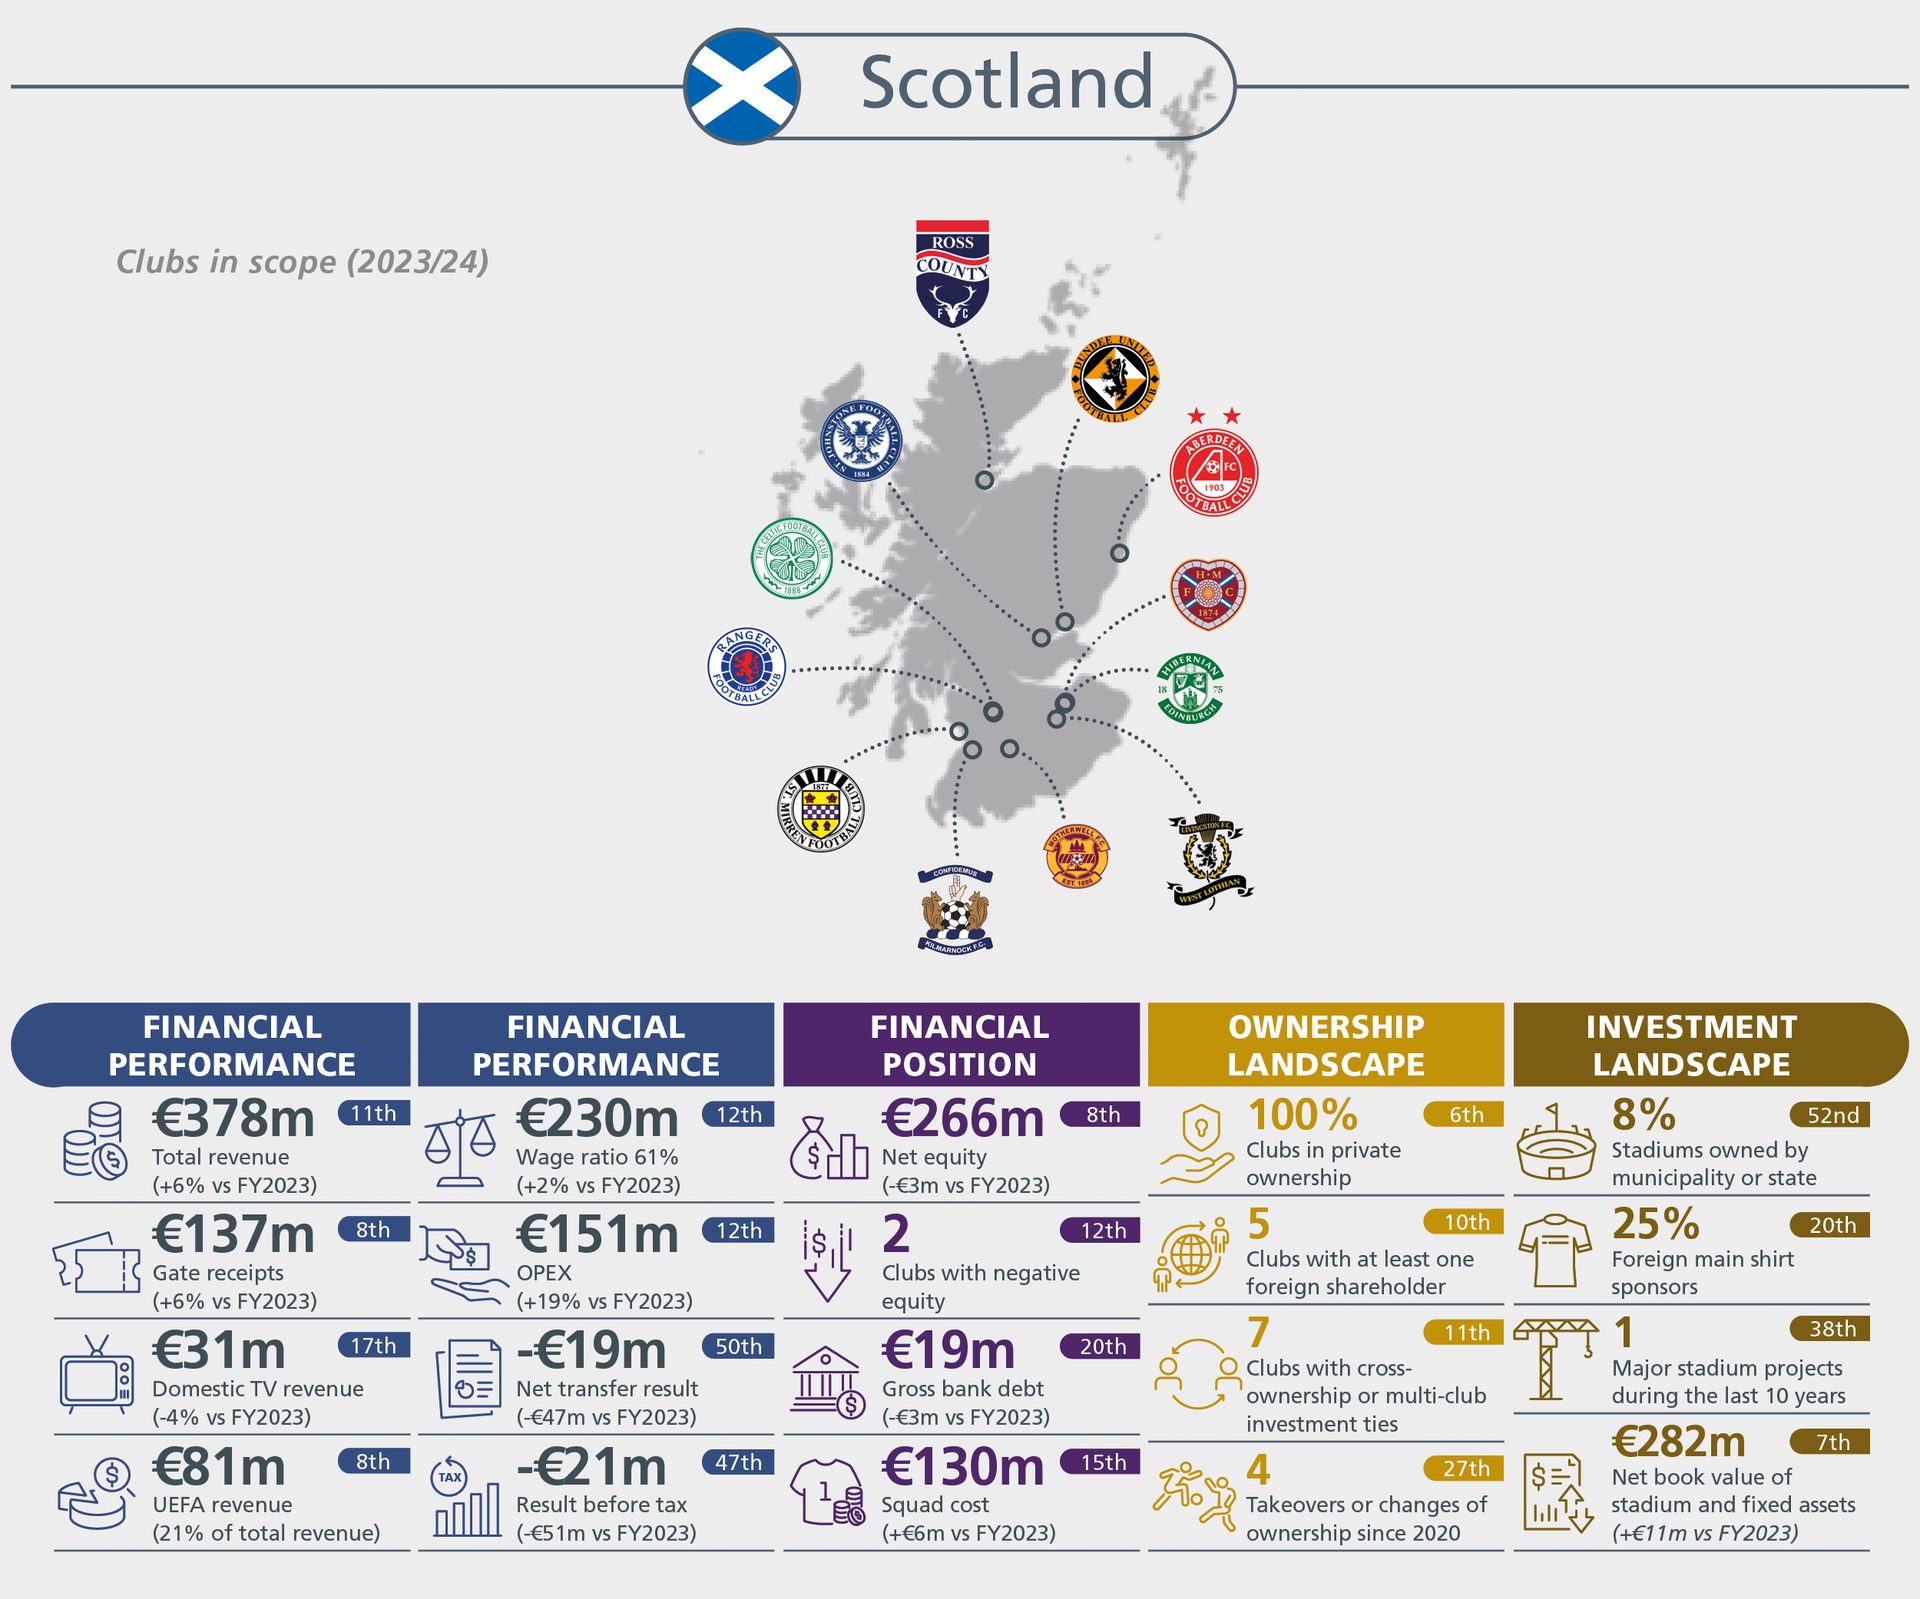
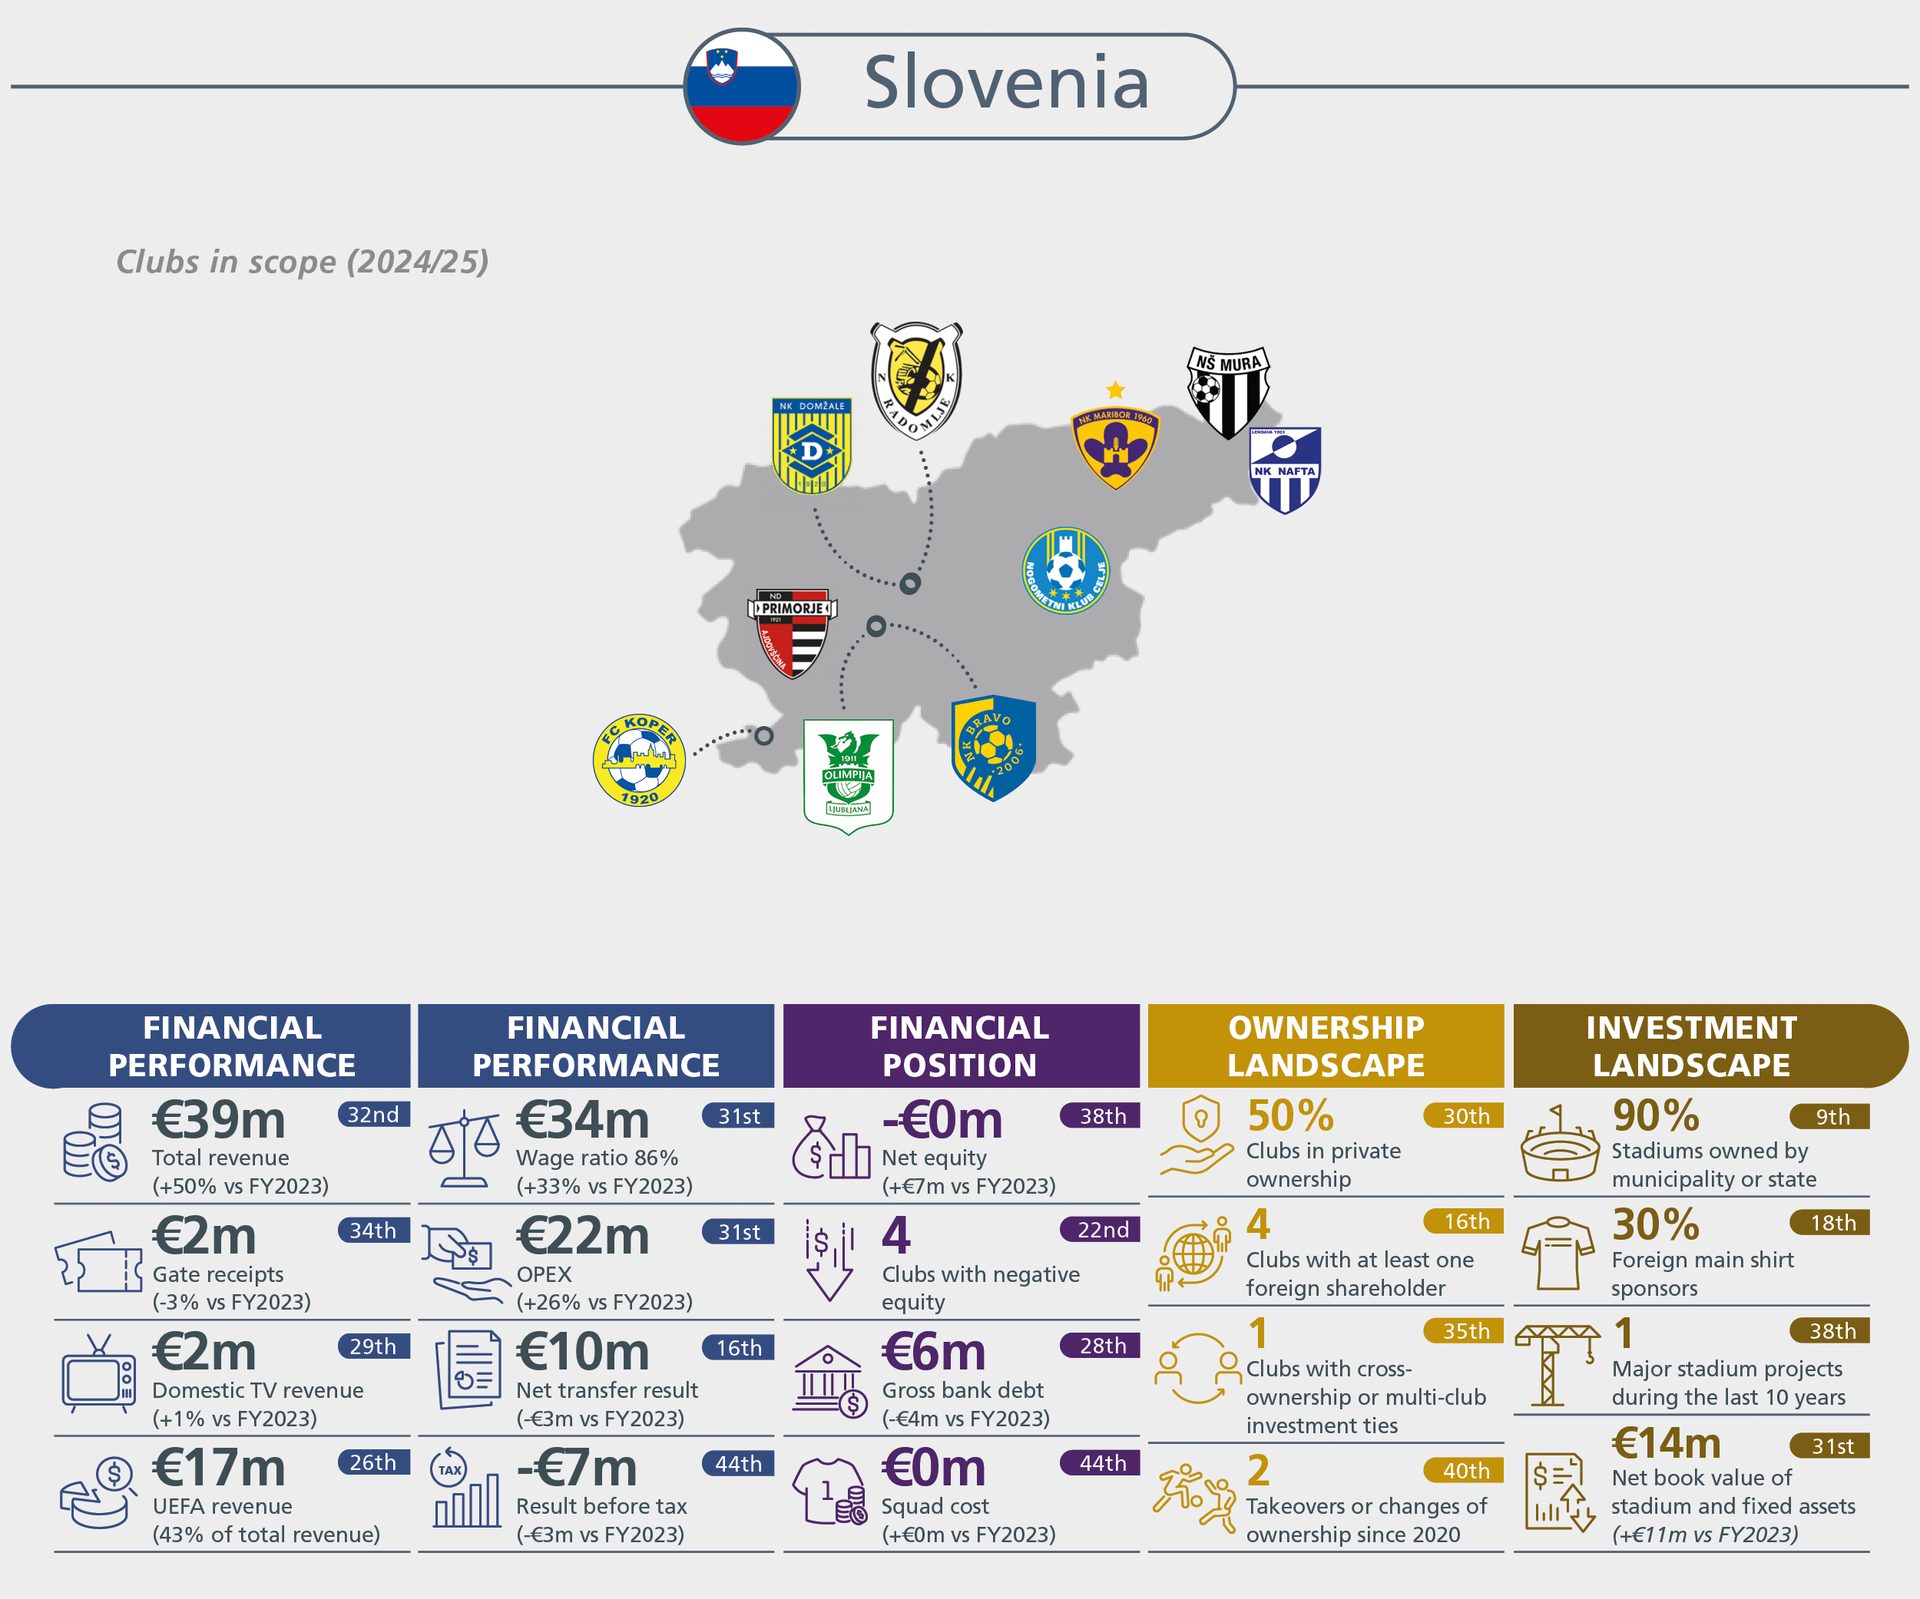
Страновые КПЭ
Отчет охватывает далеко не только крупнейшие клубы и лиги.
В нем проводится ежегодный анализ более чем 700 клубов и представляется комплексная агрегированная картина.
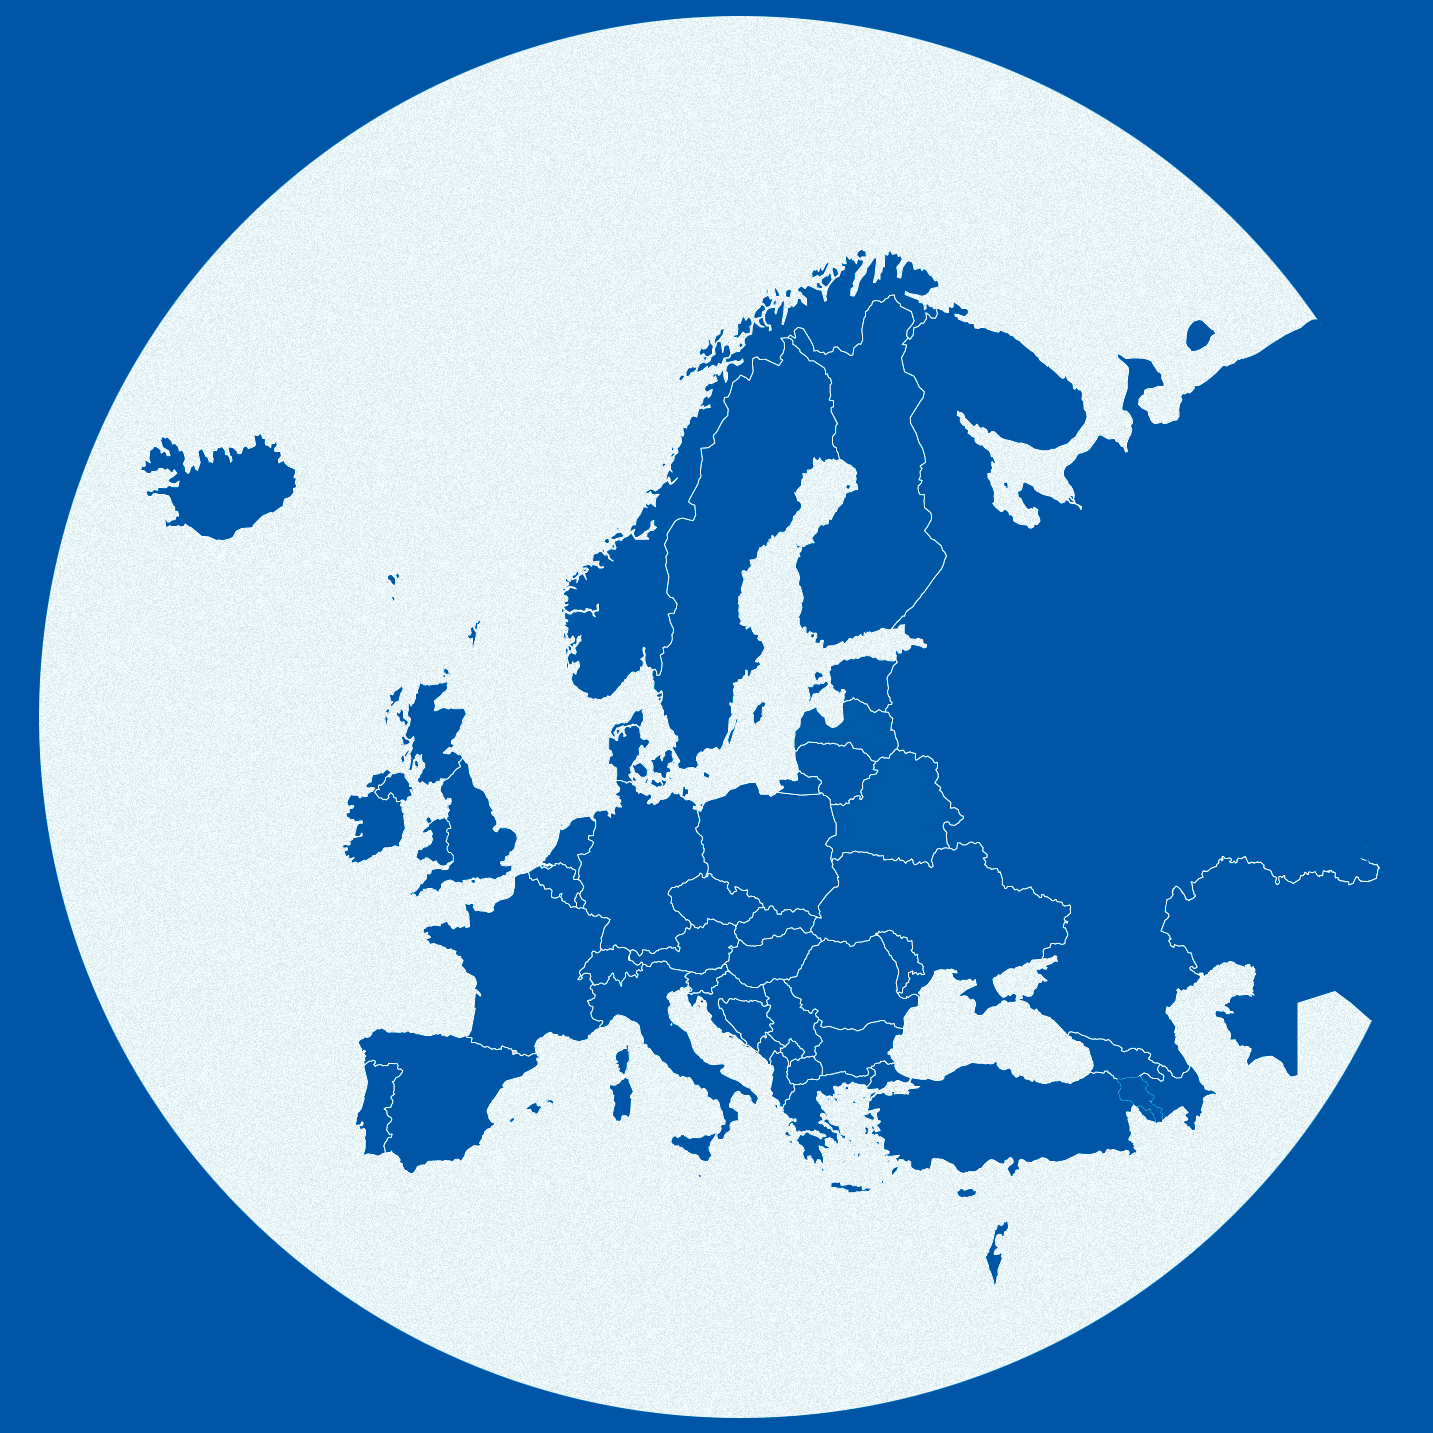
С помощью приведенной ниже карты можно ознакомиться со сравнительными статистическими показателями каждой из стран.