Das Finanz- und Investitionsumfeld im europäischen Klubfußball

Scrollen und entdecken

Hier werden die wichtigsten Erkenntnisse der jüngsten Ausgabe des Berichts präsentiert, der die finanzielle Gesundheit der europäischen Fußballklubs näher beleuchtet.

Ausführliche Analysen, einschließlich der Top-25-Klubs nach den einzelnen finanziellen Messgrößen sowie Daten zu allen 55 UEFA-Mitgliedsverbänden, sind im vollständigen Bericht zu finden.

Tablet displaying a UEFA document, 'The European Club Finance and Investment Landscape', against a modern stadium facade.

Bericht herunterladen

Scrollen und entdecken

Einnahmen der Klubs

Einnahmen der Erstligaklubs dürften 2025

EUR 30 Mrd.

EUR 30 Mrd.

übersteigen

Alle Einnahmequellen wachsen weiter

A blue stylized database icon, depicted as stacked cylindrical layers, symbolizing data storage.

Kommerzielle Einnahmen

1%

Wachstum

Einnahmen aus Ticketverkauf

1%

Wachstum

Einnahmen aus TV-Rechten

1%

Wachstum

Auch die Einnahmen aus UEFA-Zahlungen

sind deutlich gestiegen

EUR 880 Mio.

erwartetes Wachstum

Einnahmen der Klubs

Top-25-Klubs

17

meldeten einen Rekord bei den kommerziellen Einnahmen im Jahr 2025

12

meldeten einen Anstieg der kommerziellen Einnahmen von über 10 % im Vergleich zum Vorjahr

Der vollständige Bericht enthält 12 Klubvergleiche, darunter die Gesamteinnahmen, Spielergehälter und kumulierte Ablösesummen der Kader.

25

24

23

22

21

20

19

18

17

16

15

14

13

12

11

10

9

8

7

6

5

4

3

2

1

74

80

80

81

83

90

122

123

124

138

141

158

159

162

223

237

298

313

349

382

384

402

426

499

568

Kommerzielle Einnahmen 2025 (EUR Mio.)

Hinter diesen positiven Zahlen verbirgt sich aber eine etwas differenziertere Geschichte

Die Qualität der Einnahmequellen variiert. Das Einnahmenwachstum ist vor allem auf personal- und ressourcenintensive Quellen wie Merchandising, Lizenzierung, Premium-Tickets und andere Veranstaltungen in Stadien zurückzuführen.

Diversifizierung ist zwar begrüßenswert, aber solche Einnahmequellen sind oft mit Mehrkosten verbunden und auf lange Sicht schwerer zu gewährleisten.

Kosten der Klubs

Der Anstieg bei den nicht gehaltsbezogenen Betriebskosten ist erneut höher als das Einnahmenwachstum.

Sie machen nun 36 % der Klubeinnahmen aus – der höchste Anteil der vergangenen 15 Jahre.

Auch die nicht spielerbezogenen Gehaltskosten stiegen an, und zwar um 8 %. Dies ist auf eine höhere Anzahl von Vollzeitäquivalenten und einem generellen Anstieg der Gehälter zurückzuführen.

Seit der Pandemie sind die Finanzierungskosten um mehr als 50 % gestiegen.

Die Vereine verwalten ihre wichtigsten Vermögenswerte – die Spieler – besser als in der Vergangenheit.

Die Spielergehälter stiegen 2025 um lediglich 1,8 %.

Die Klubs managen die Spielerverträge besser, um Verluste zu vermeiden.

Die Erfassung von über 4 000 Spielern ergab, dass nur 3-4 % des Vermögenswerts als ablösefreie Transfers gelten.

In 5 der Top-20-Ligen, darunter Frankreich und Spanien, sanken die Spielergehaltskosten sogar.

Five stylized purple Euro banknotes scattered on a light background.

Herausfordernde Trends

Kosten der Klubs

Profitabilität

Aufgrund dieses Kostendrucks führen Rekordeinnahmen und Transfergewinne nicht automatisch zu Profitabilität.

Klicken, um mehr über die Profitabilität der Klubs zu erfahren

2024 wurden Rekord-Transfereinnahmen von

EUR 3,3 Mrd.

verzeichnet

Außerdem...

sind die Nettotransferkosten deutlich gesunken

von

EUR 1,1 Mrd.

2023

EUR 1,1 Mrd.

auf

2024

Dennoch gehen die erheblichen Verluste weiter.

Die Verluste vor Steuern der Erstligaklubs verringerten sich 2024 nur leicht

VON

2023

EUR 1,2 Mrd.
EUR 1,2 Mrd.

AUF

2024

Das Gesamtbild verbessert sich jedoch.

Anteil der Erstligaklubs mit Gewinnen vor Steuern:

25%

2021

26%

2022

30%

2023

38%

2024

50%

2025*

Profitabilität

* früh berichtende Klubs

Anteil der Erstligaklubs mit Gewinnen vor Steuern in den Top-20-Ligen

Klubs mit Gewinnen

Klubs mit Verlusten

Anteil der Erstligaklubs mit Gewinnen vor Steuern in den Top-20-Ligen

Investitionen

Das Interesse der Investoren am europäischen Fußball hält an, wobei sich die Dynamik verschoben hat.

Die Übernahmen von Erstligaklubs haben sich nach den Rekordzahlen während der Pandemie stabilisiert.

Investoren richten ihre Aufmerksamkeit vermehrt auf Zweitligisten und Minderheitsbeteiligungen.

20

Erwerb beherrschender Anteile bei 29 europäischen Erstligaklubs 2025

2

Neun neue US-Mehrheitsinvestoren bei Erstligaklubs 2025

104

Insgesamt wurden 2025 in Europa 111 Deals verzeichnet

Auch Kapitalzuschüsse und Investitionen in Infrastruktur sind auf Rekordniveau.

Investitionen

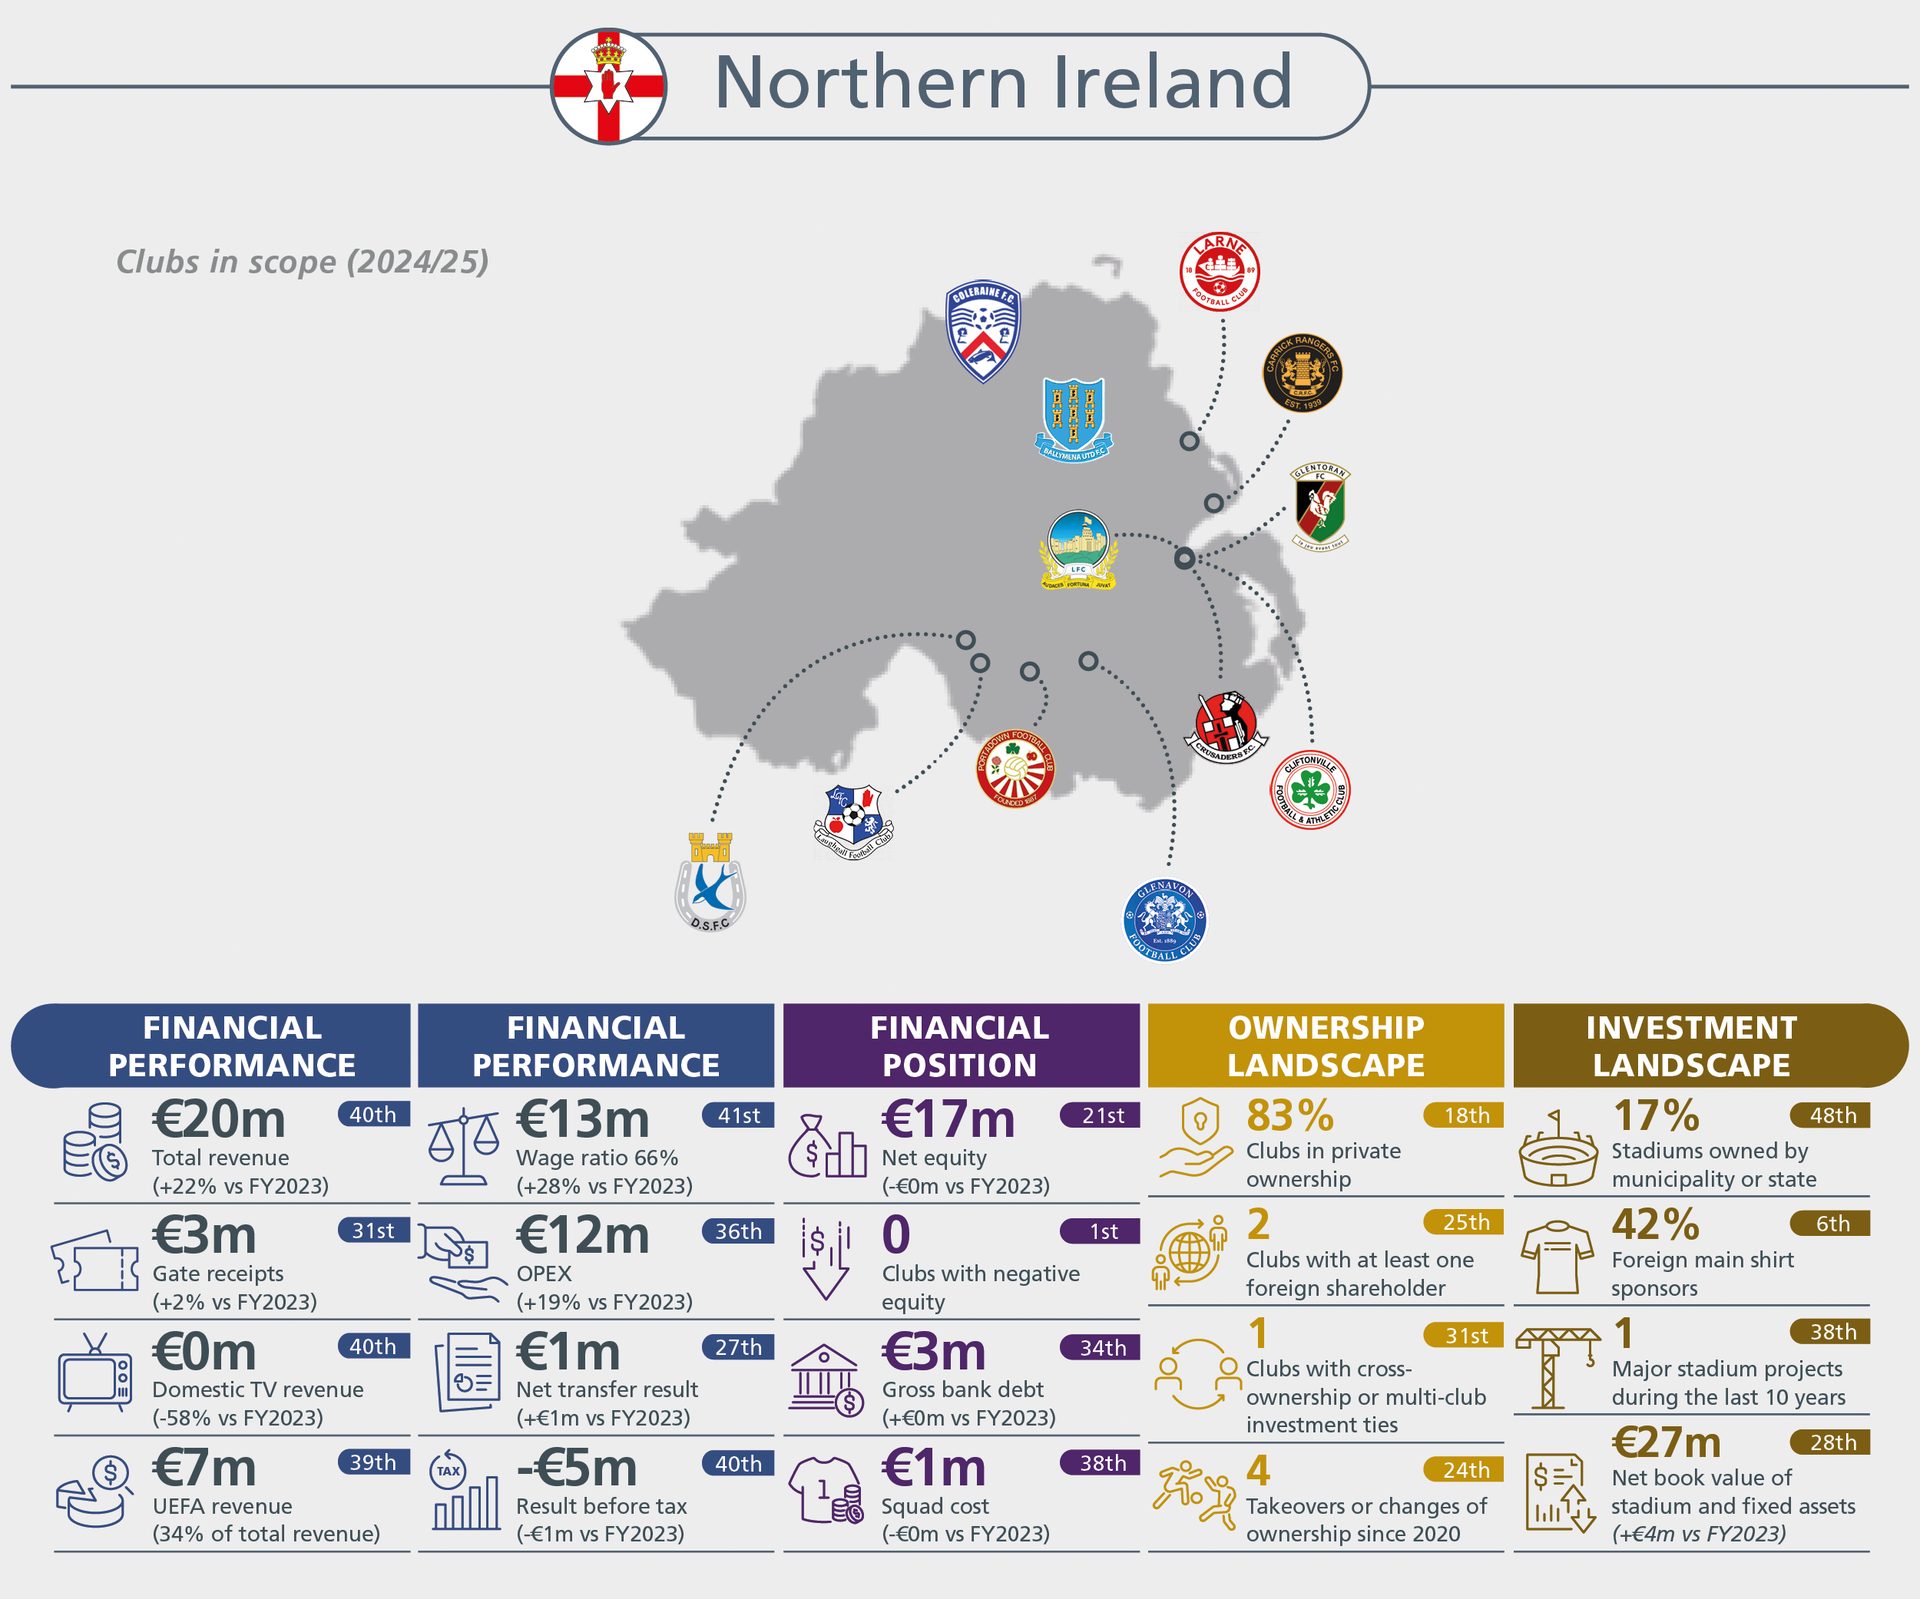
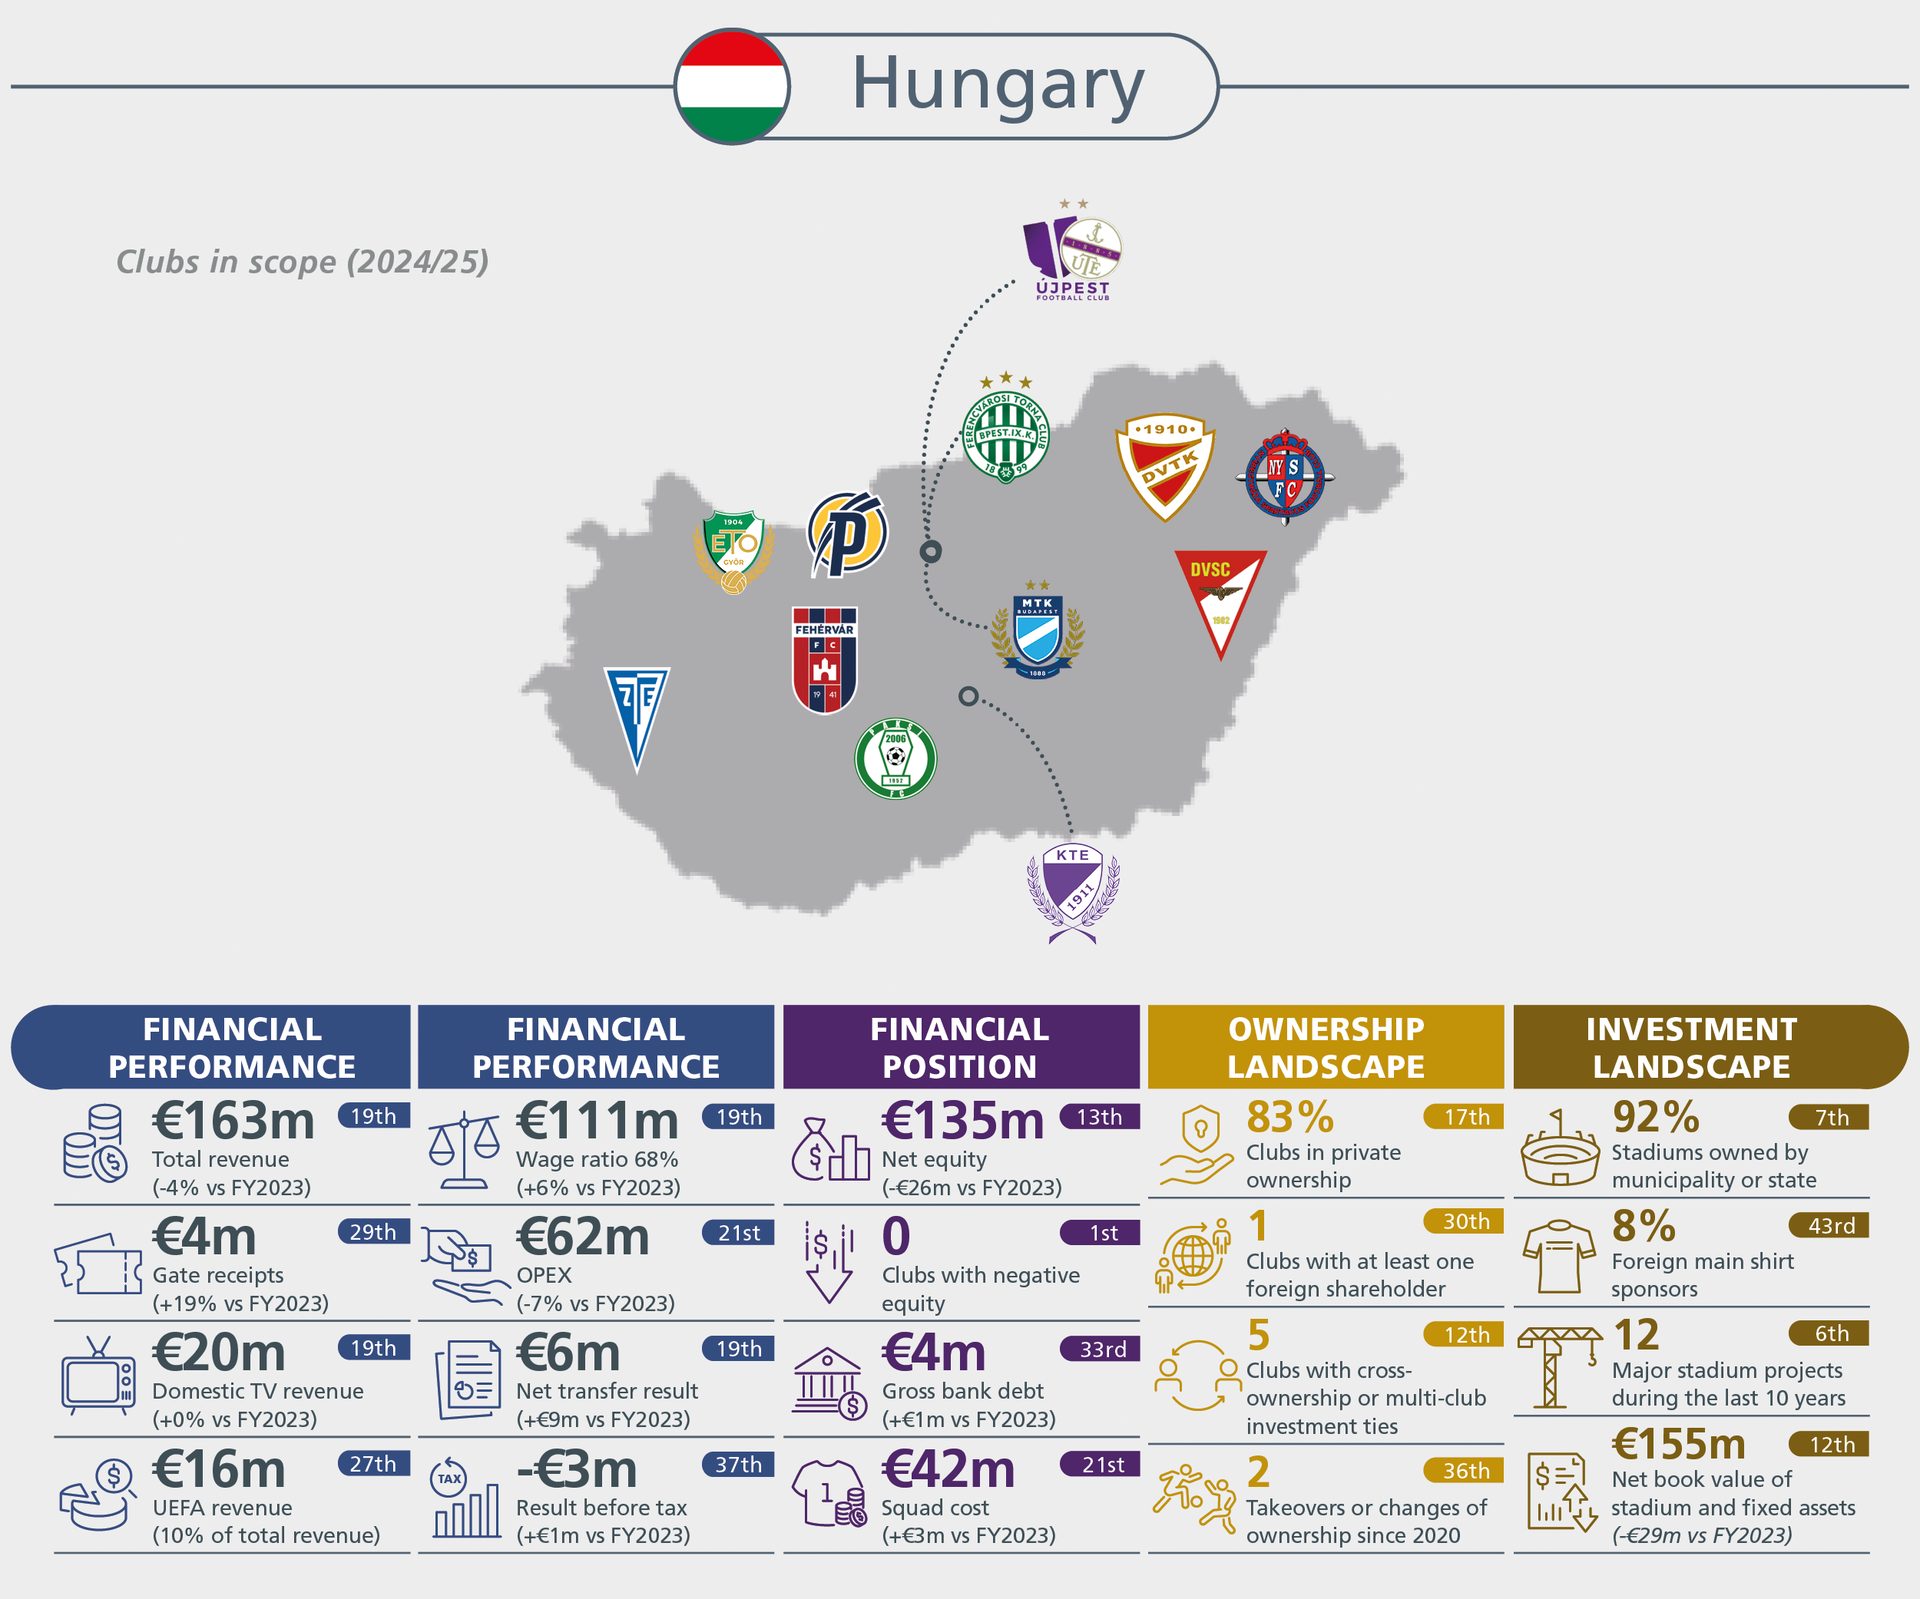
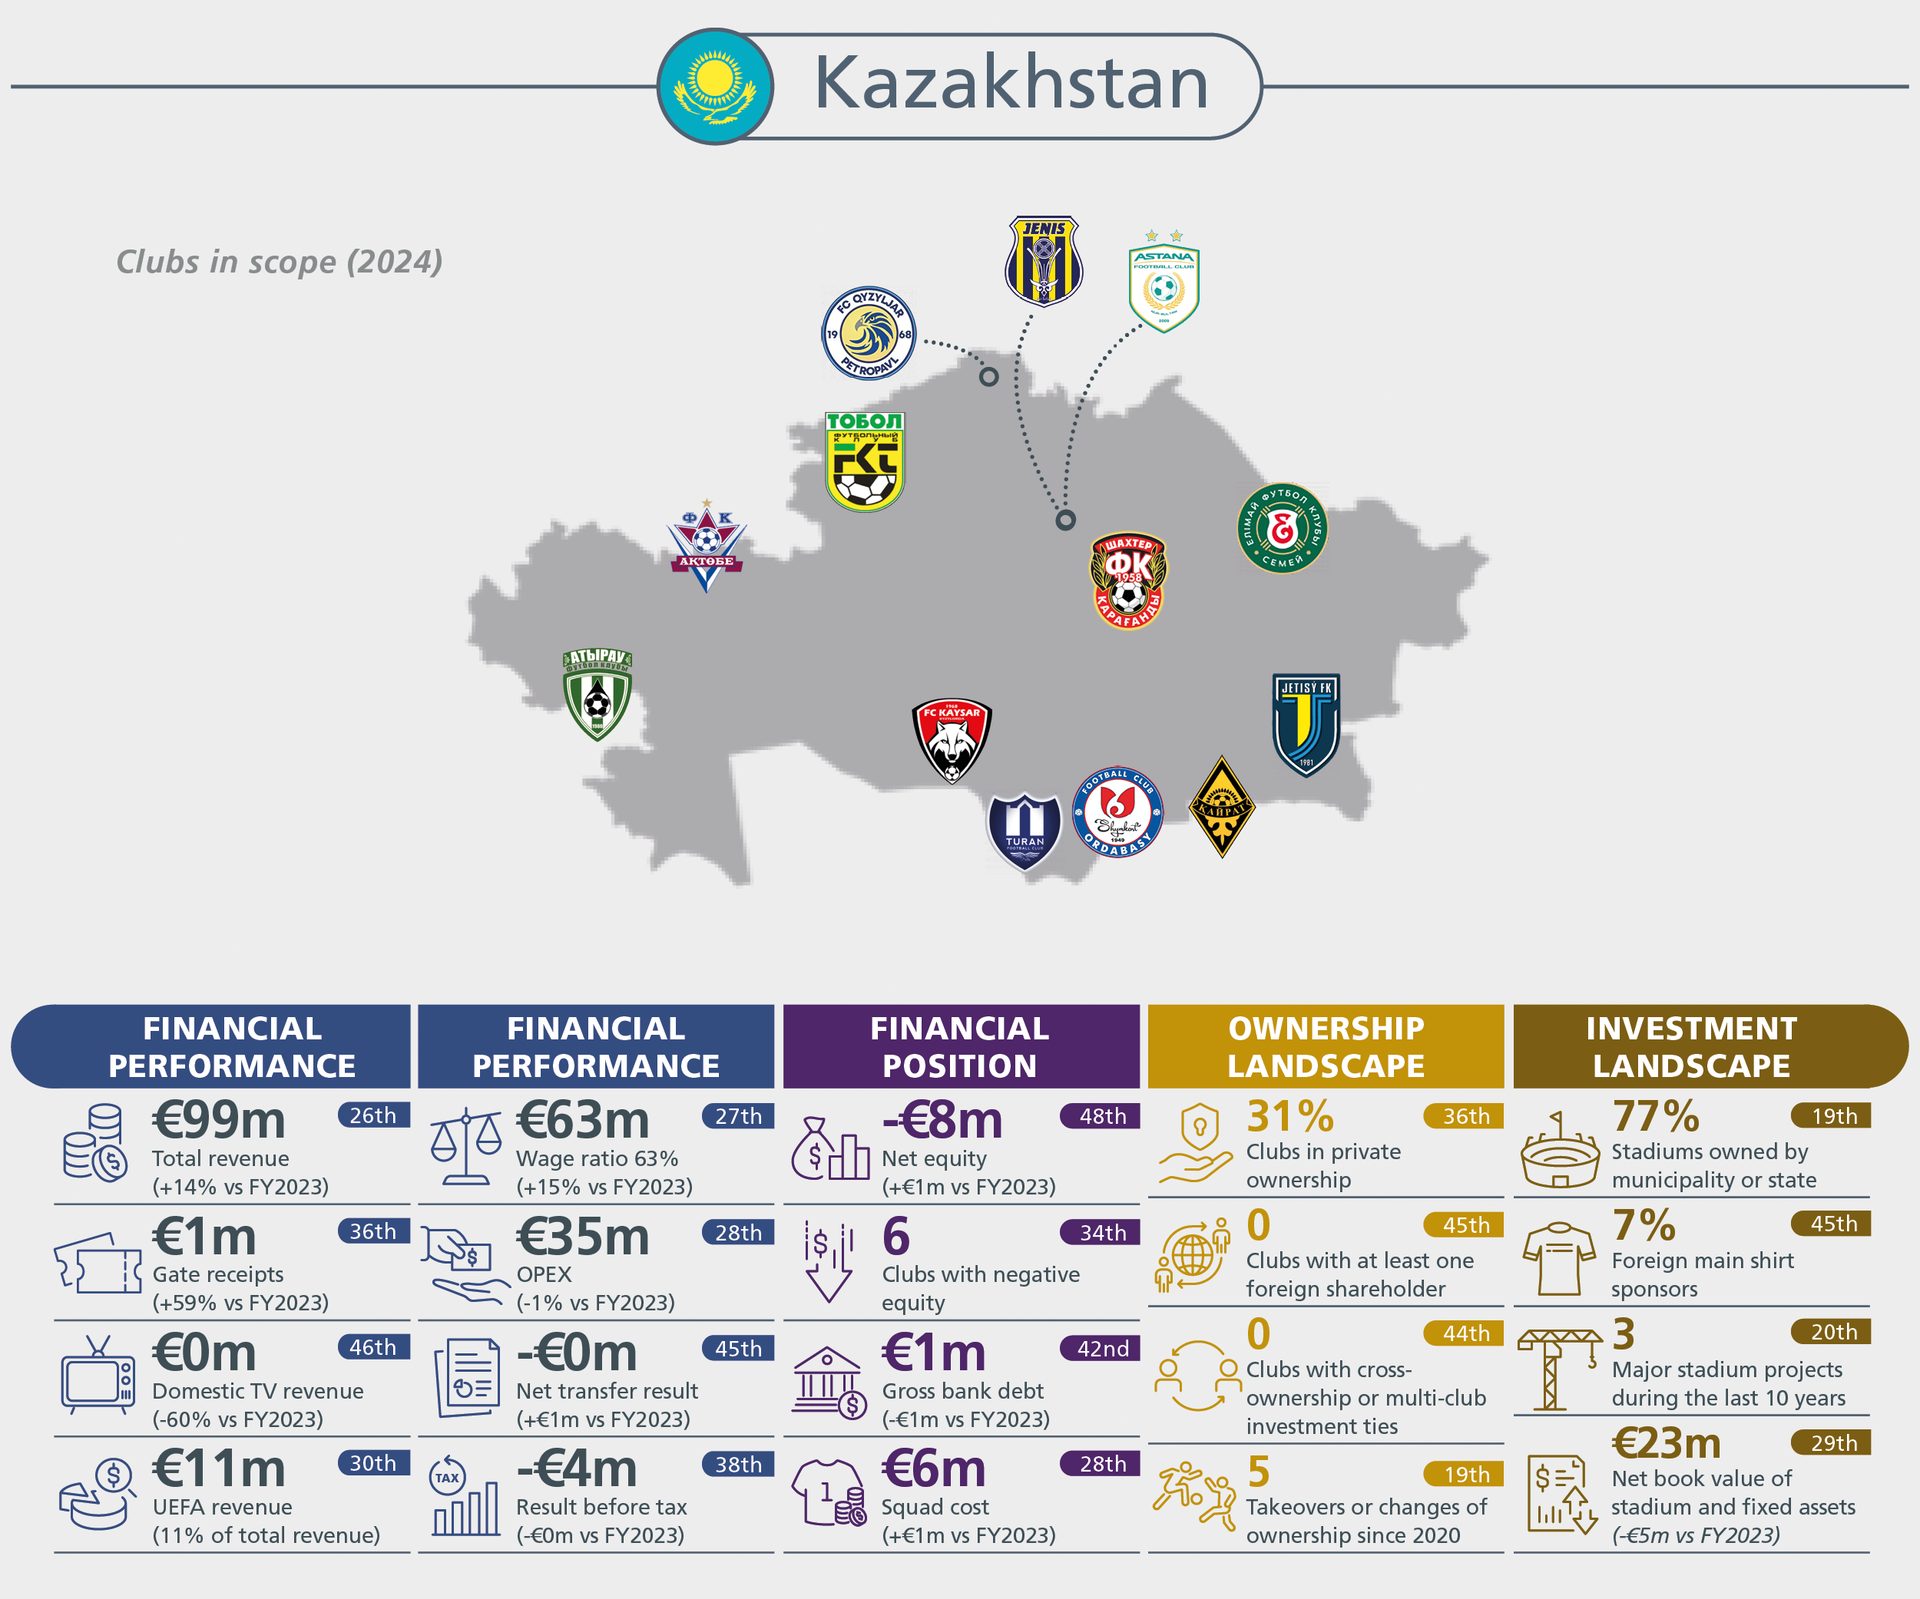
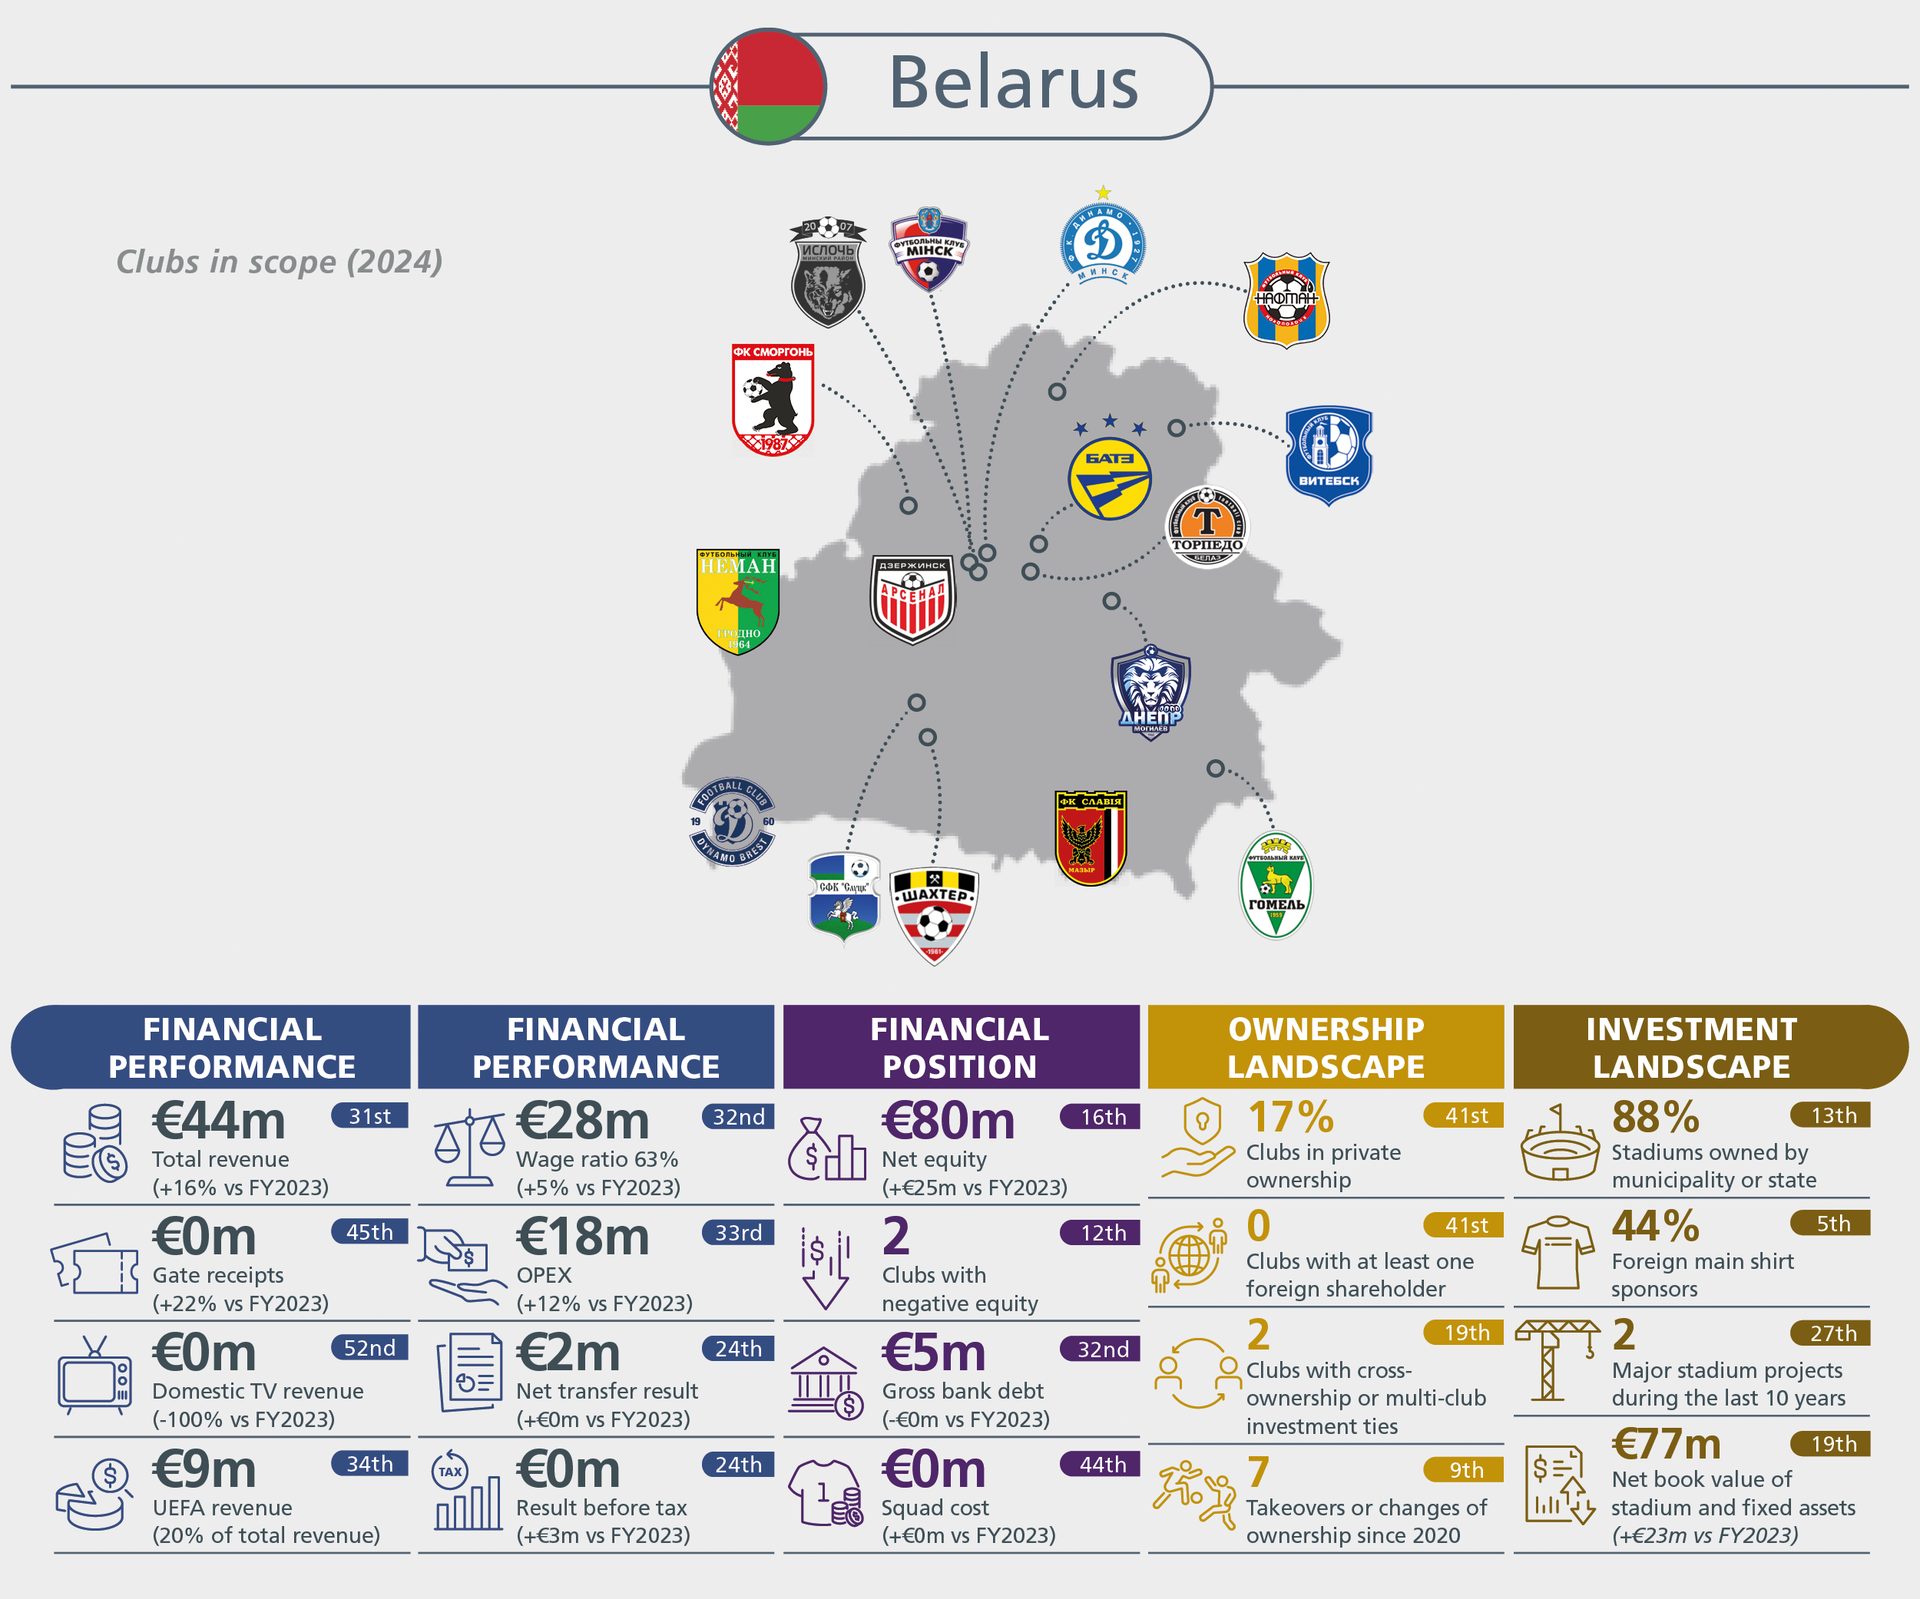
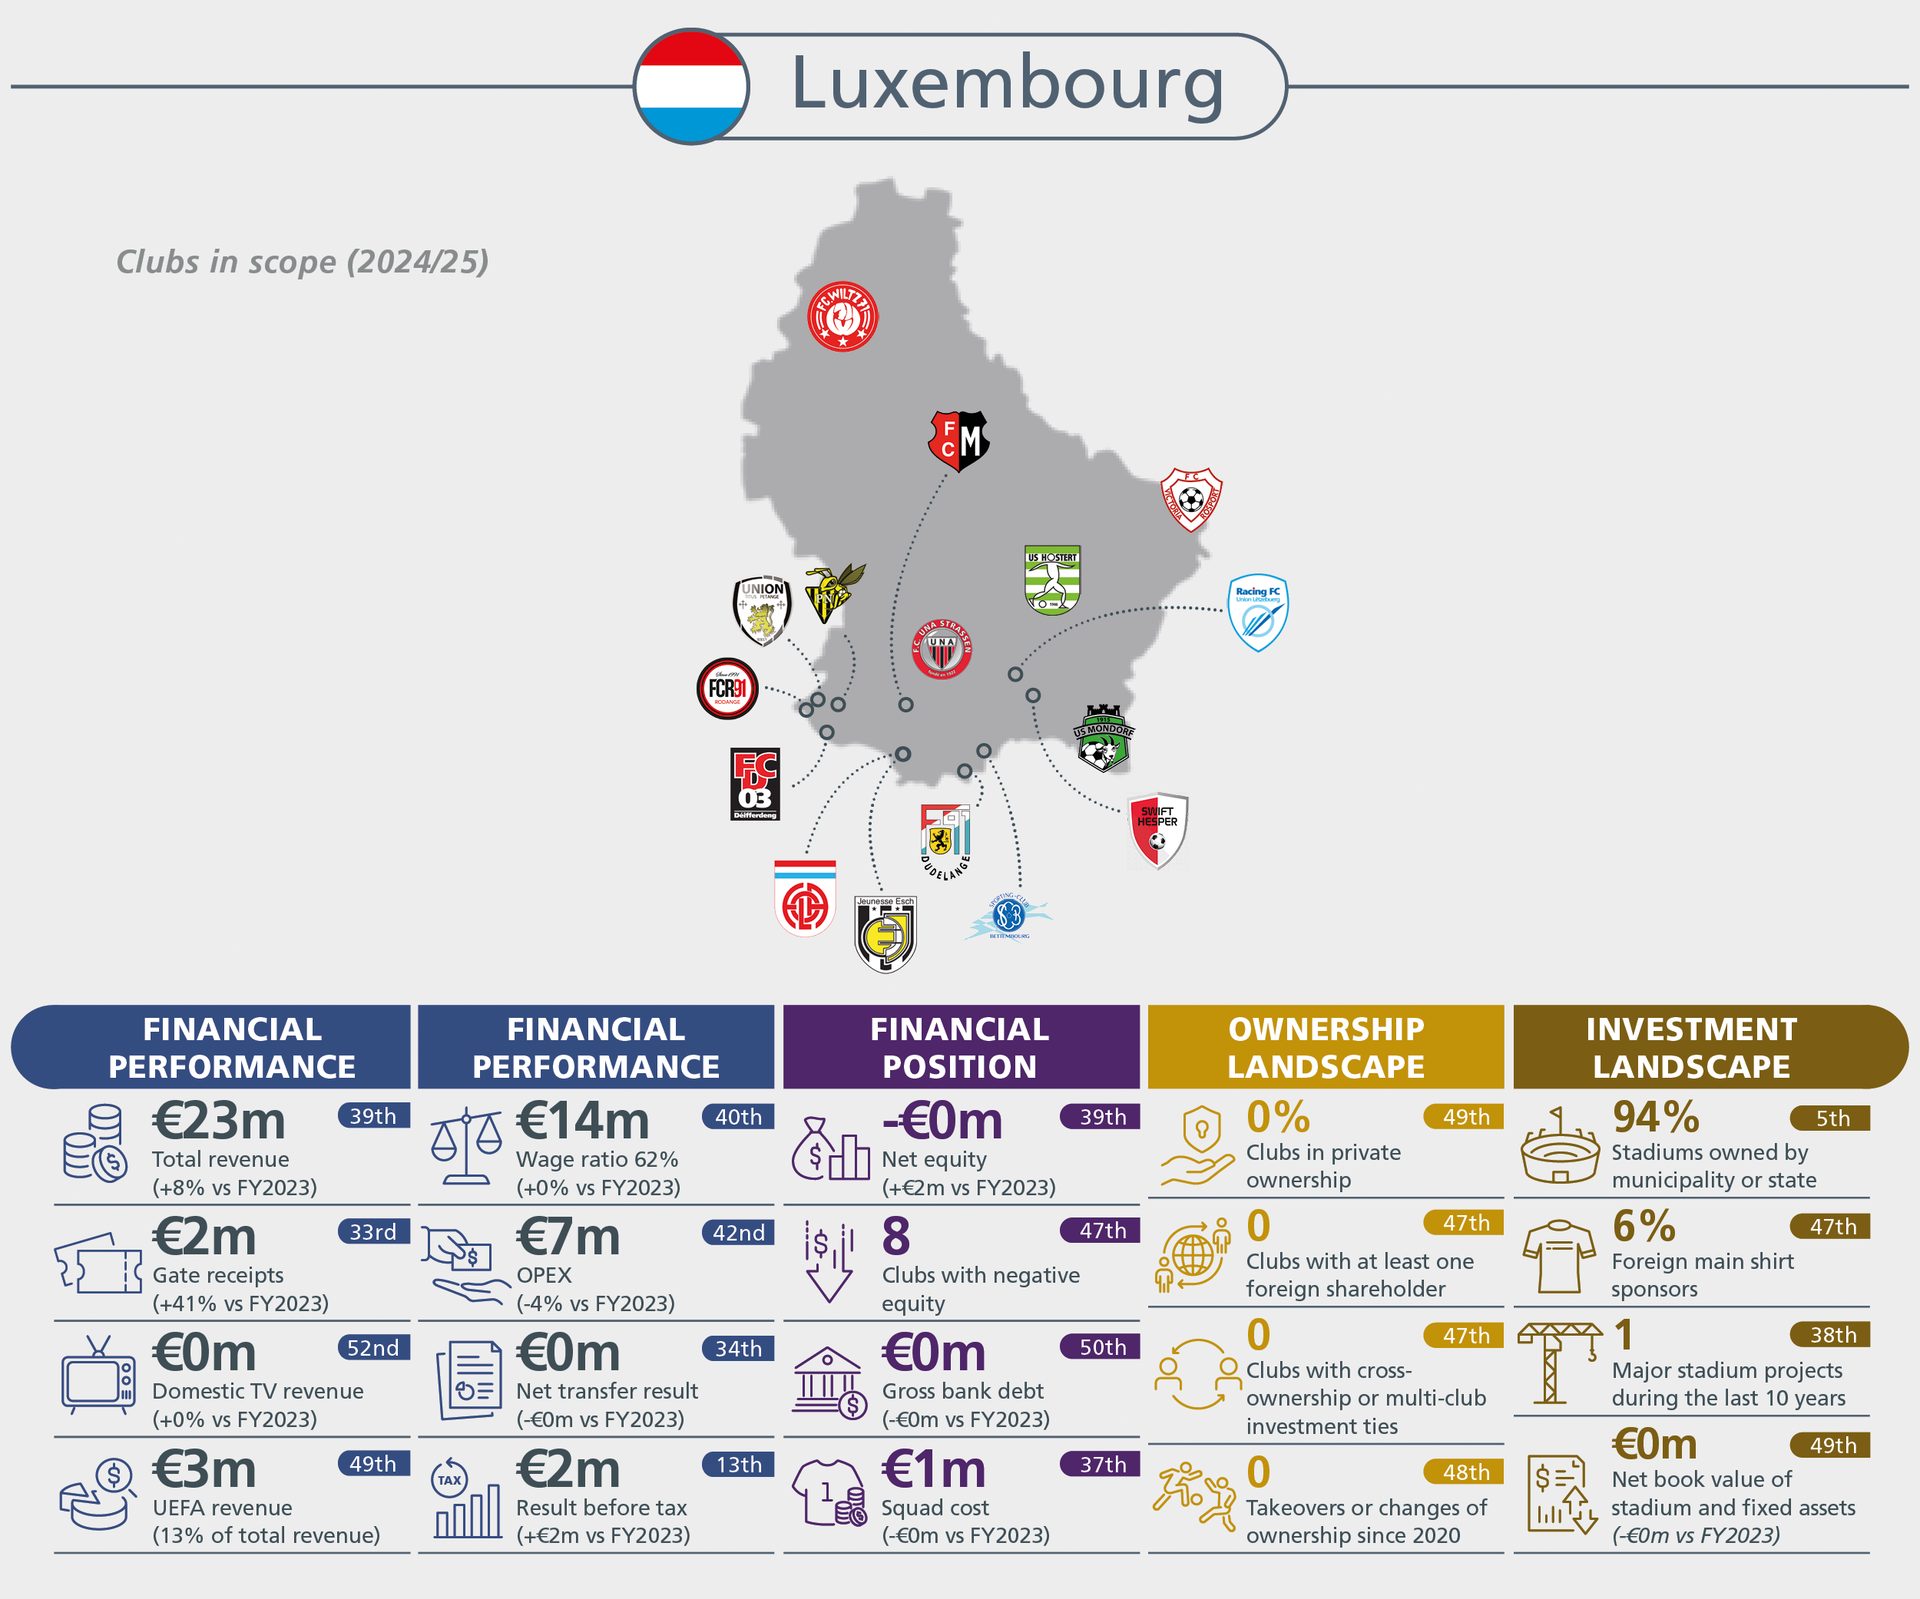
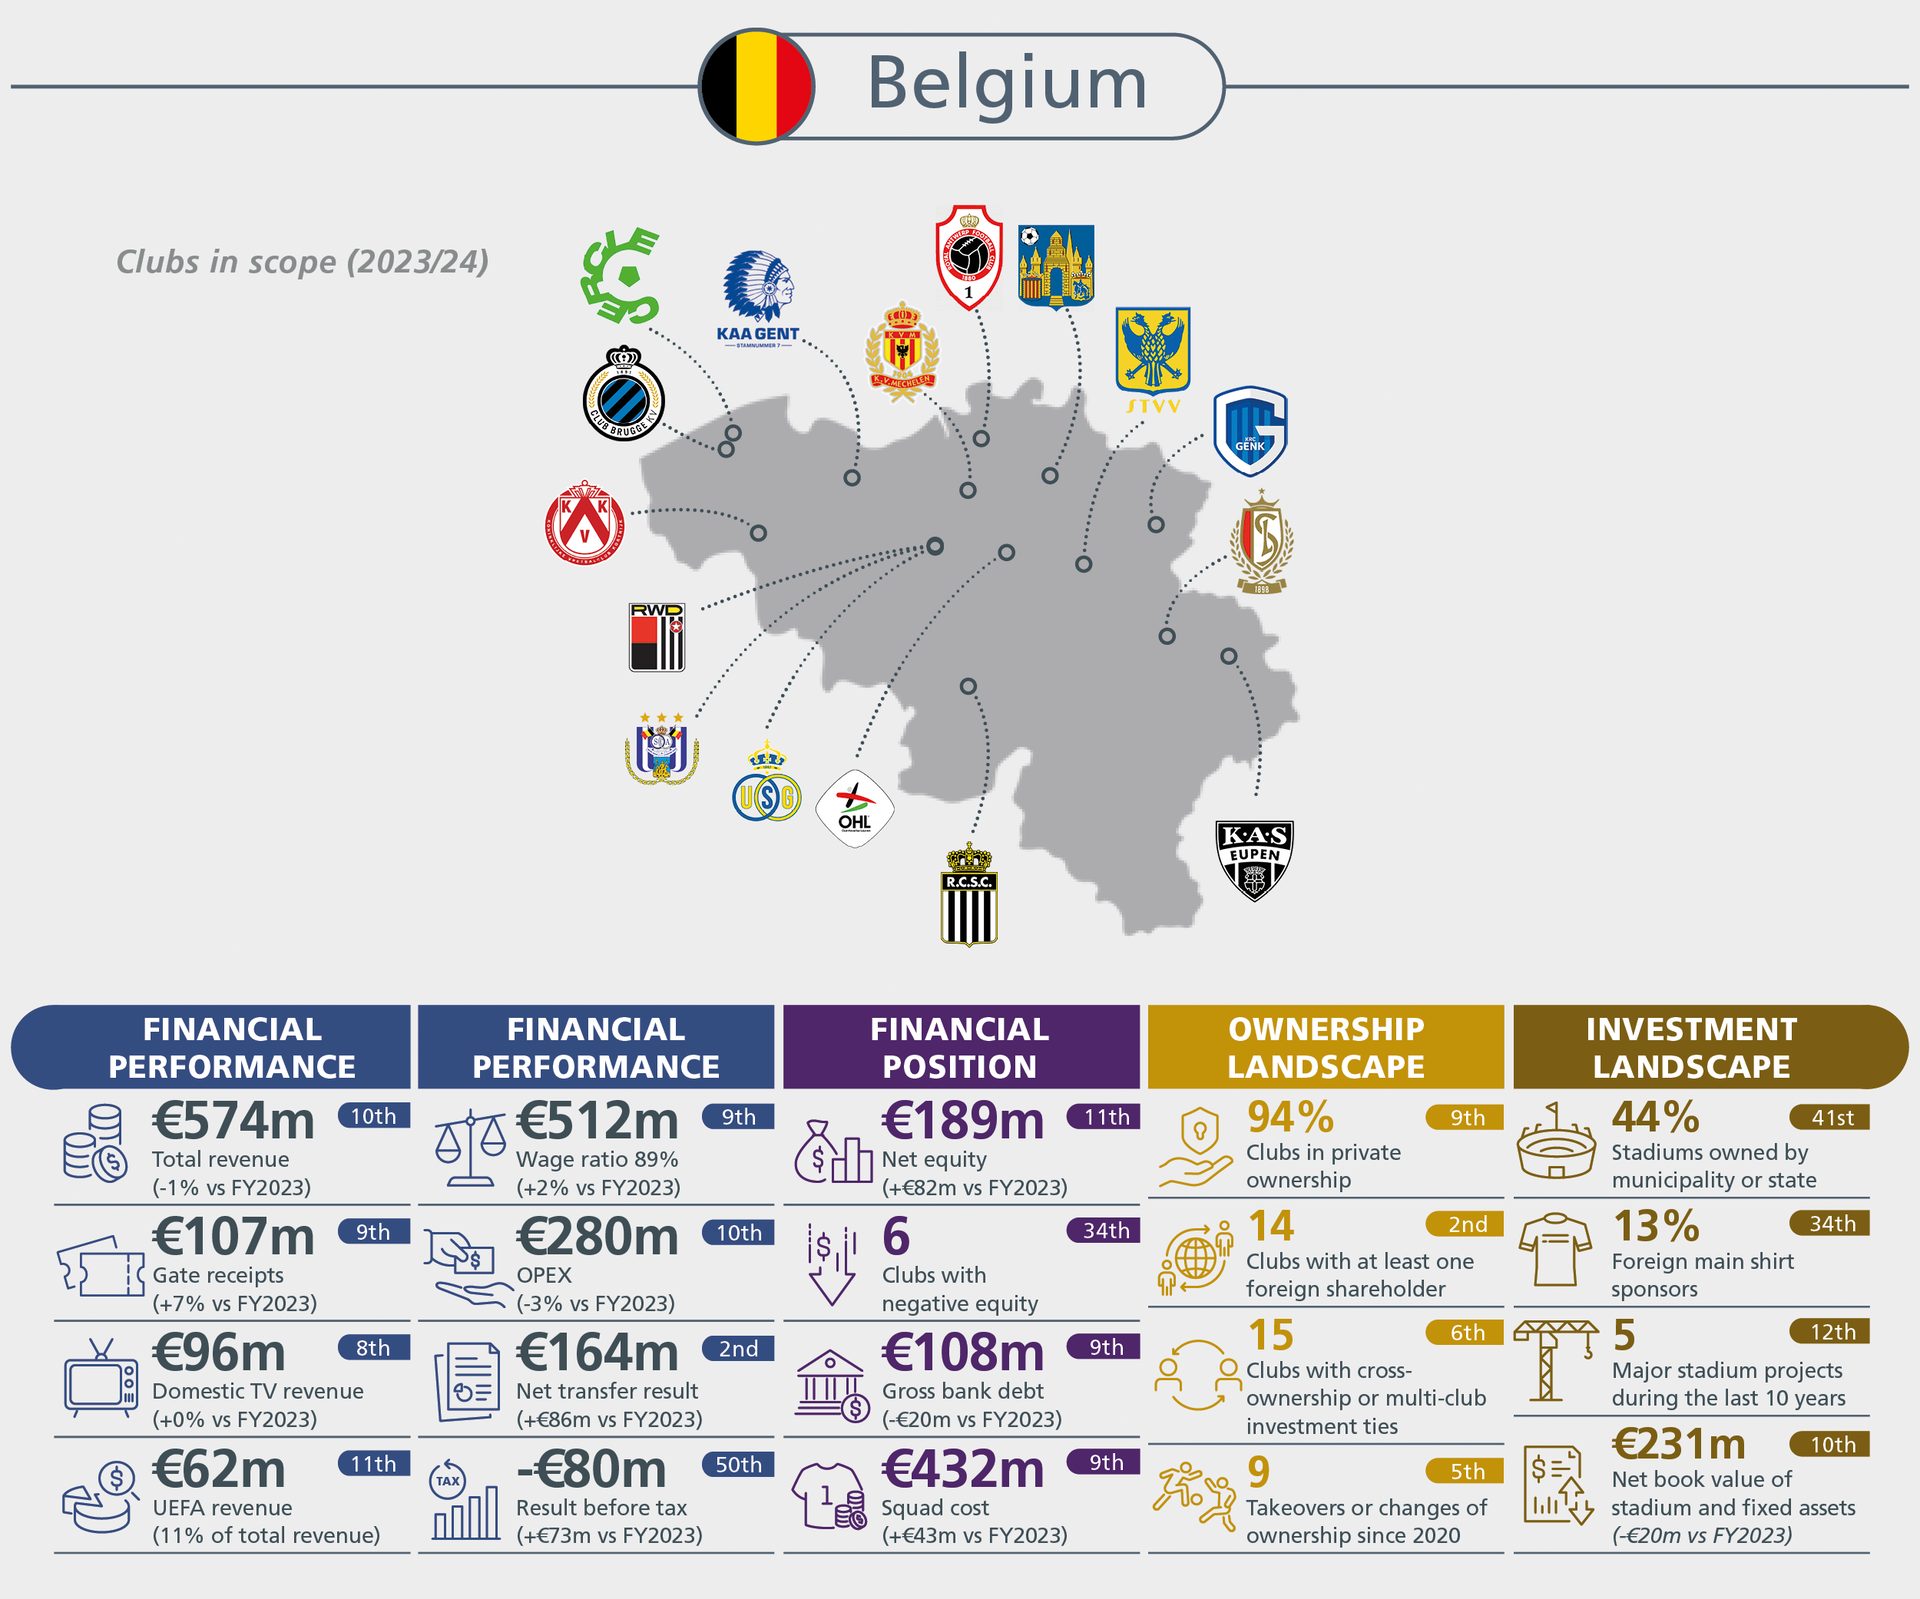
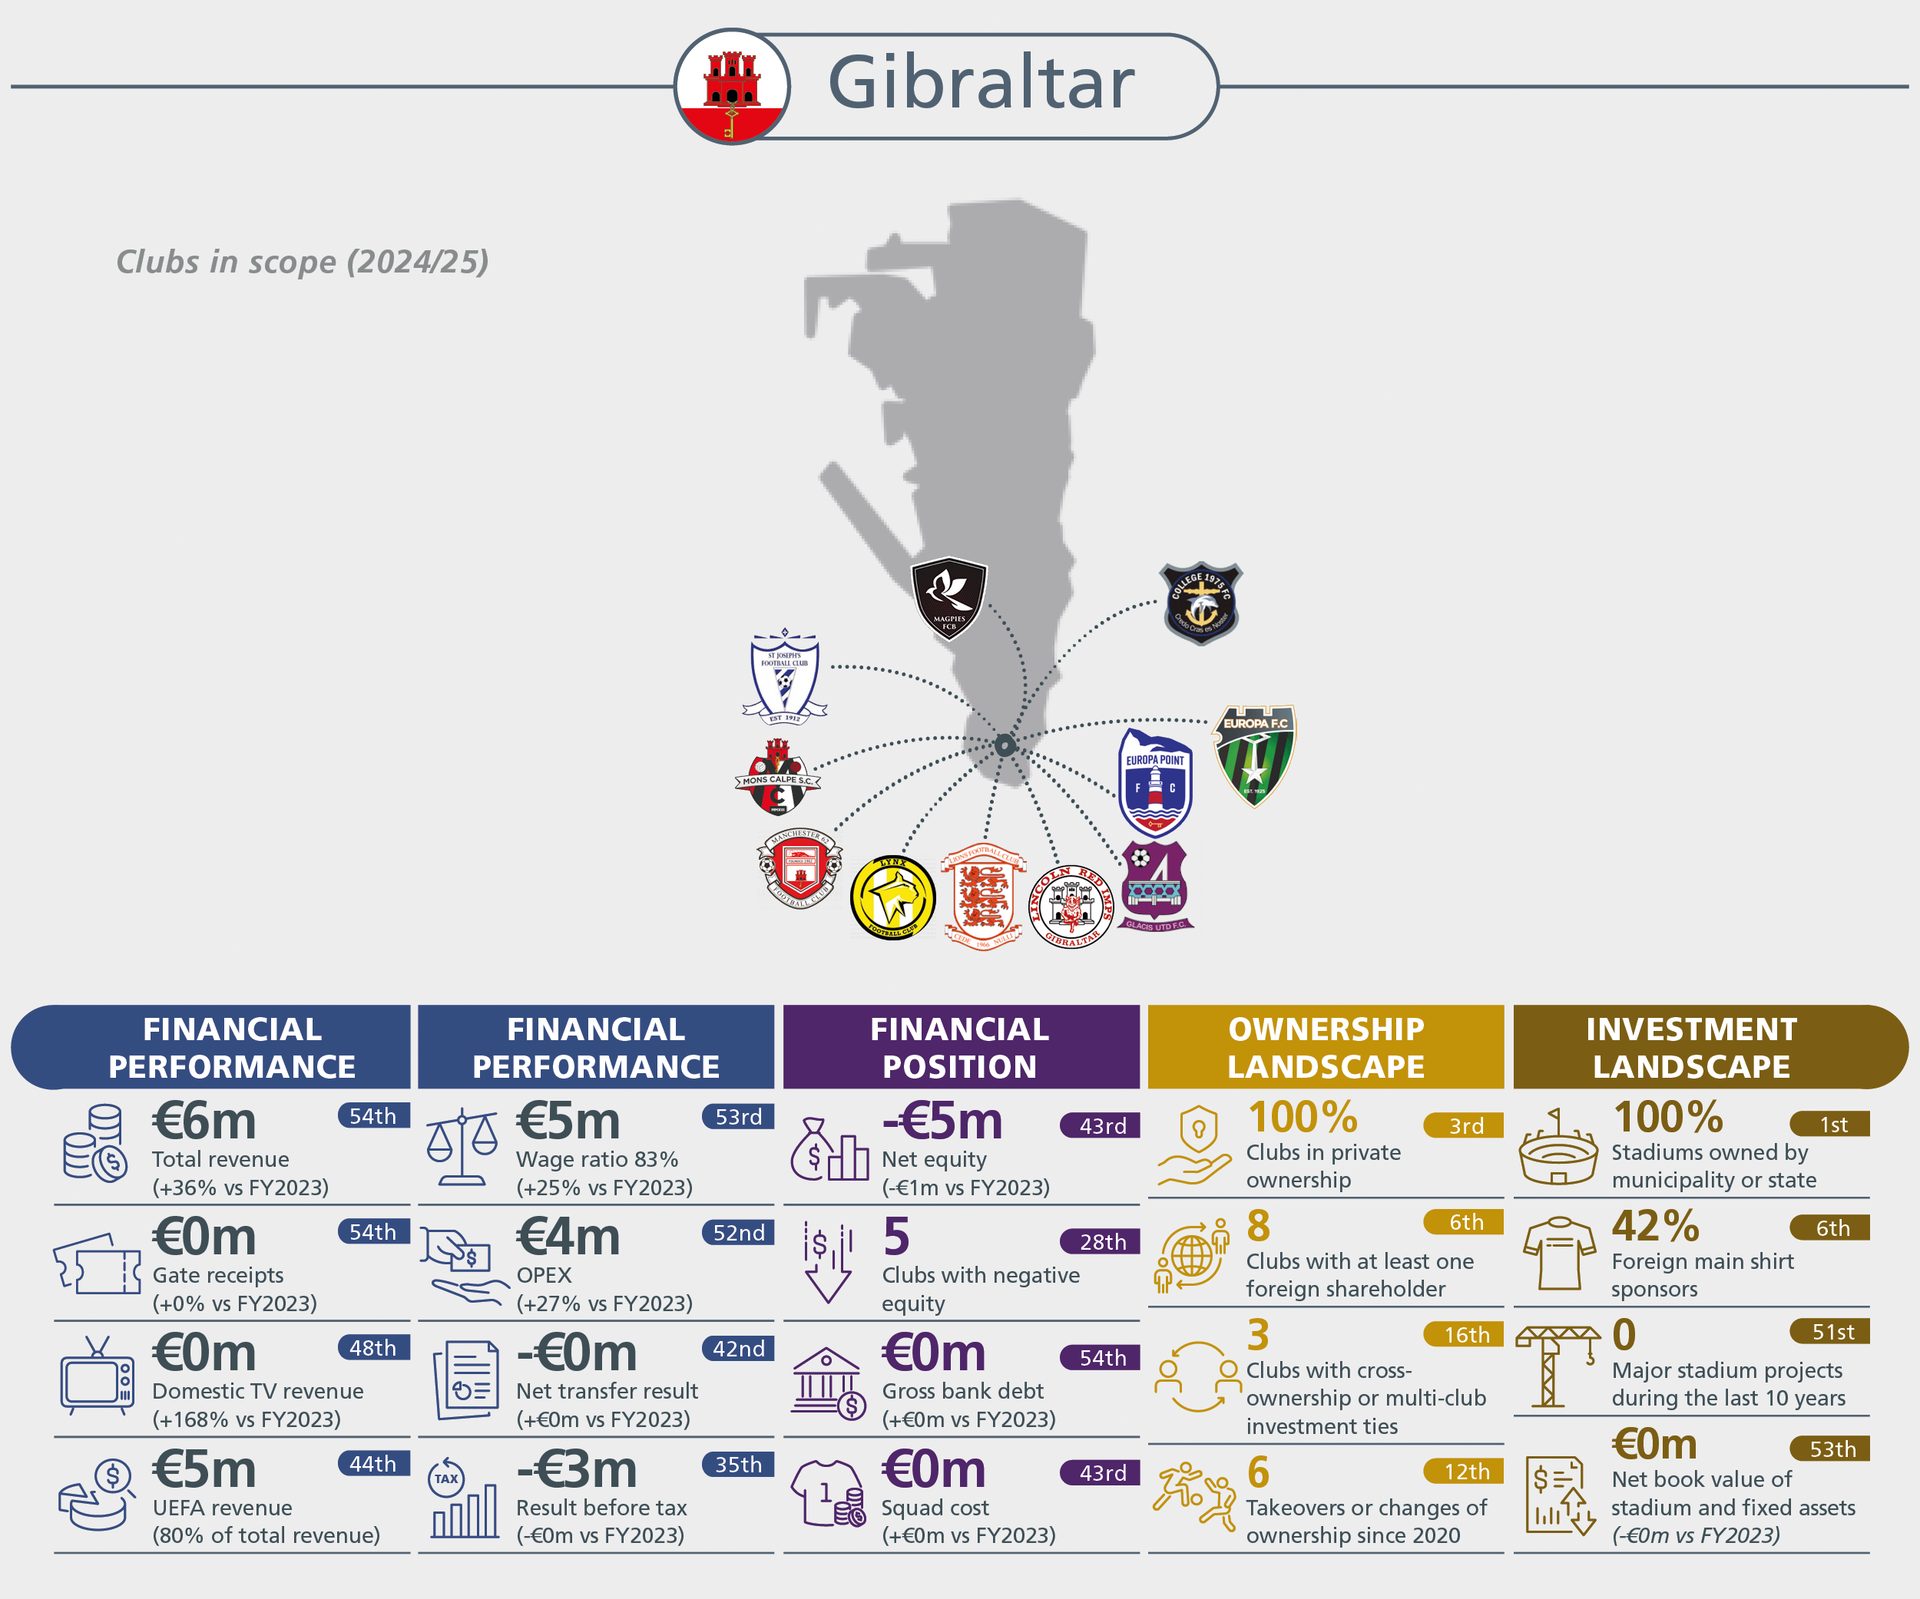
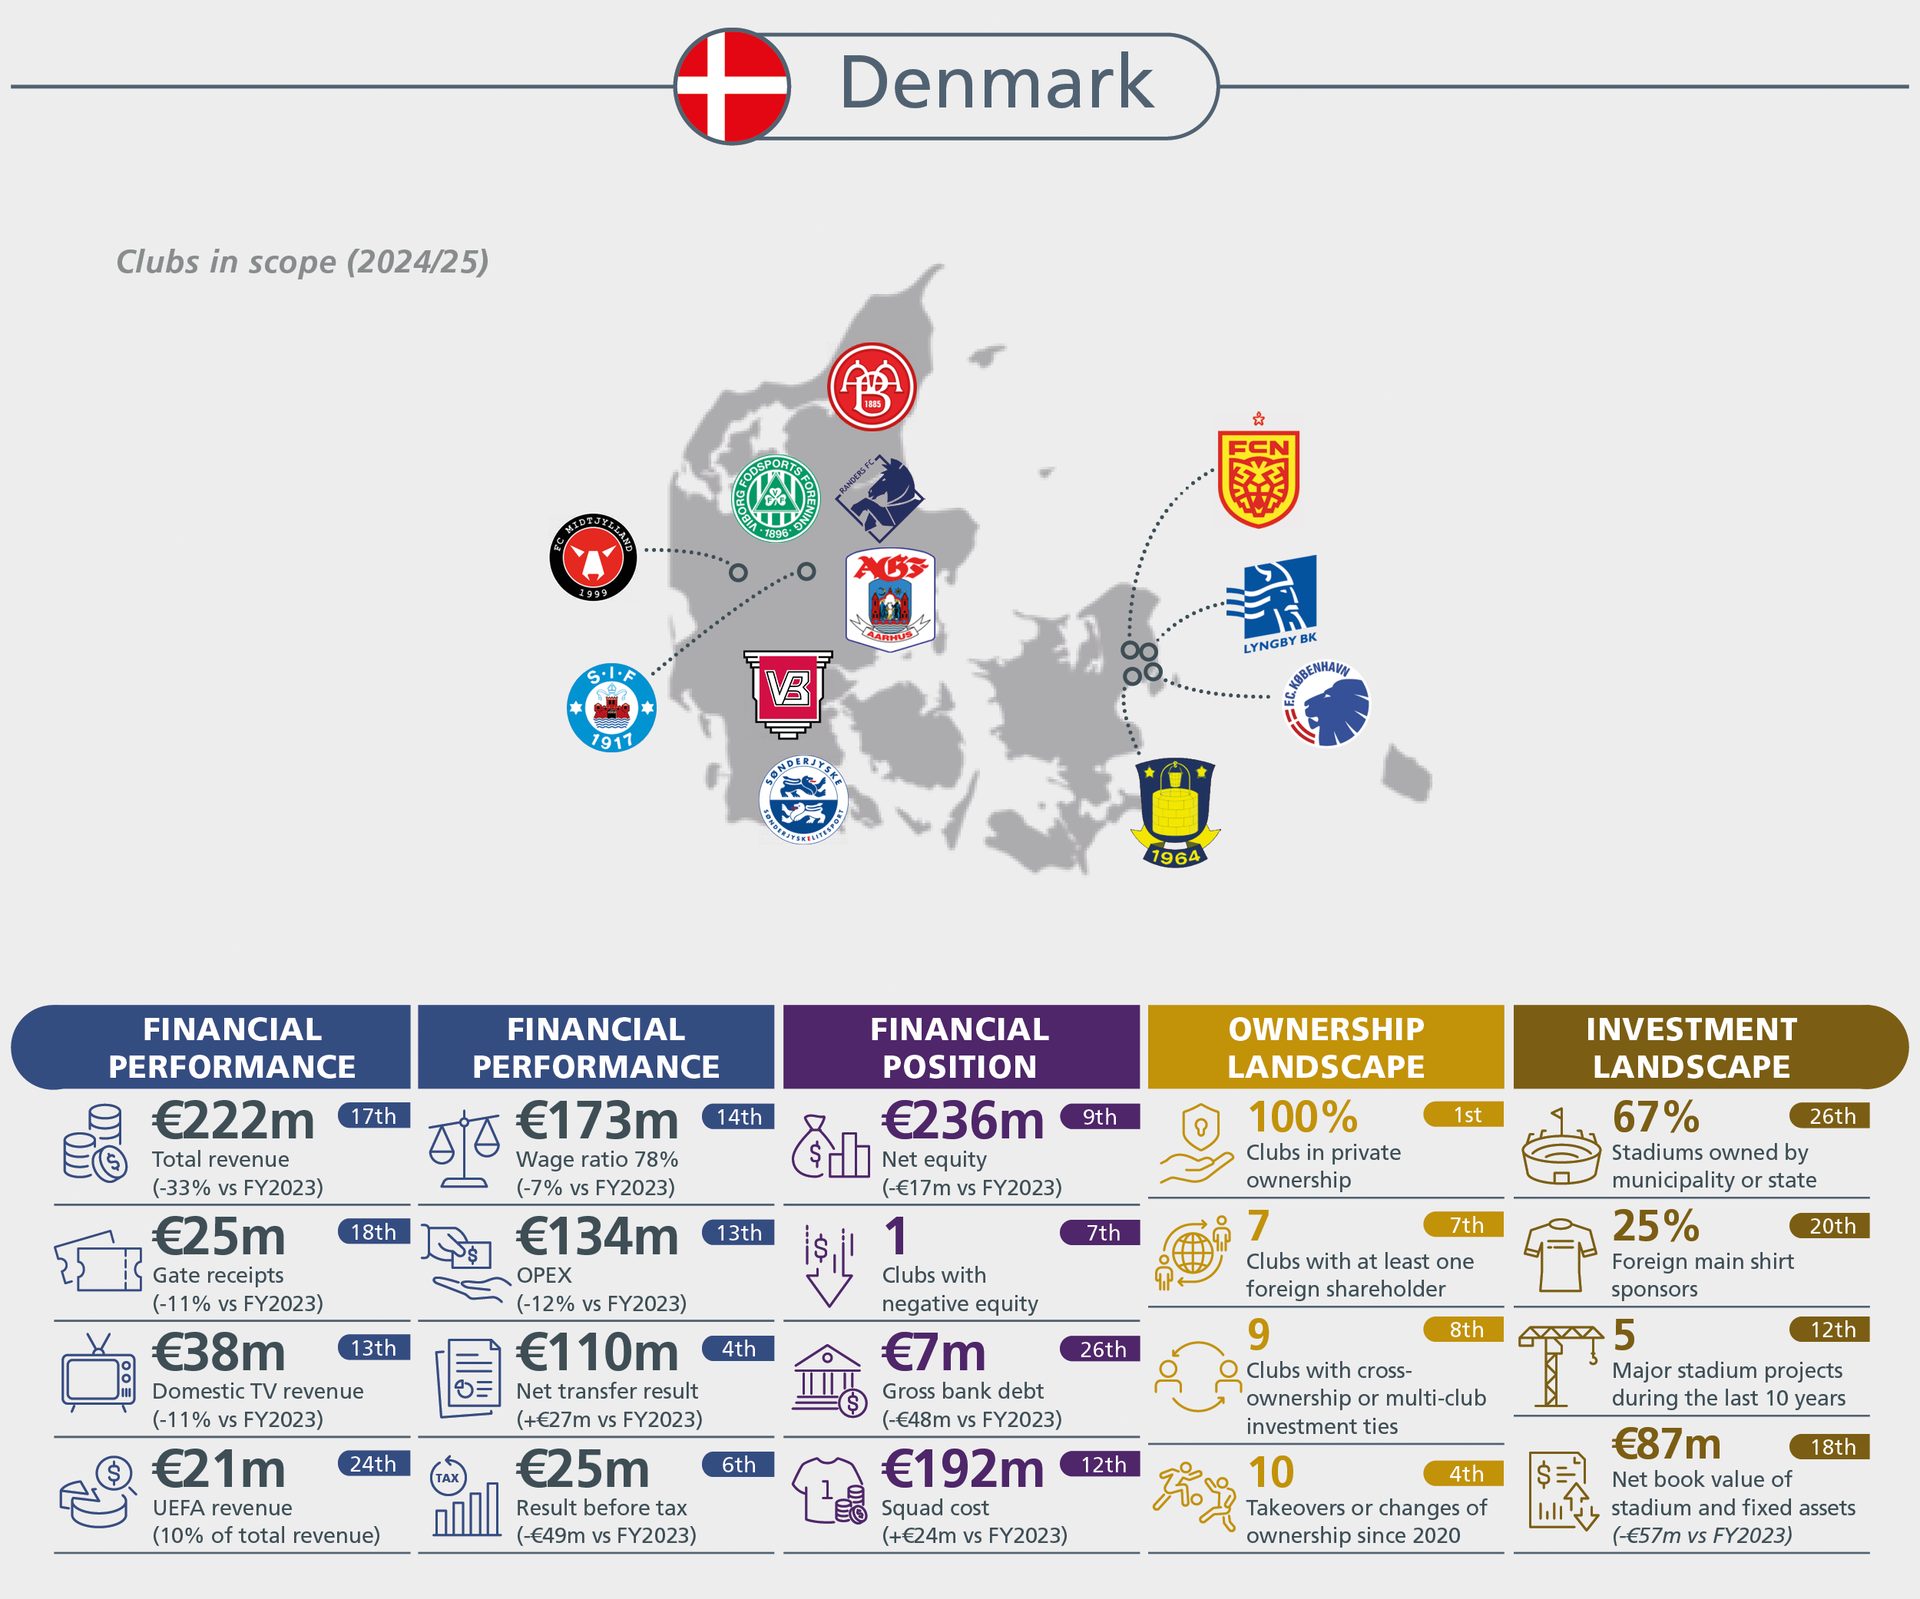
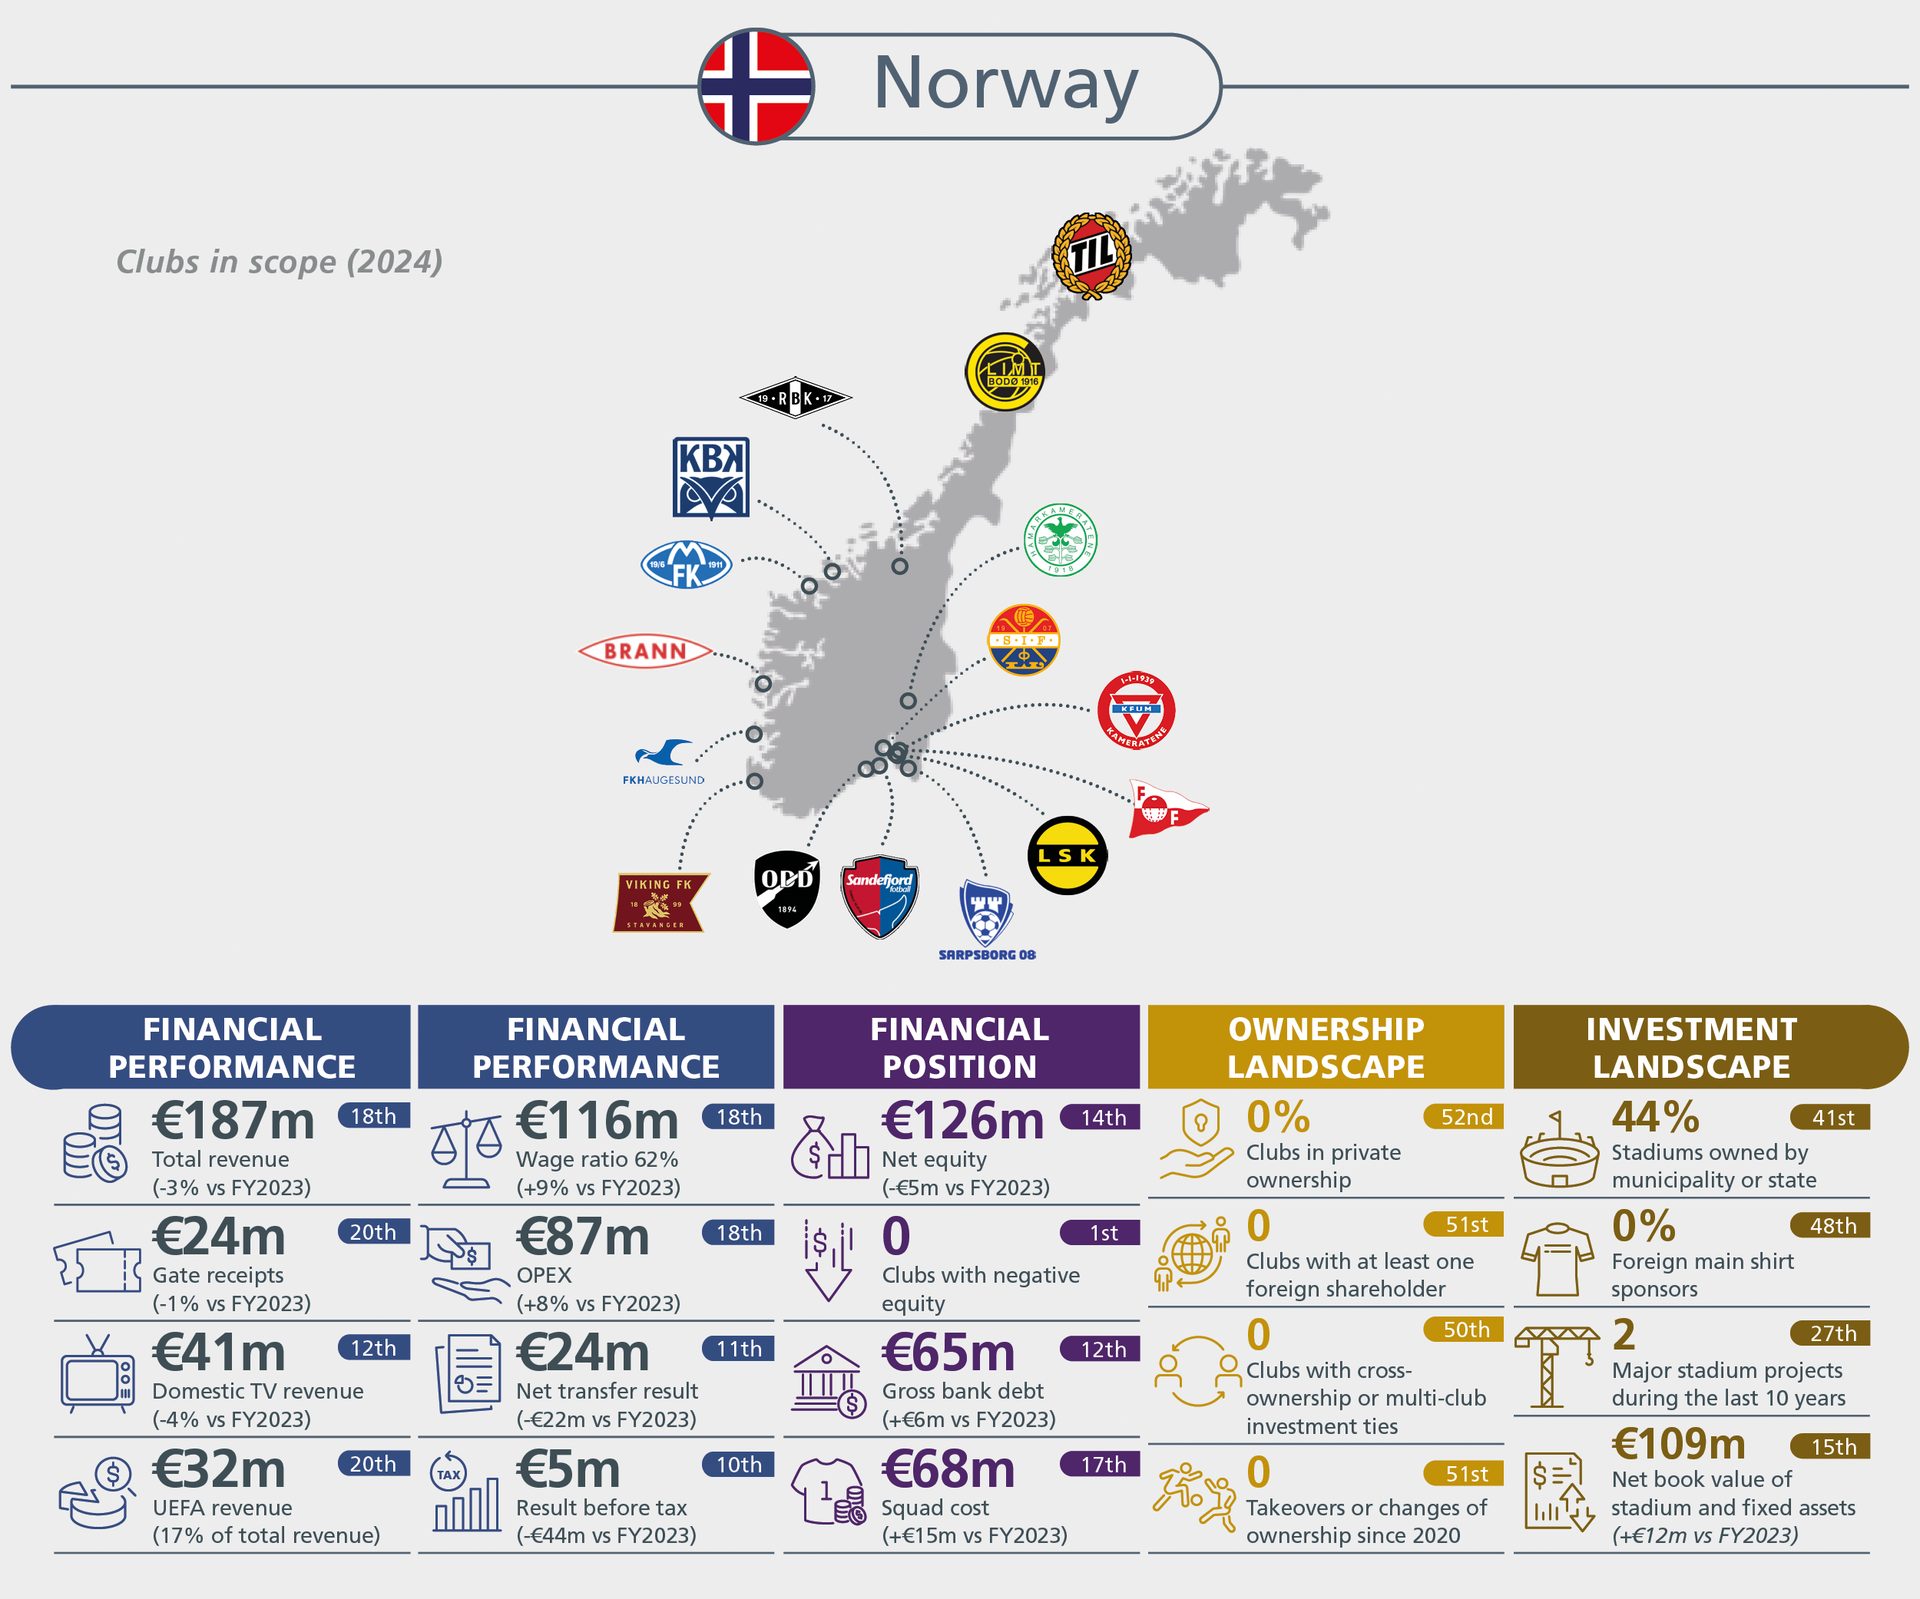
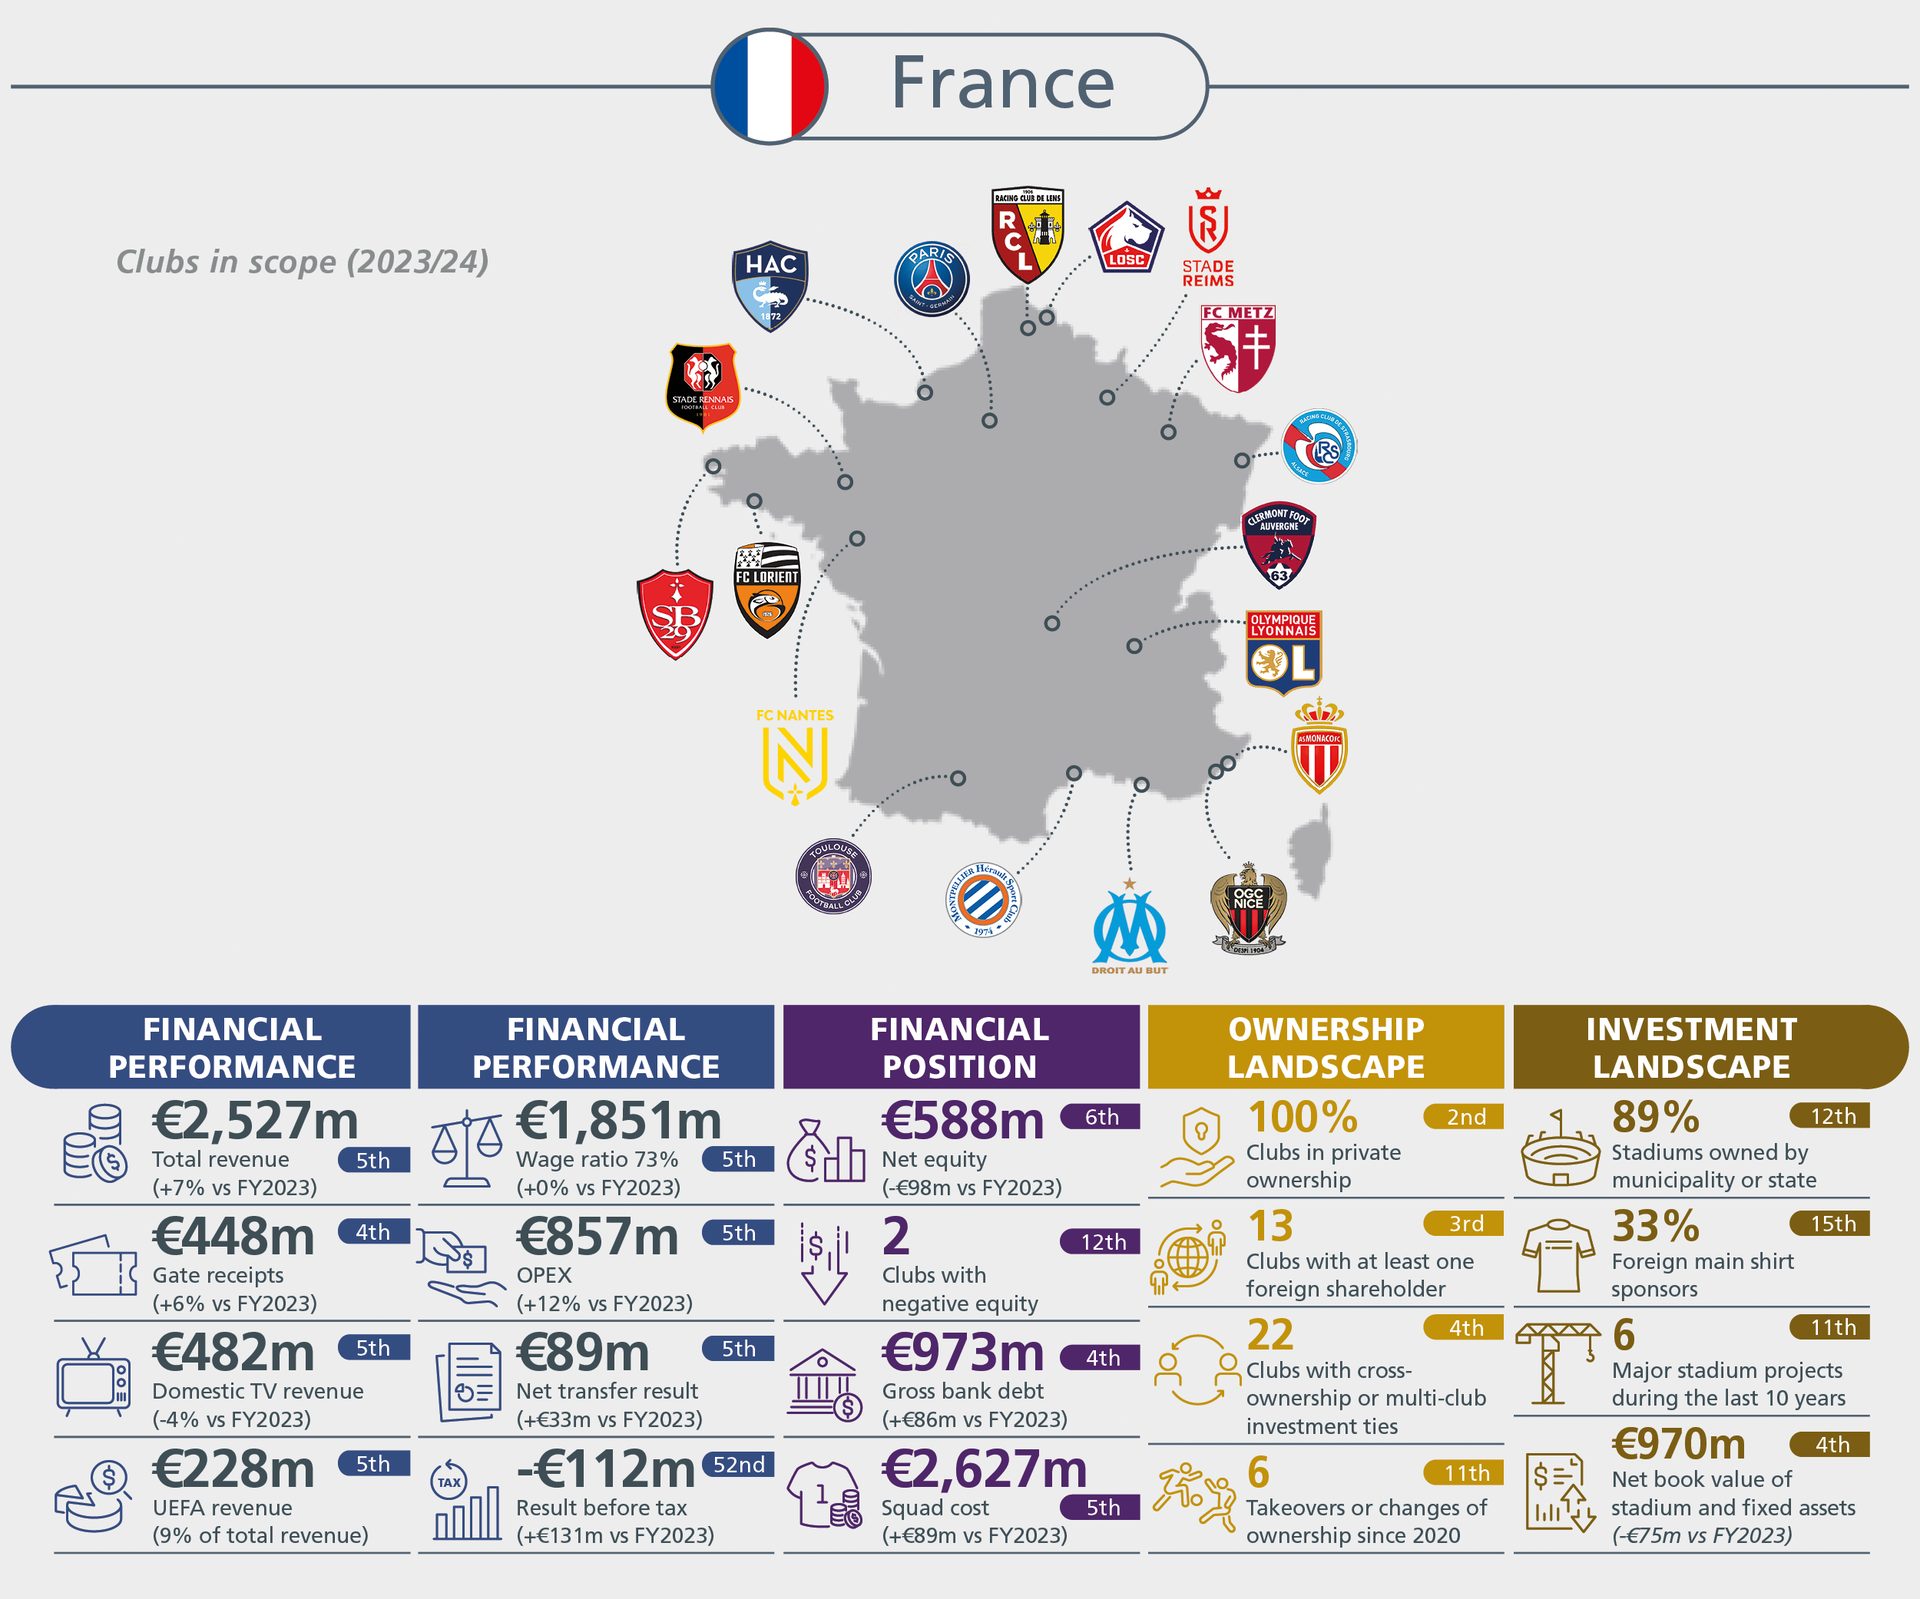
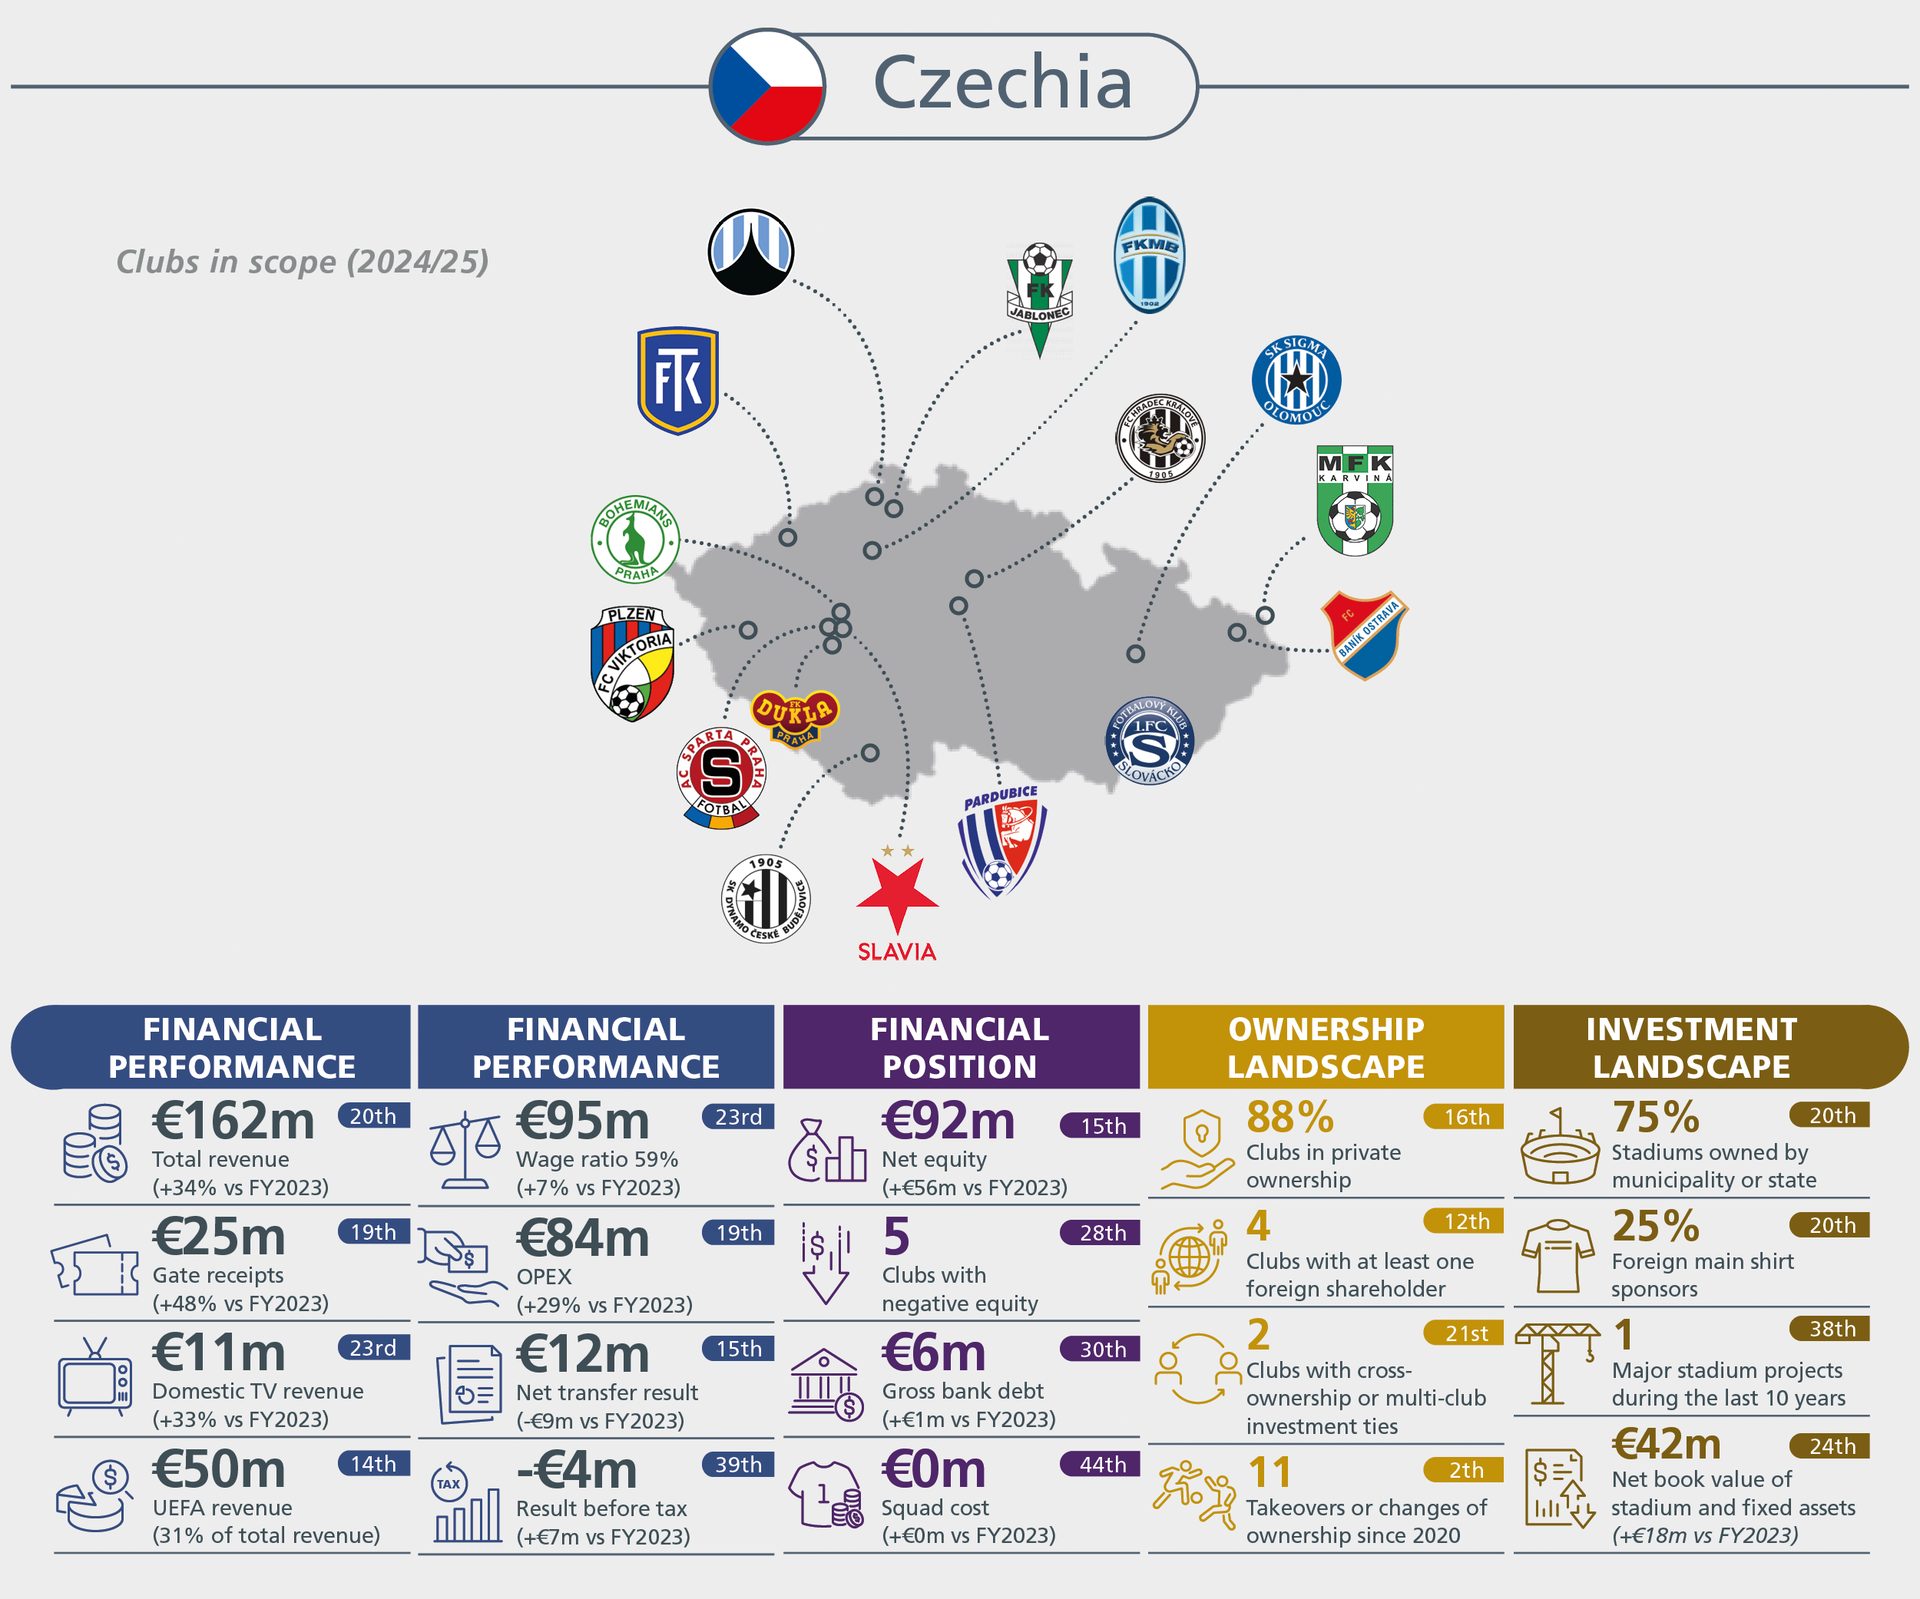
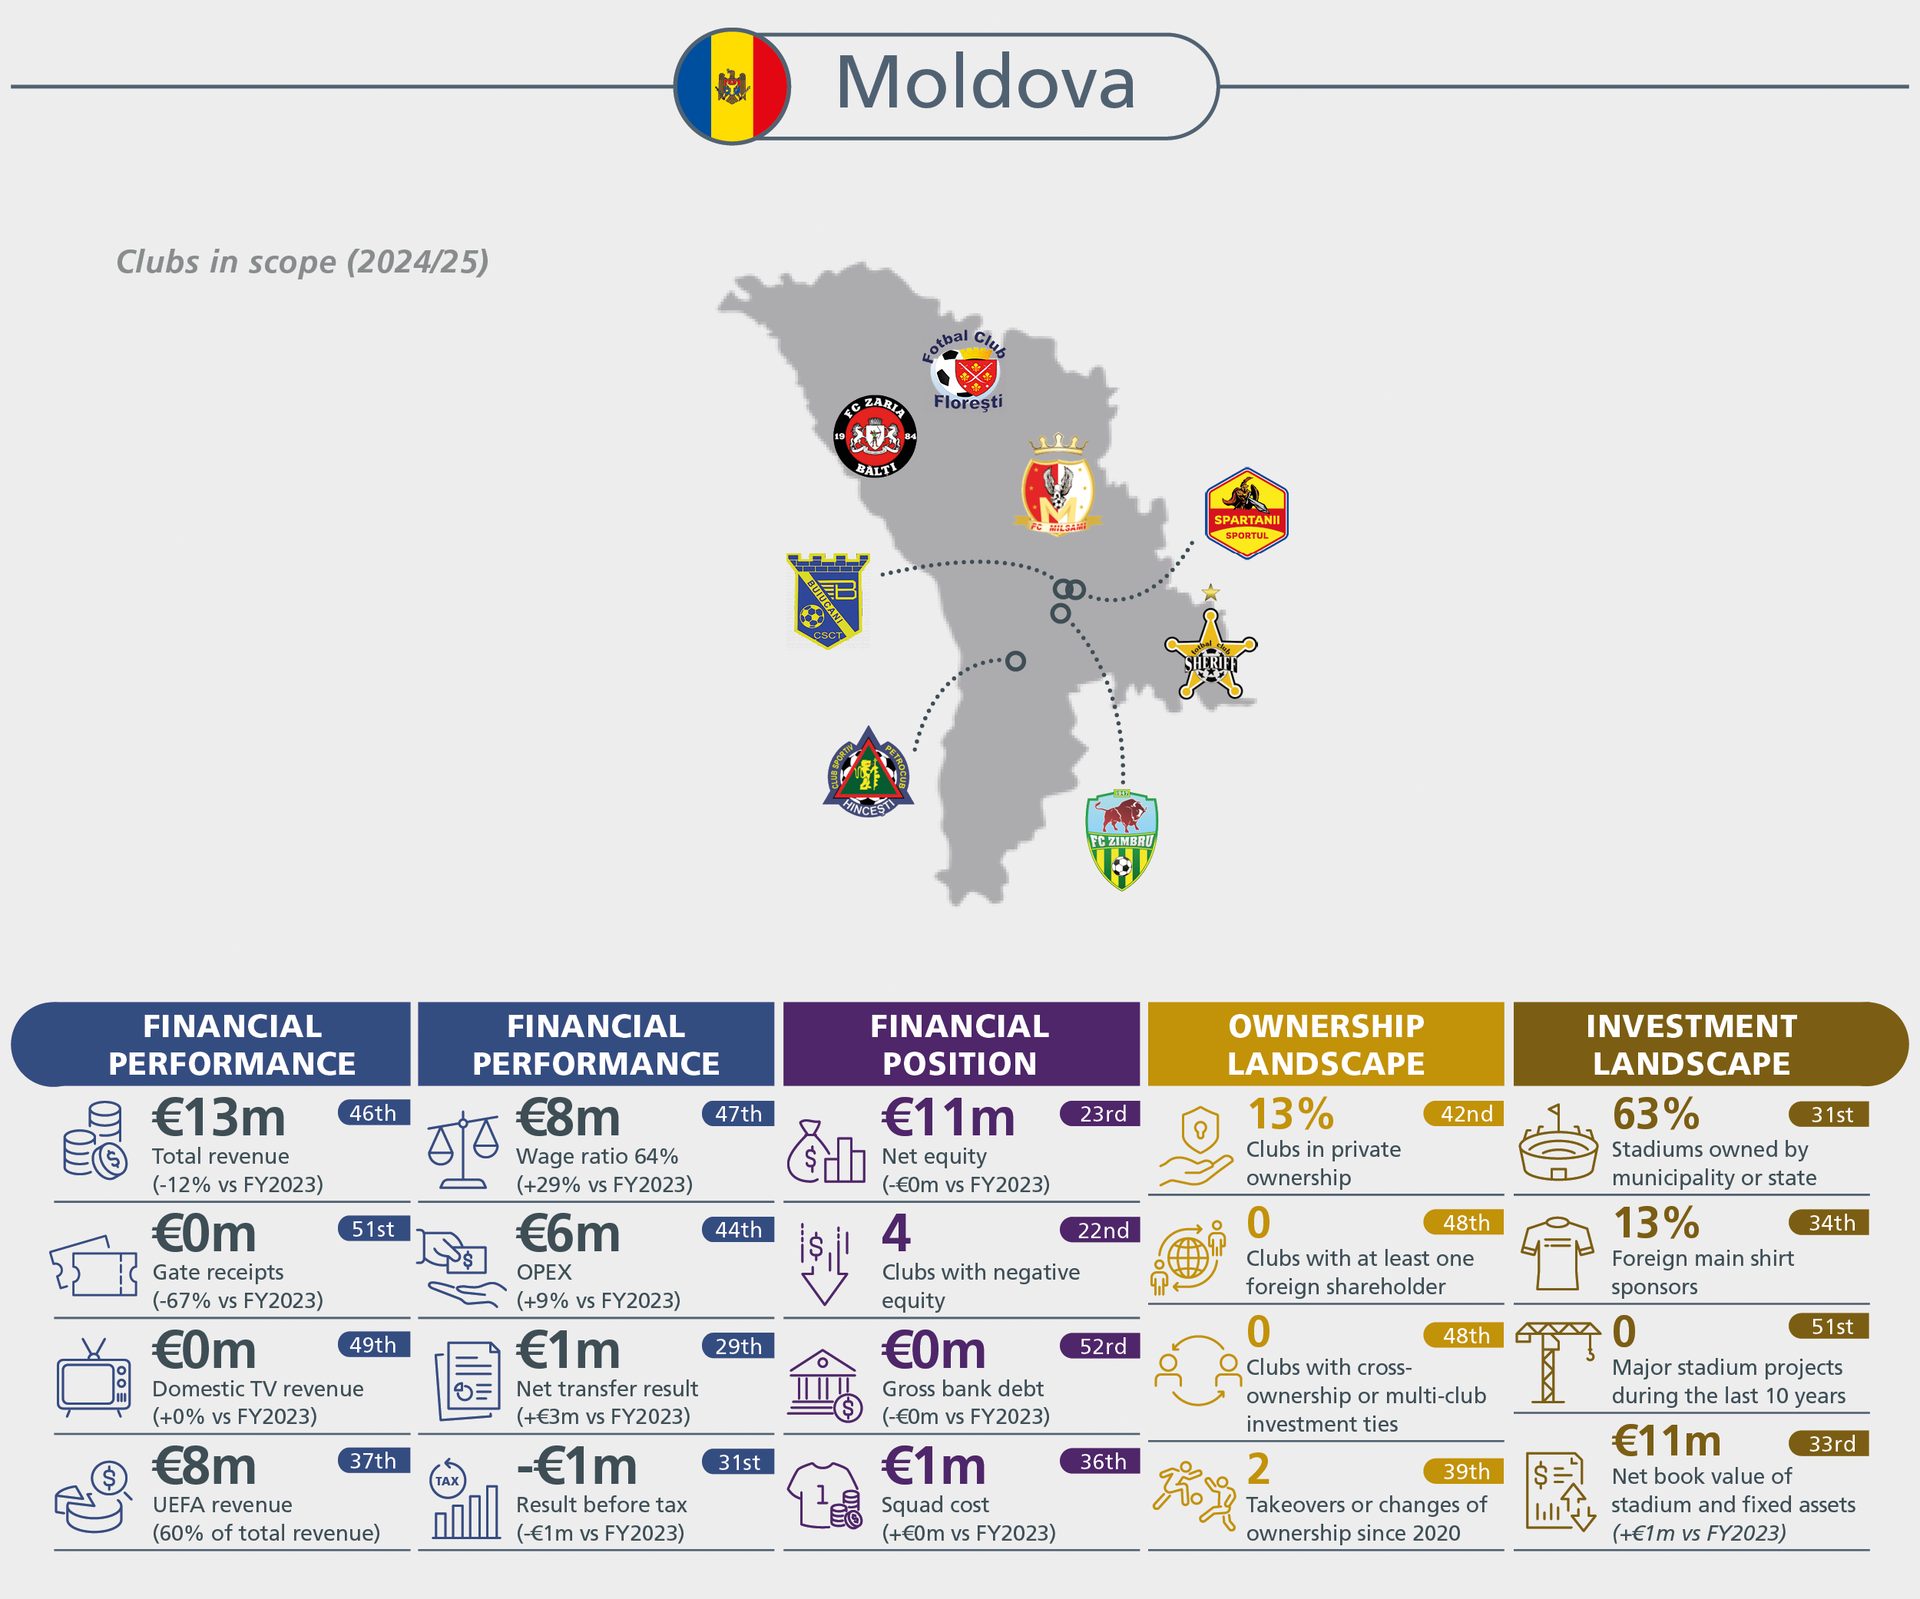
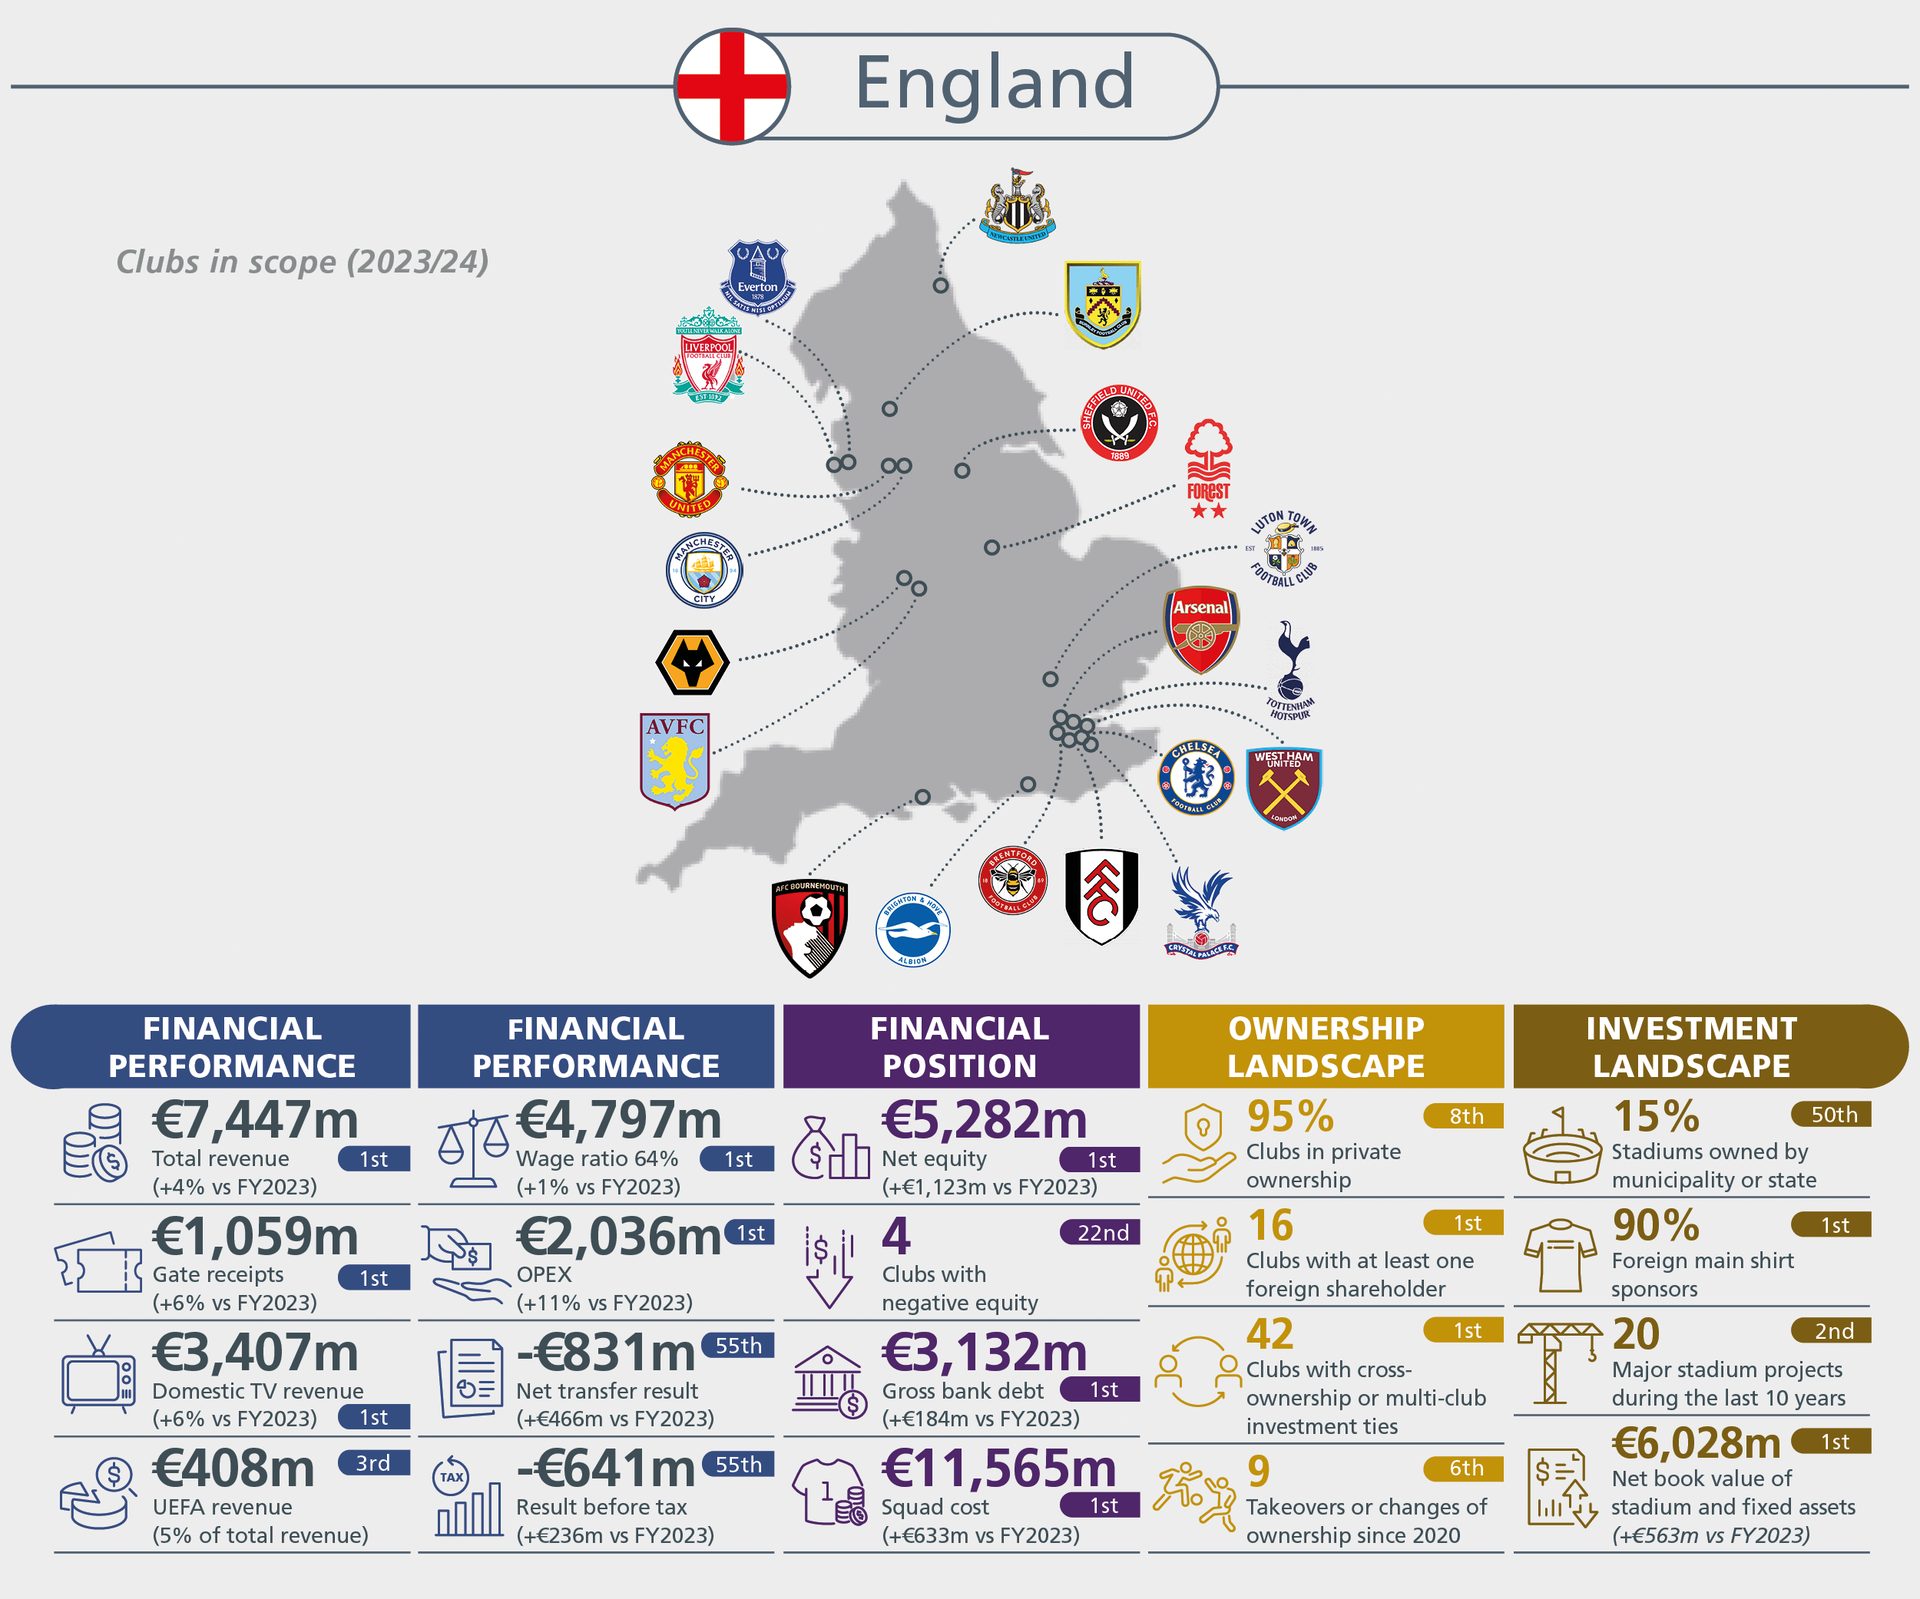
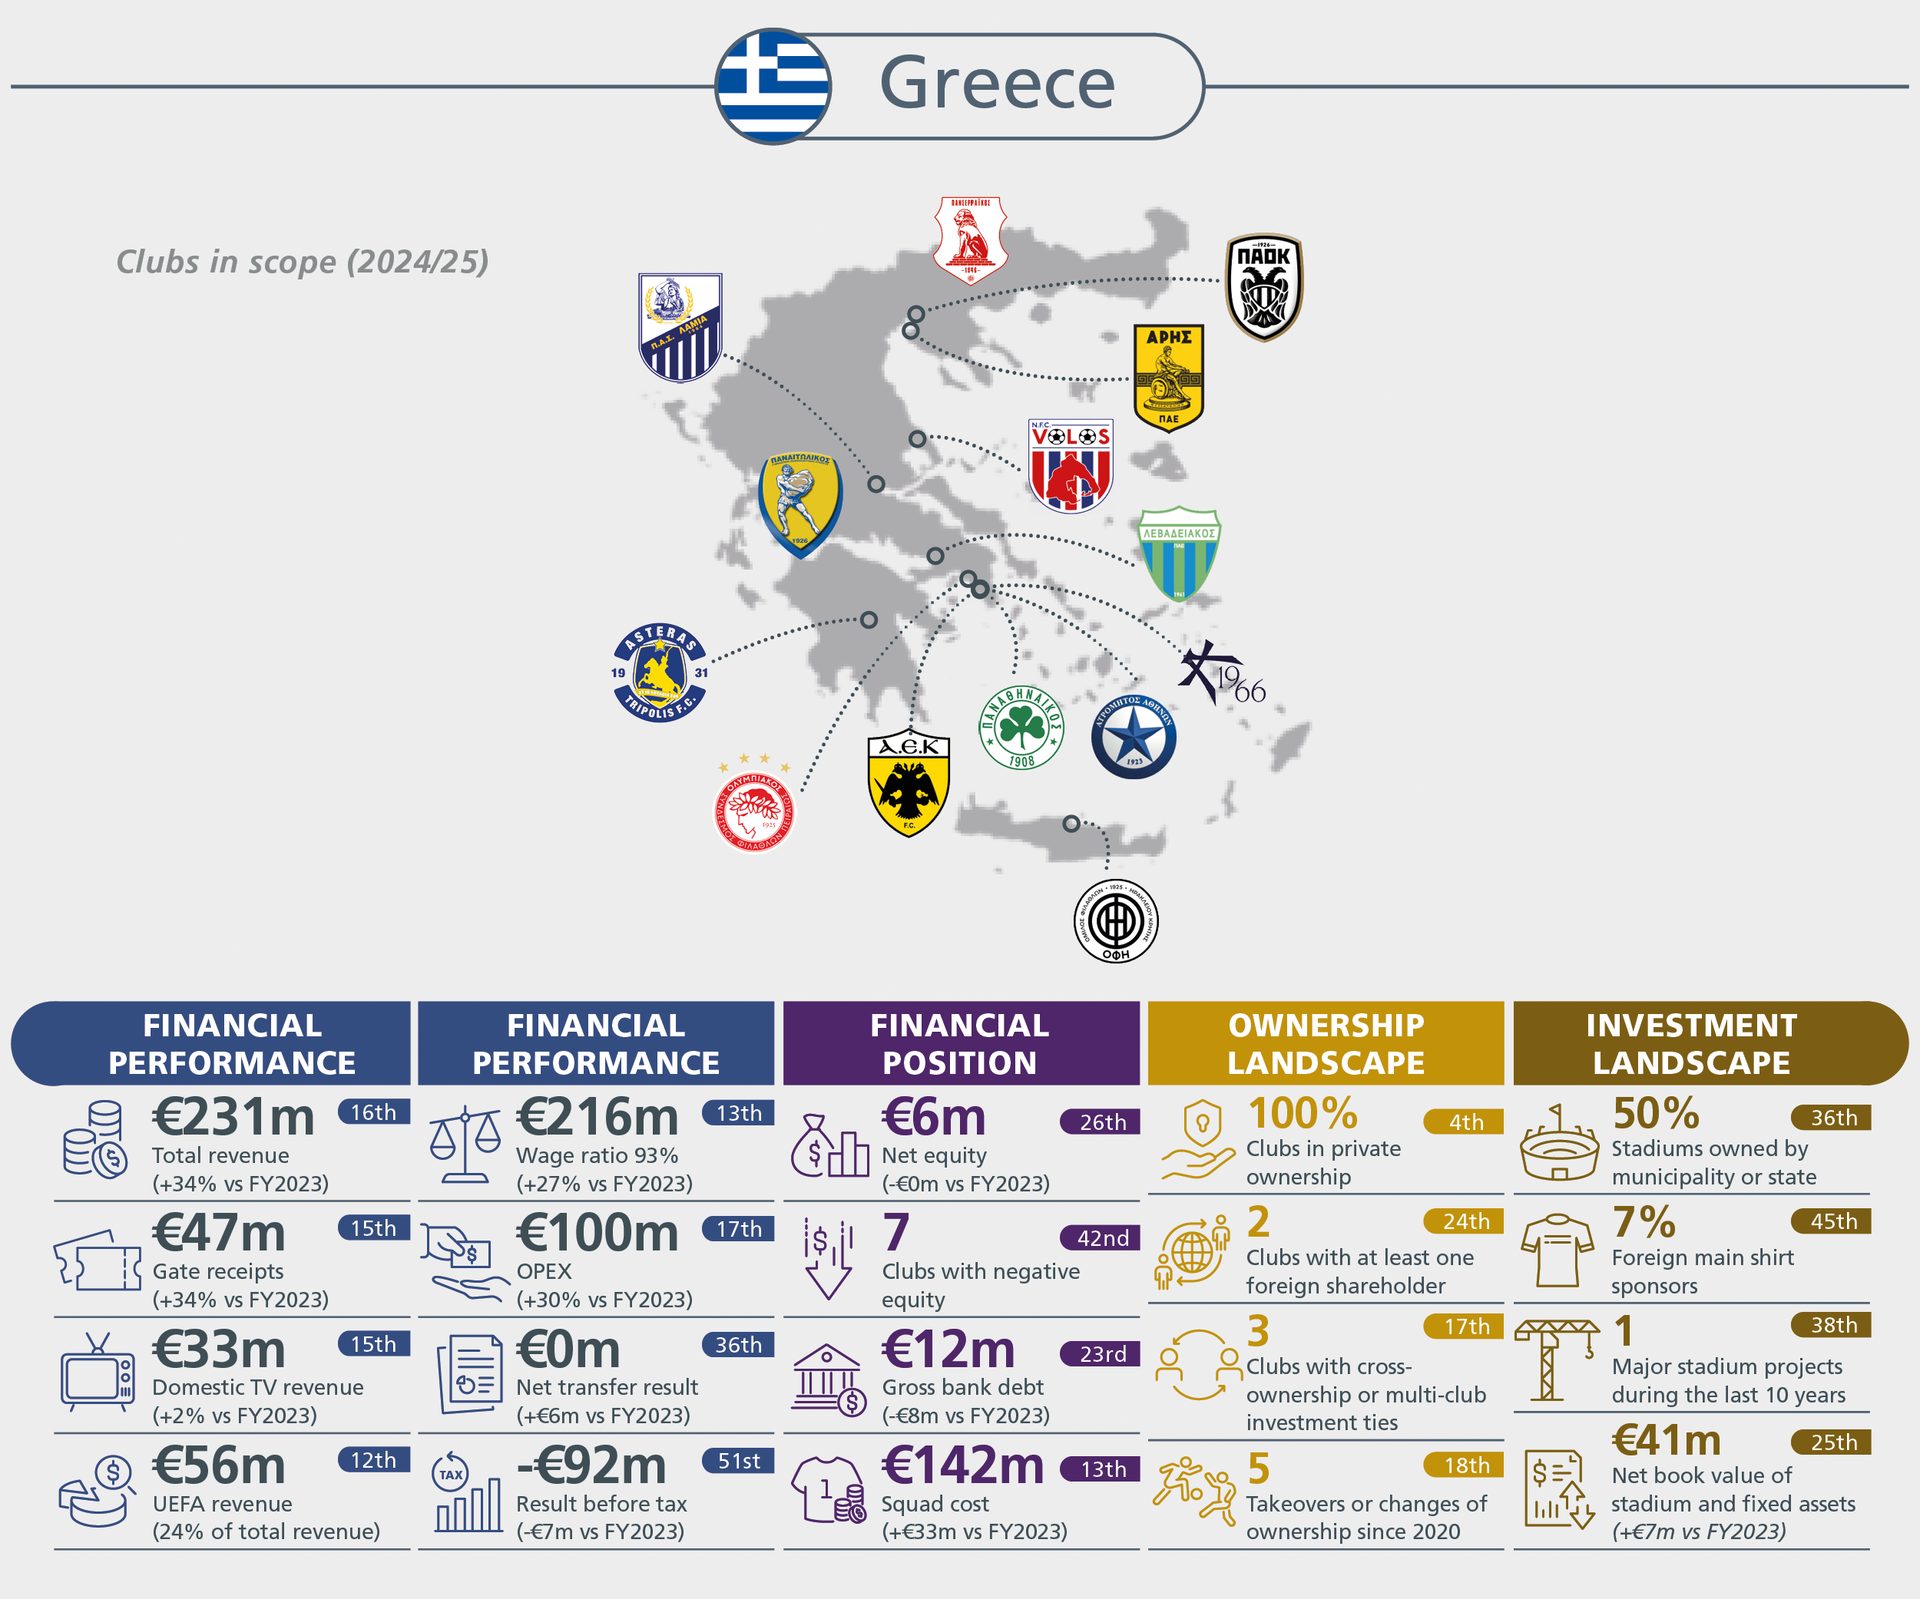
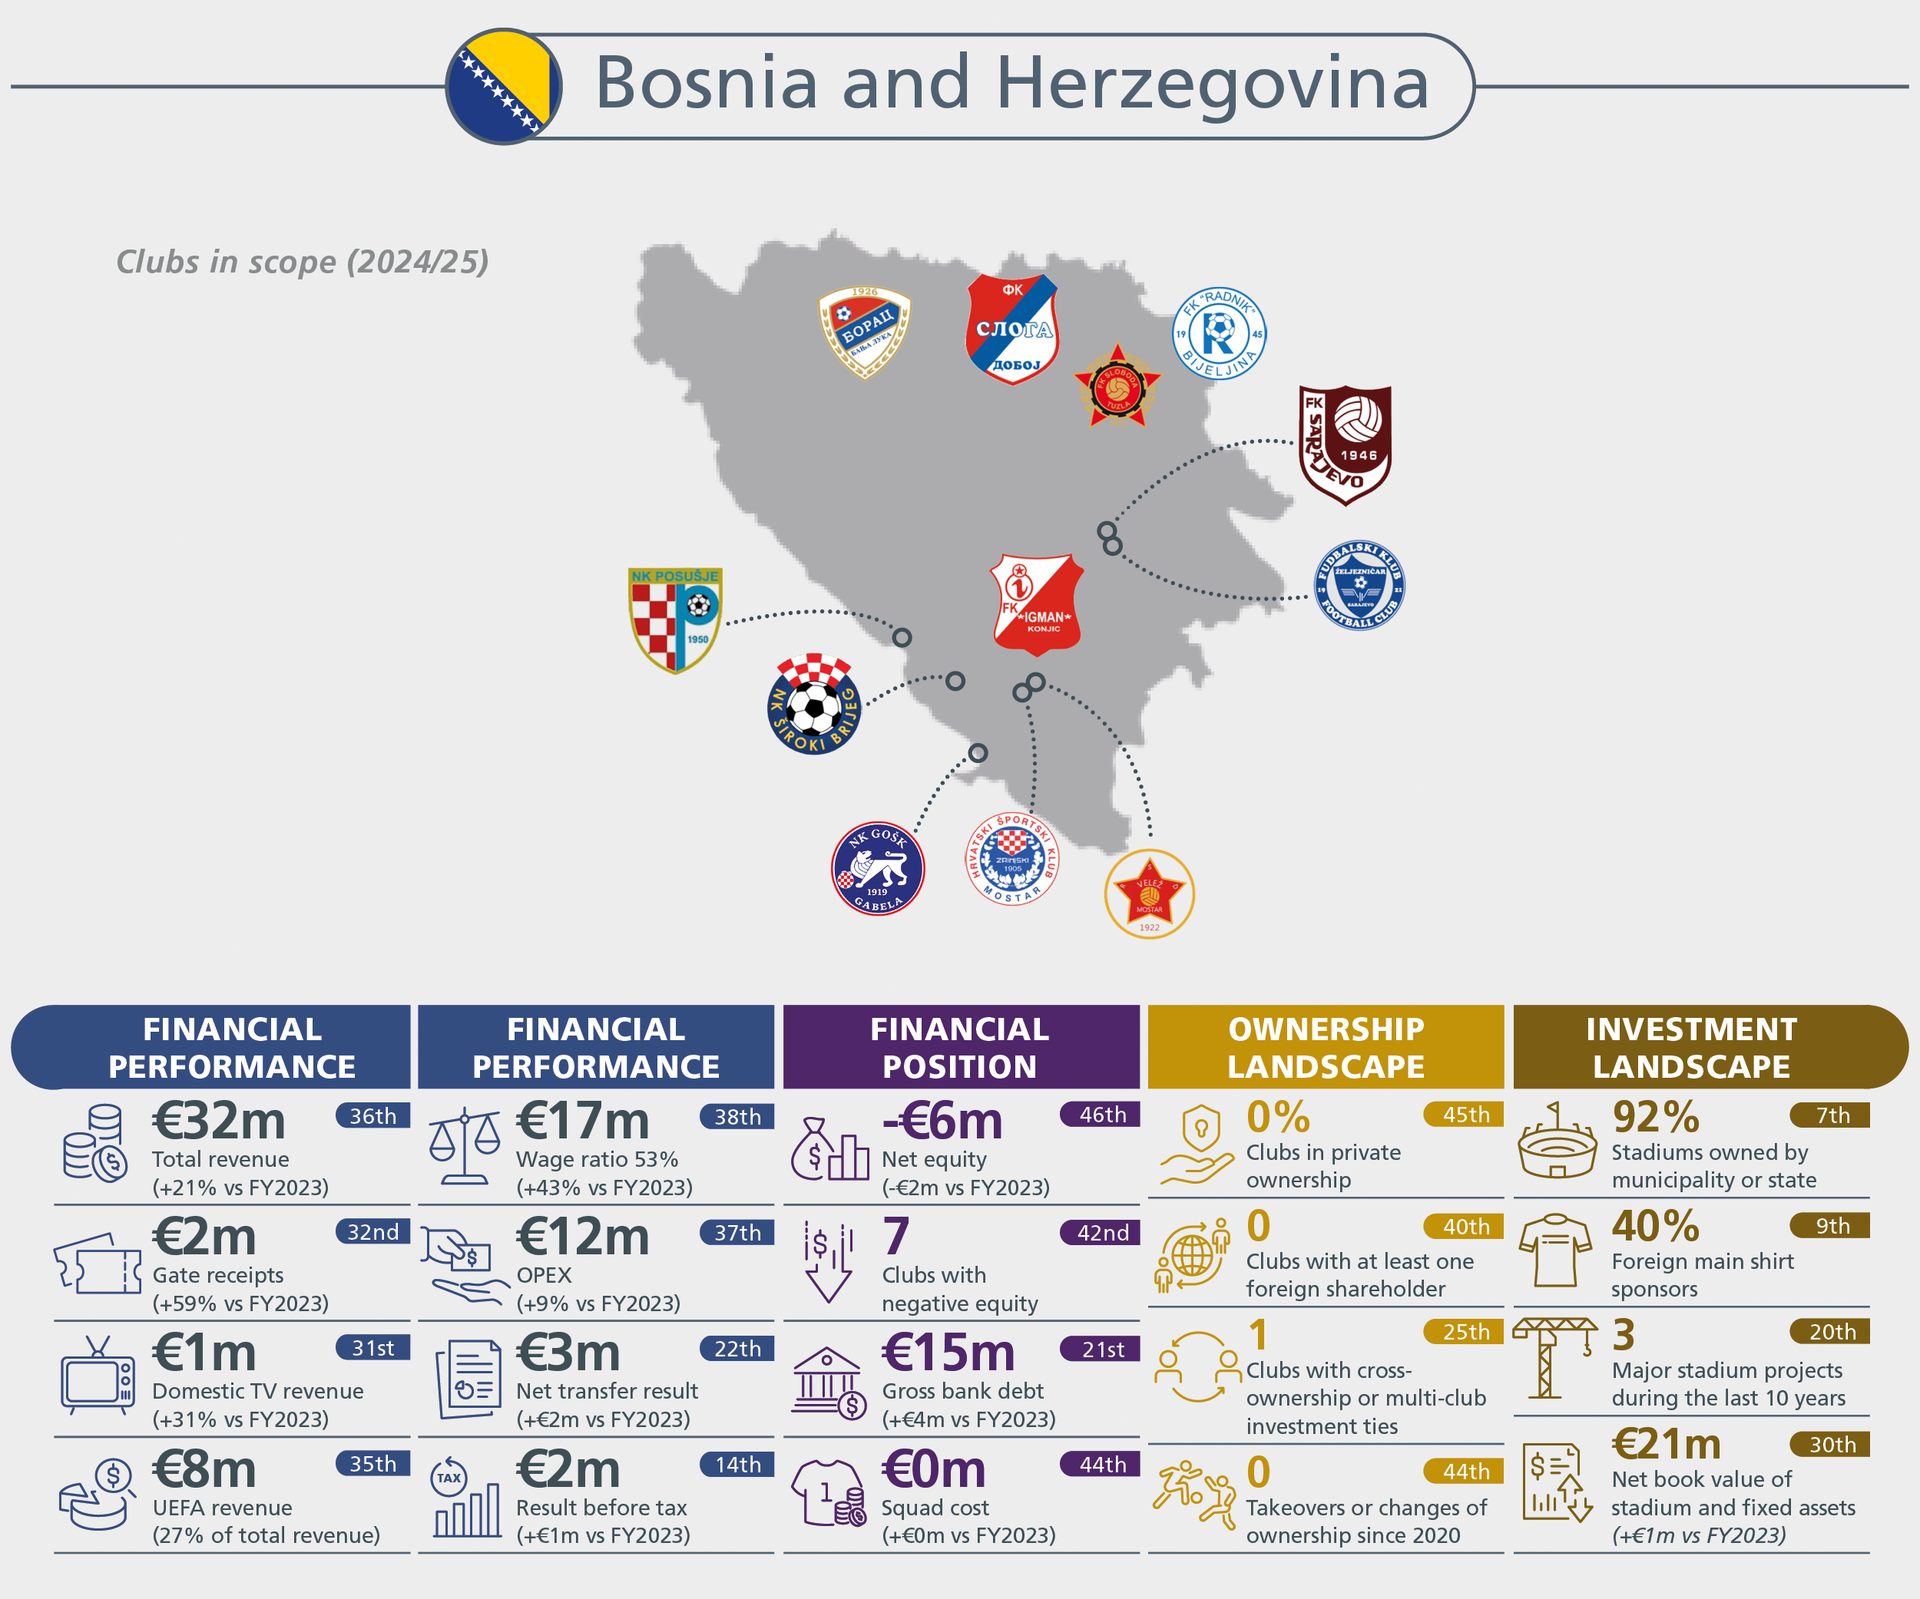
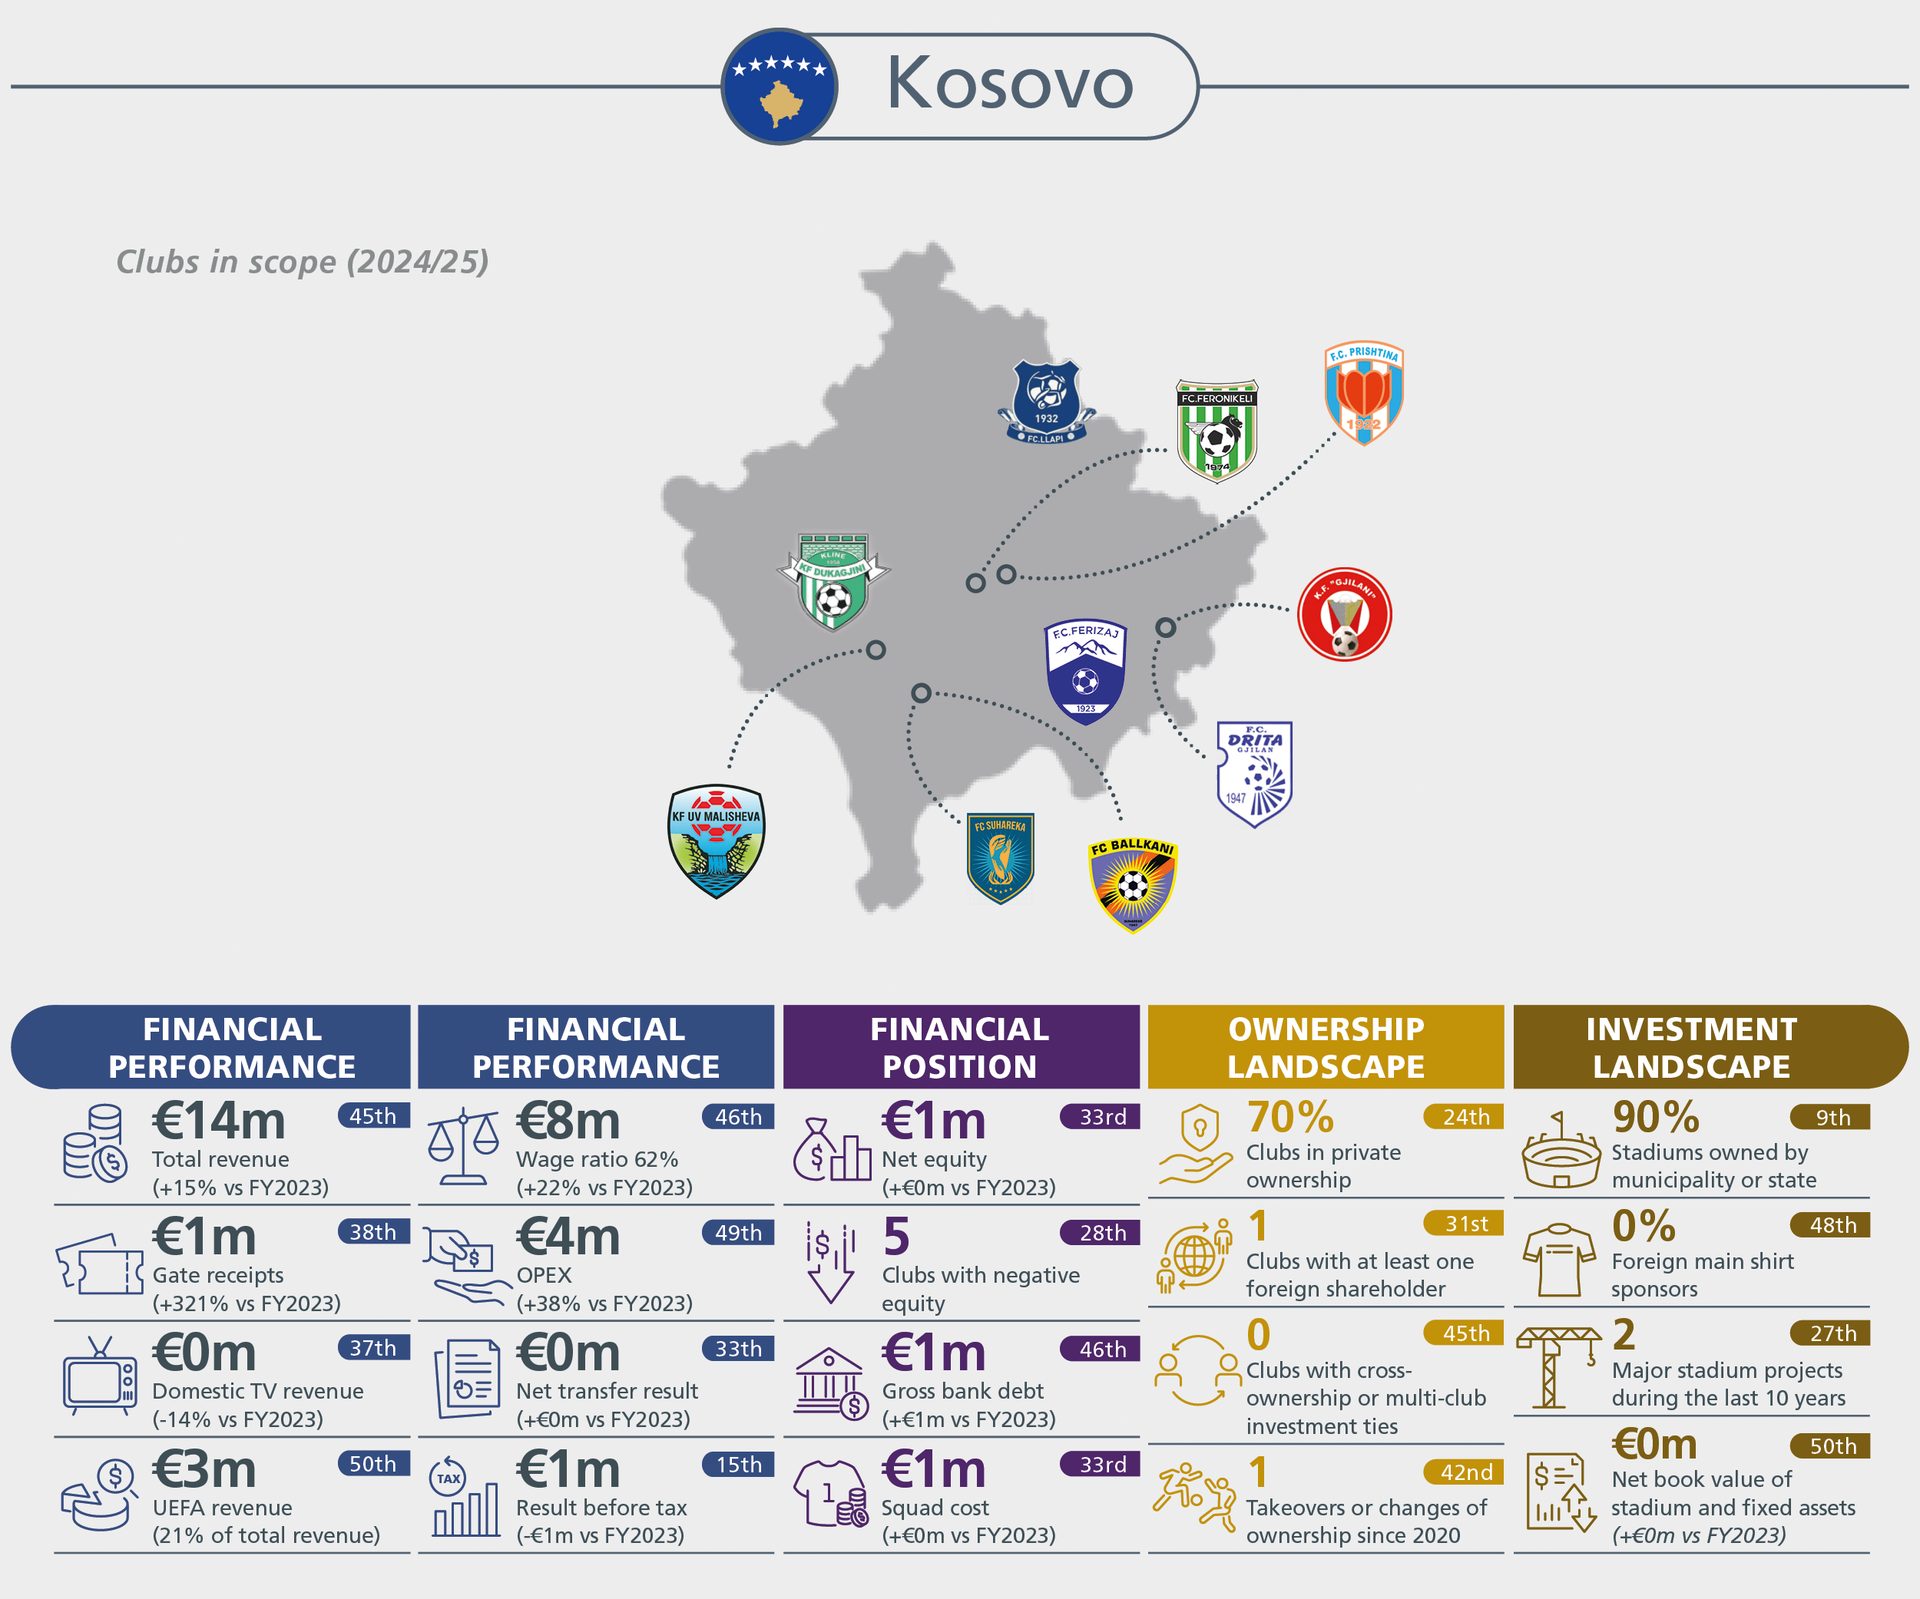
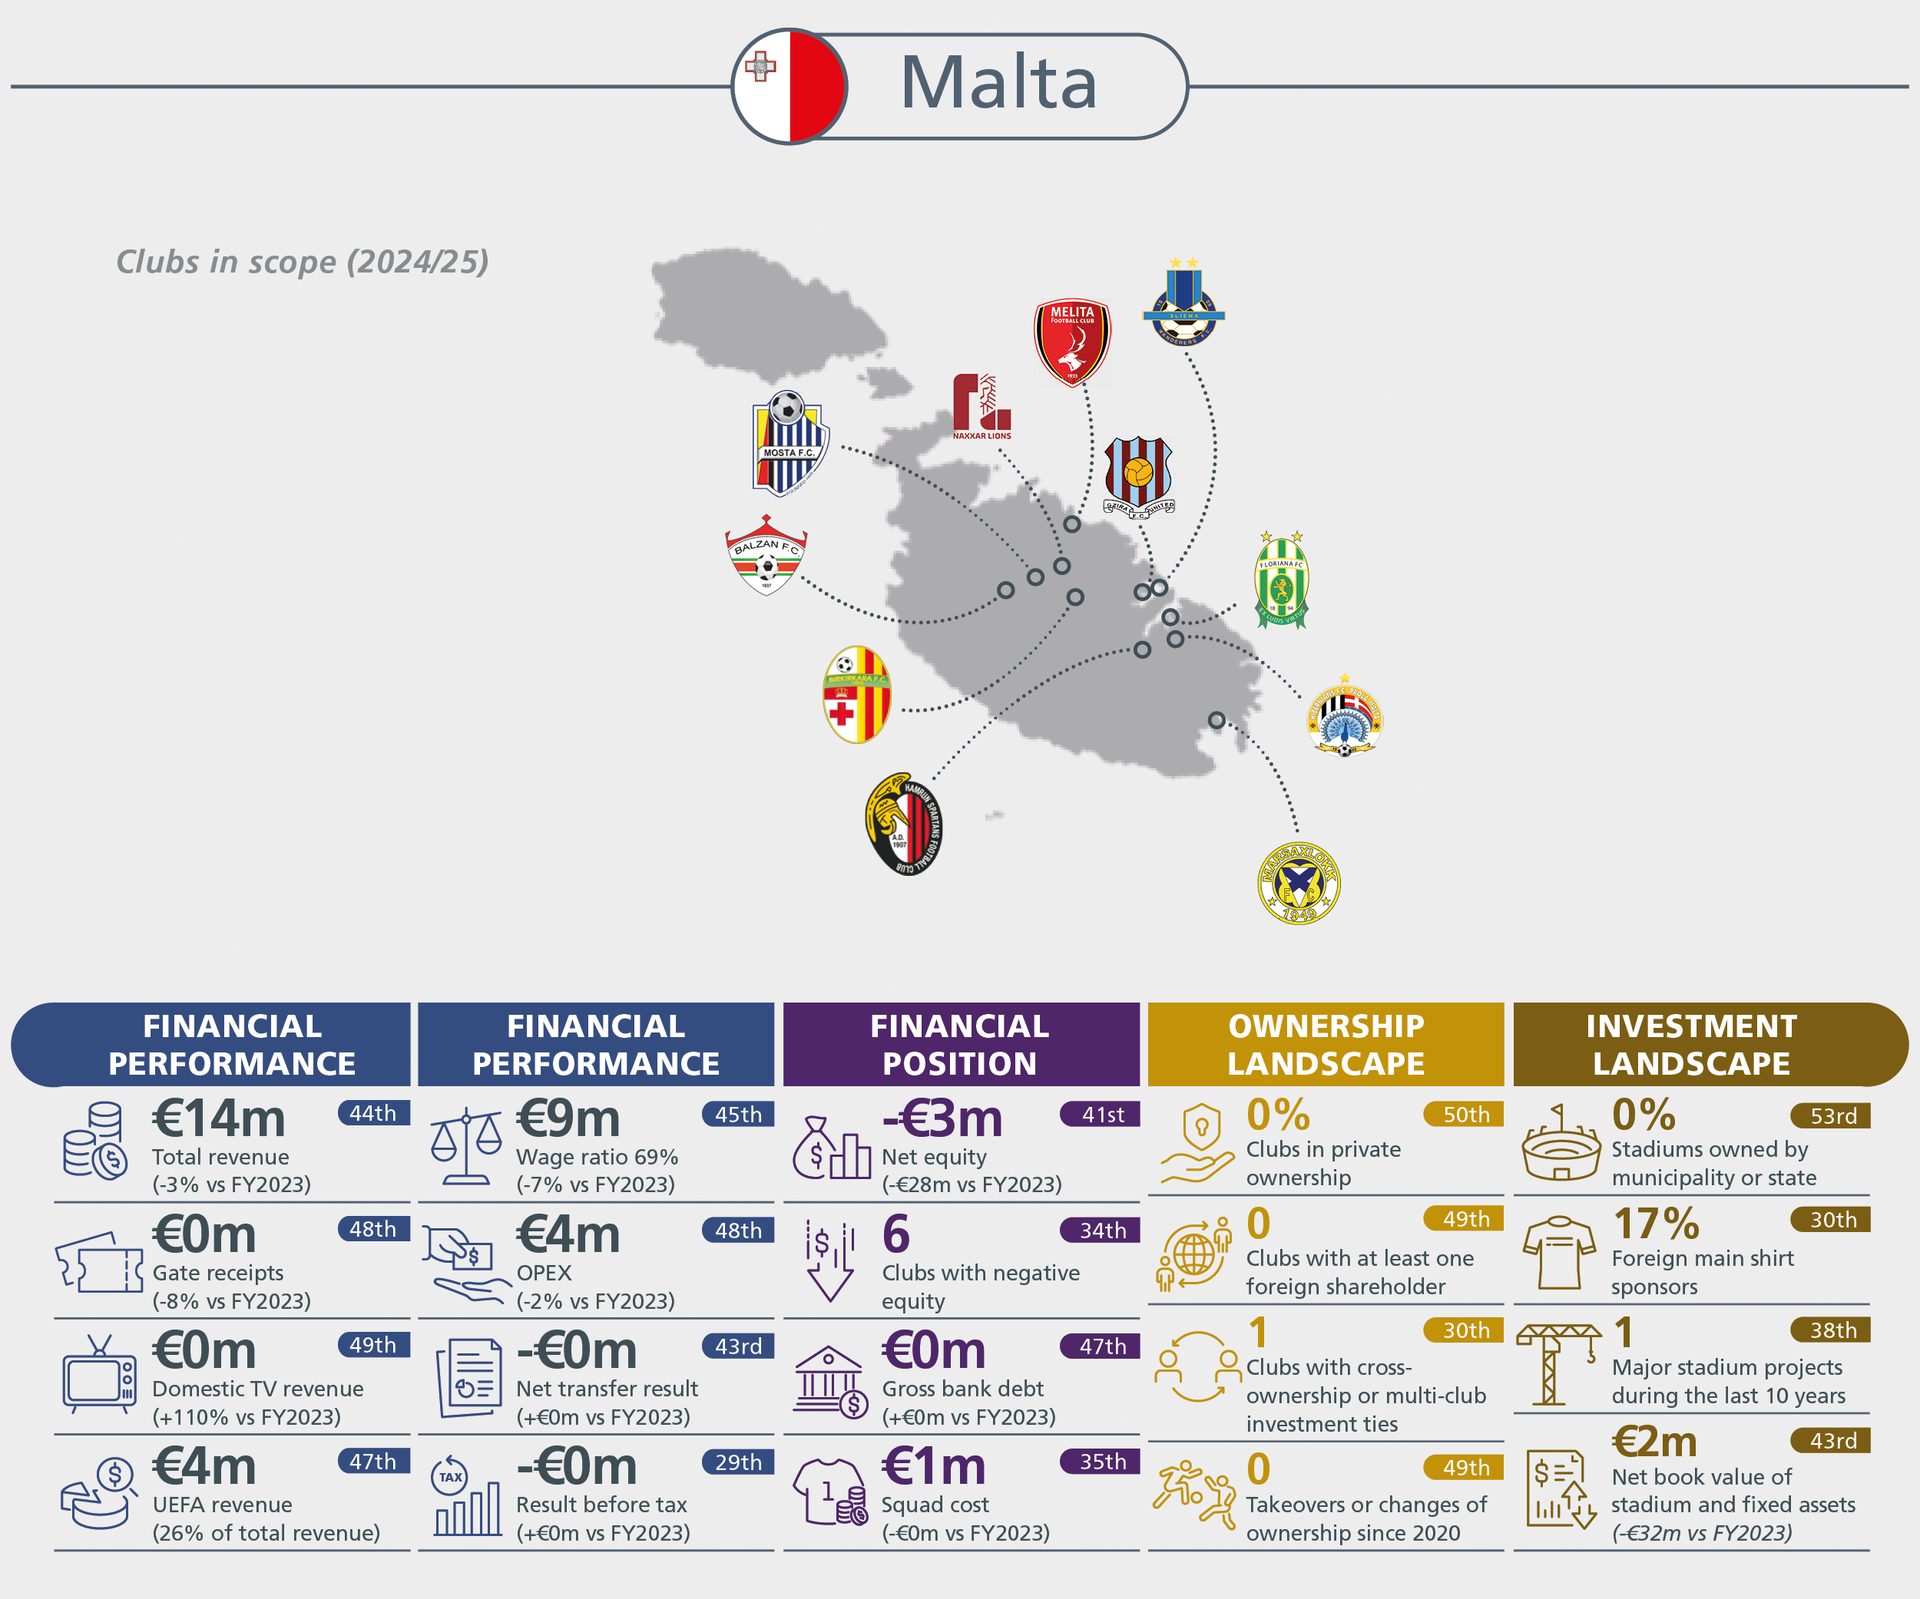
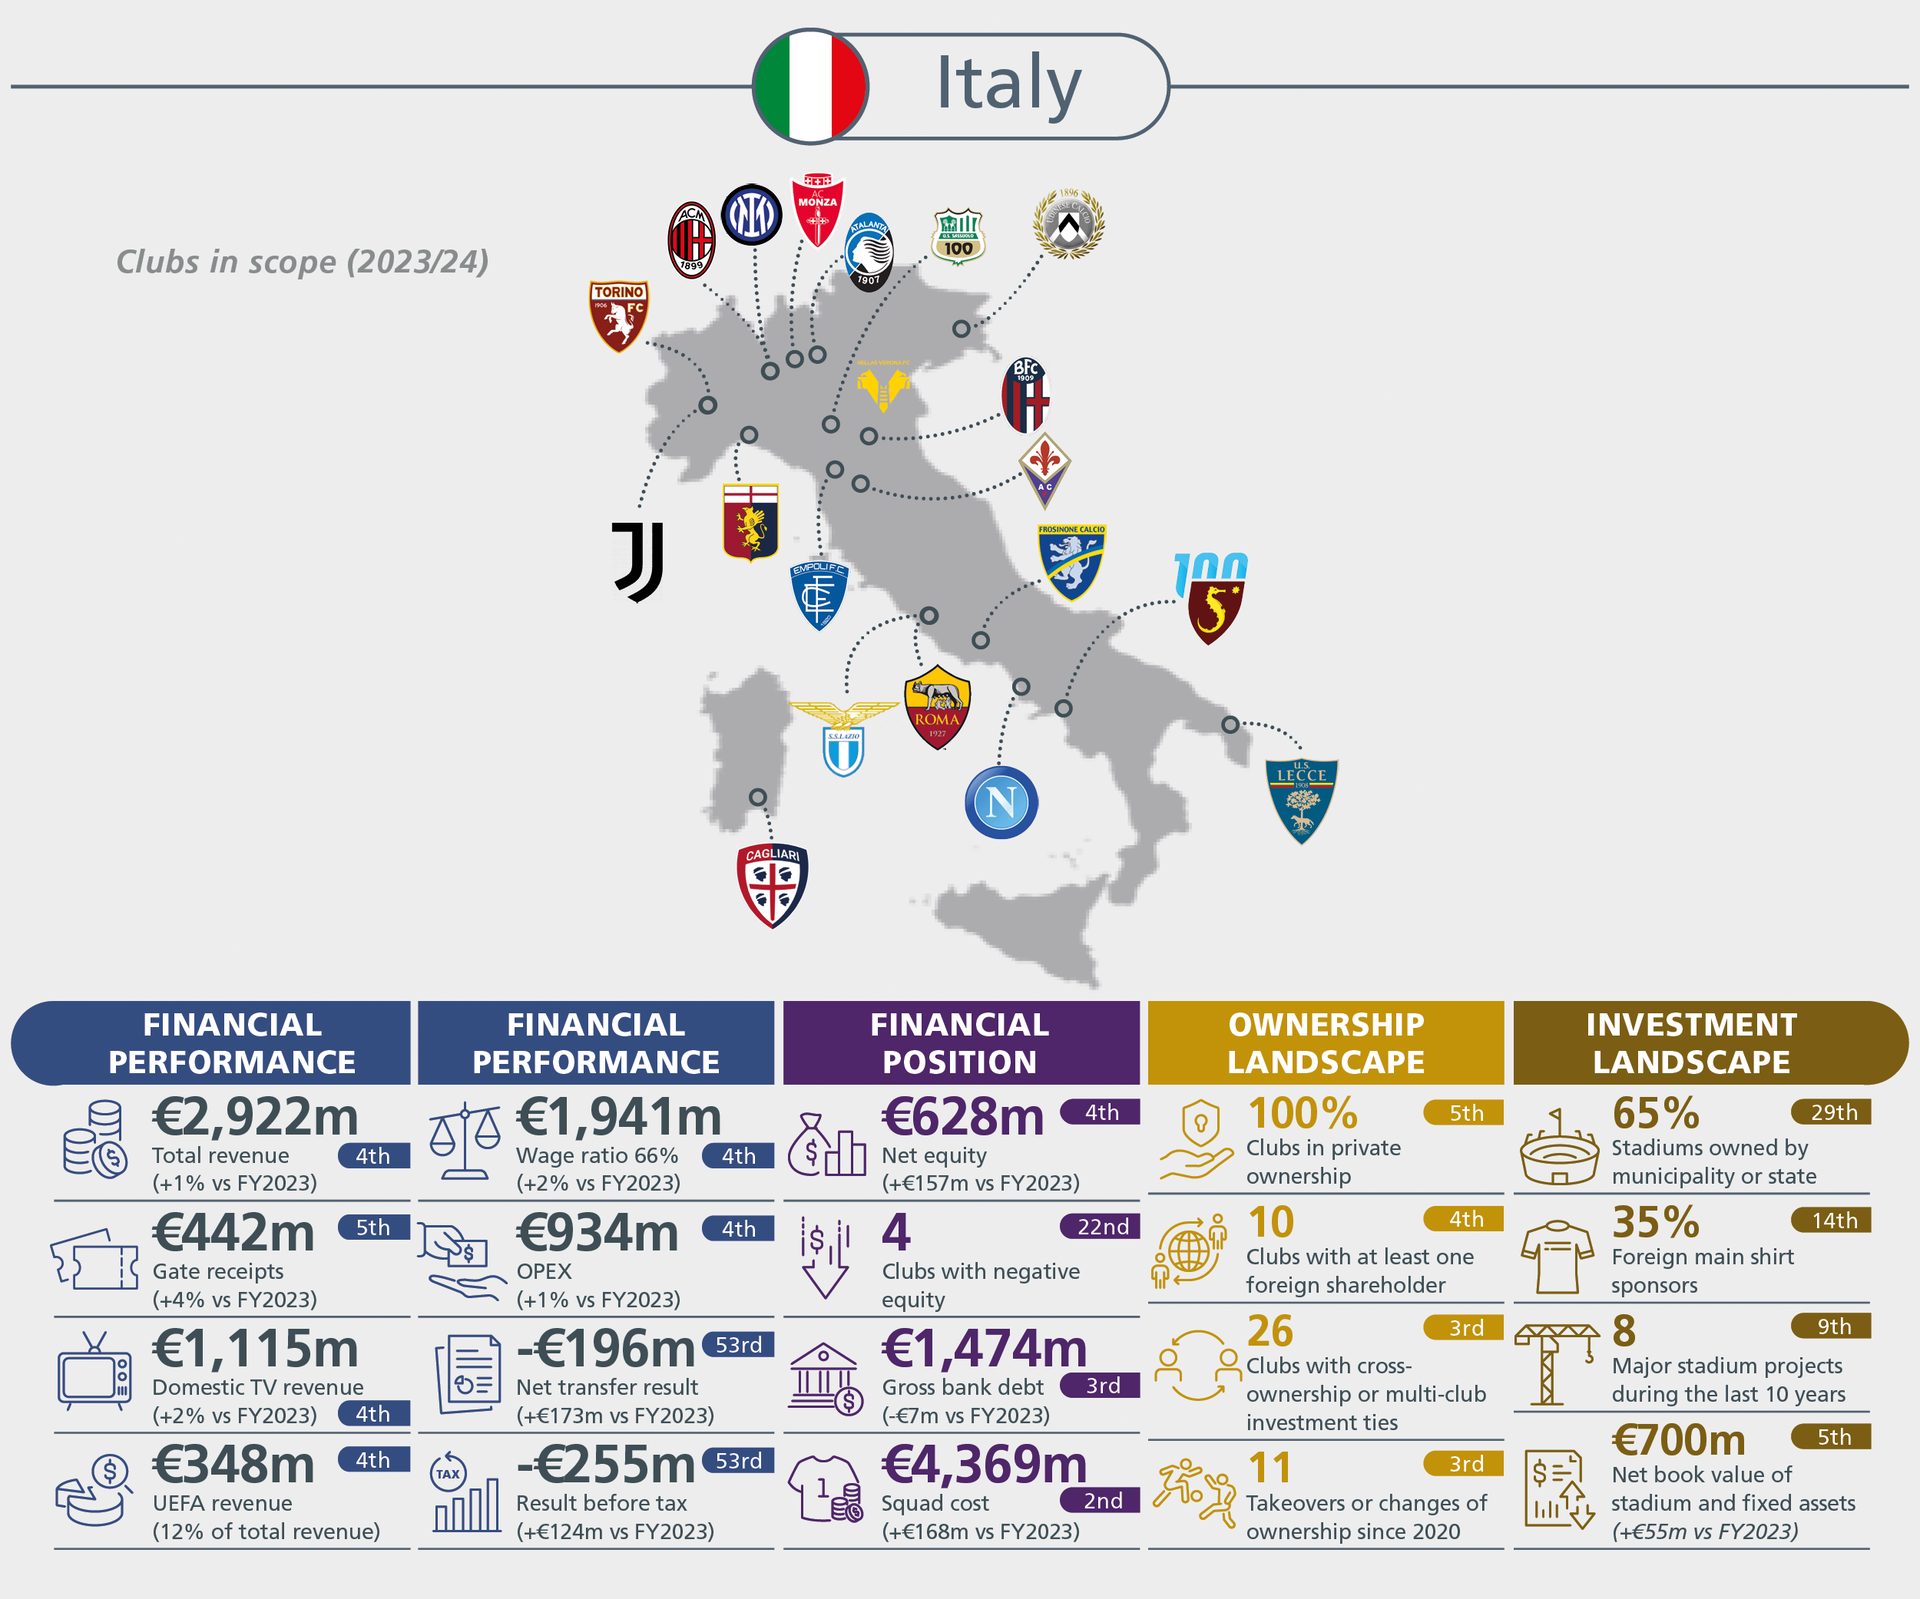
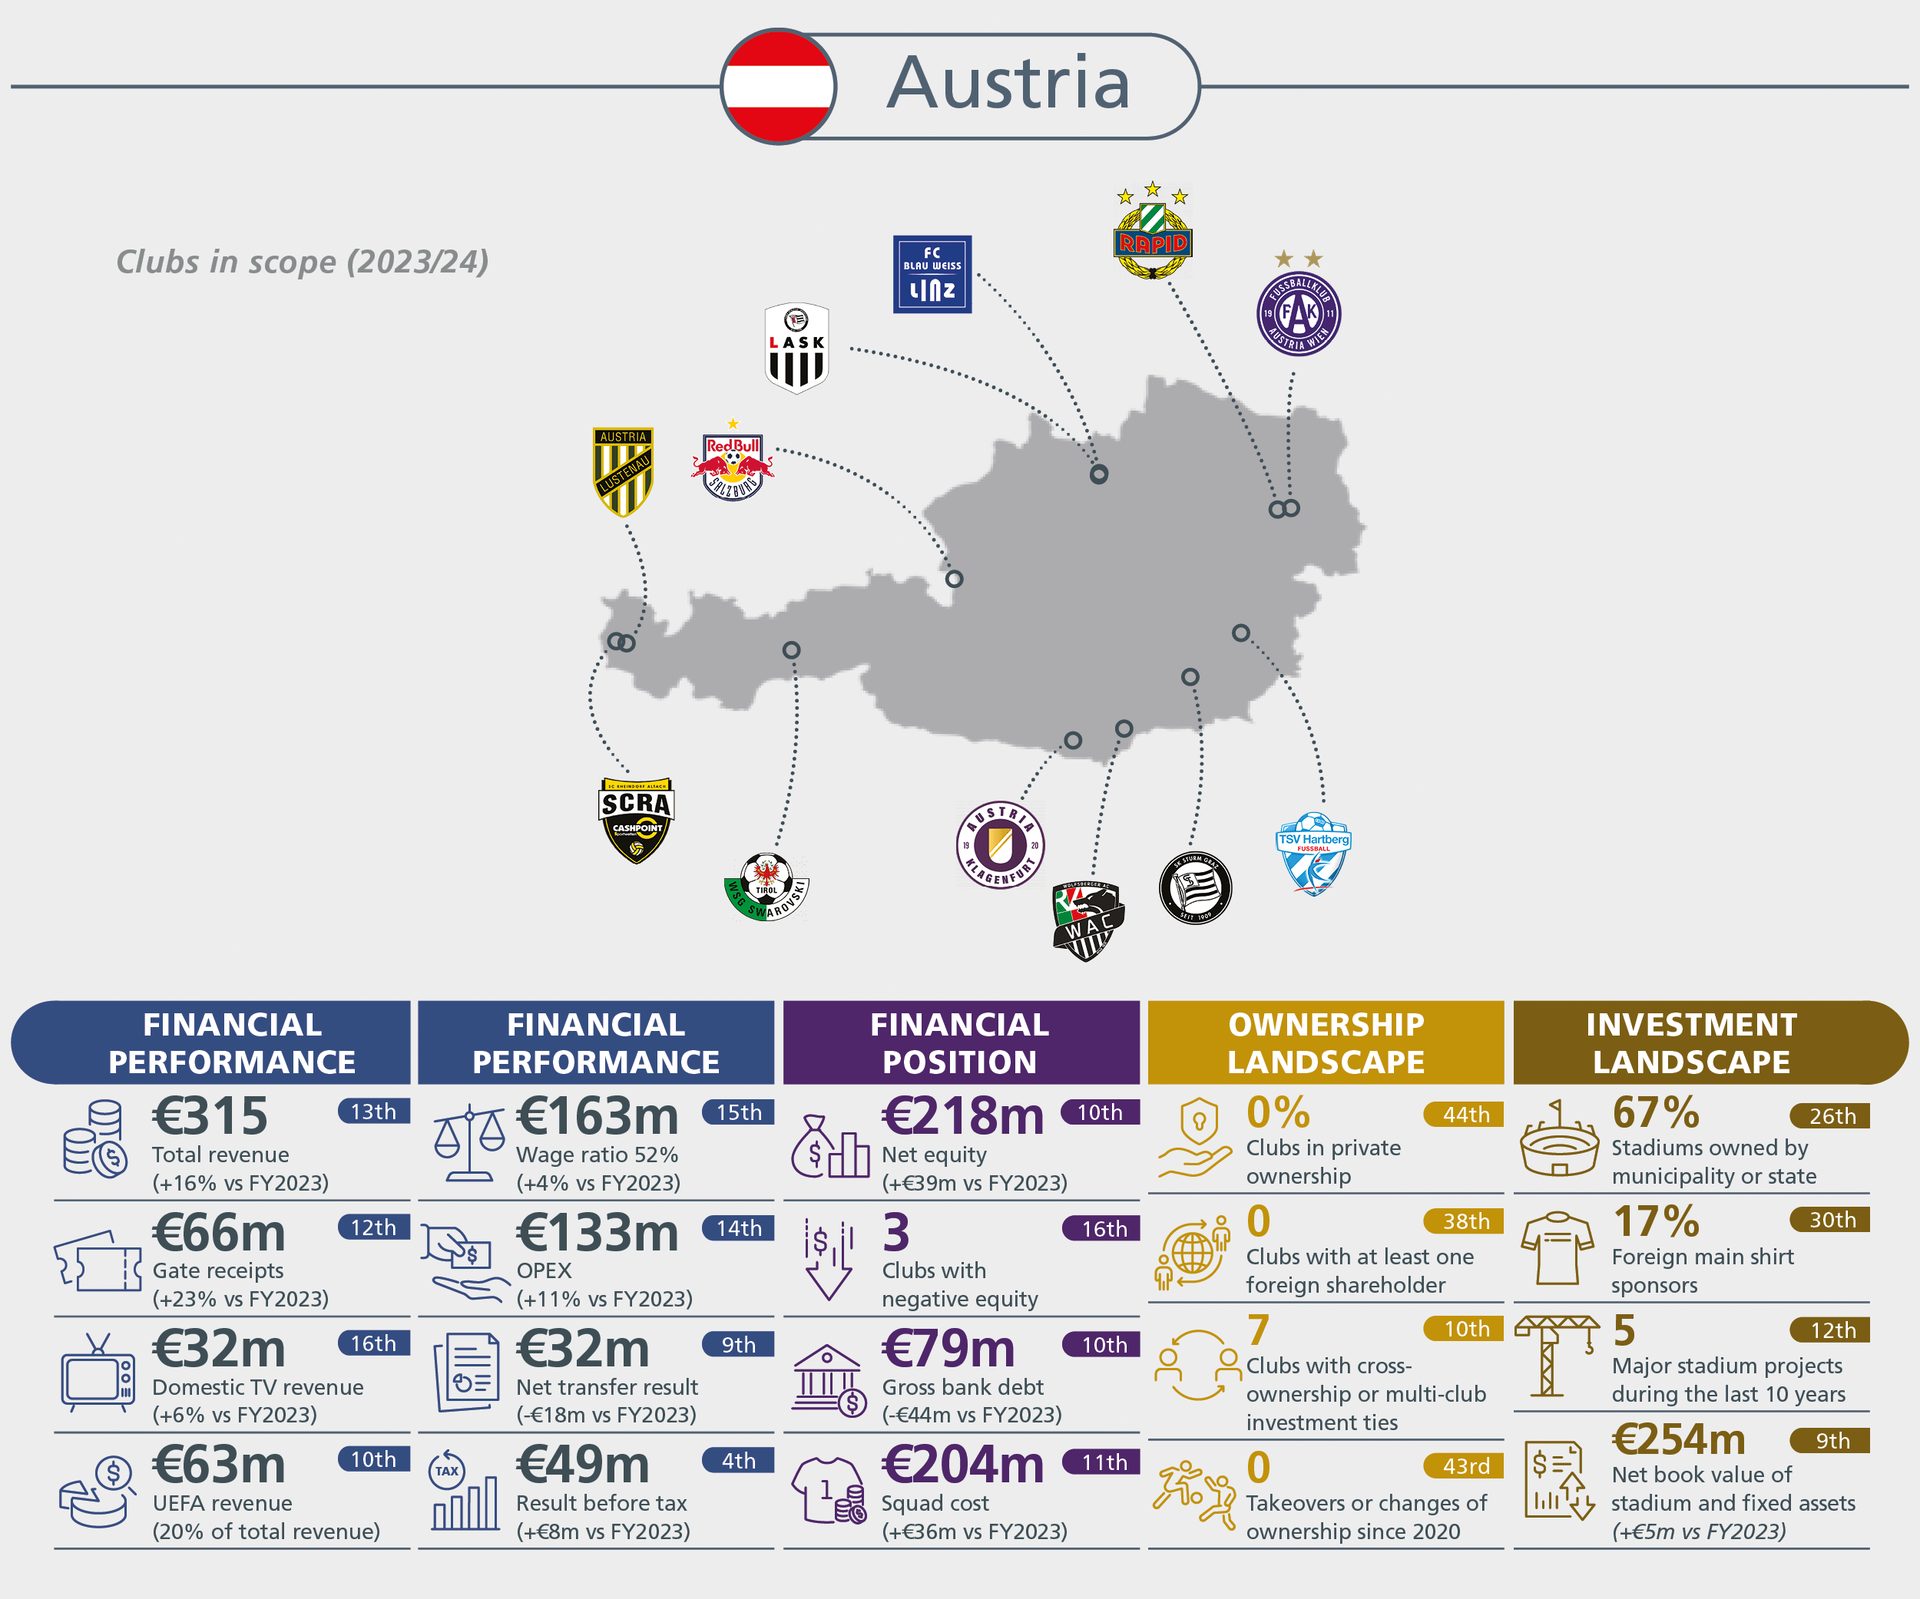
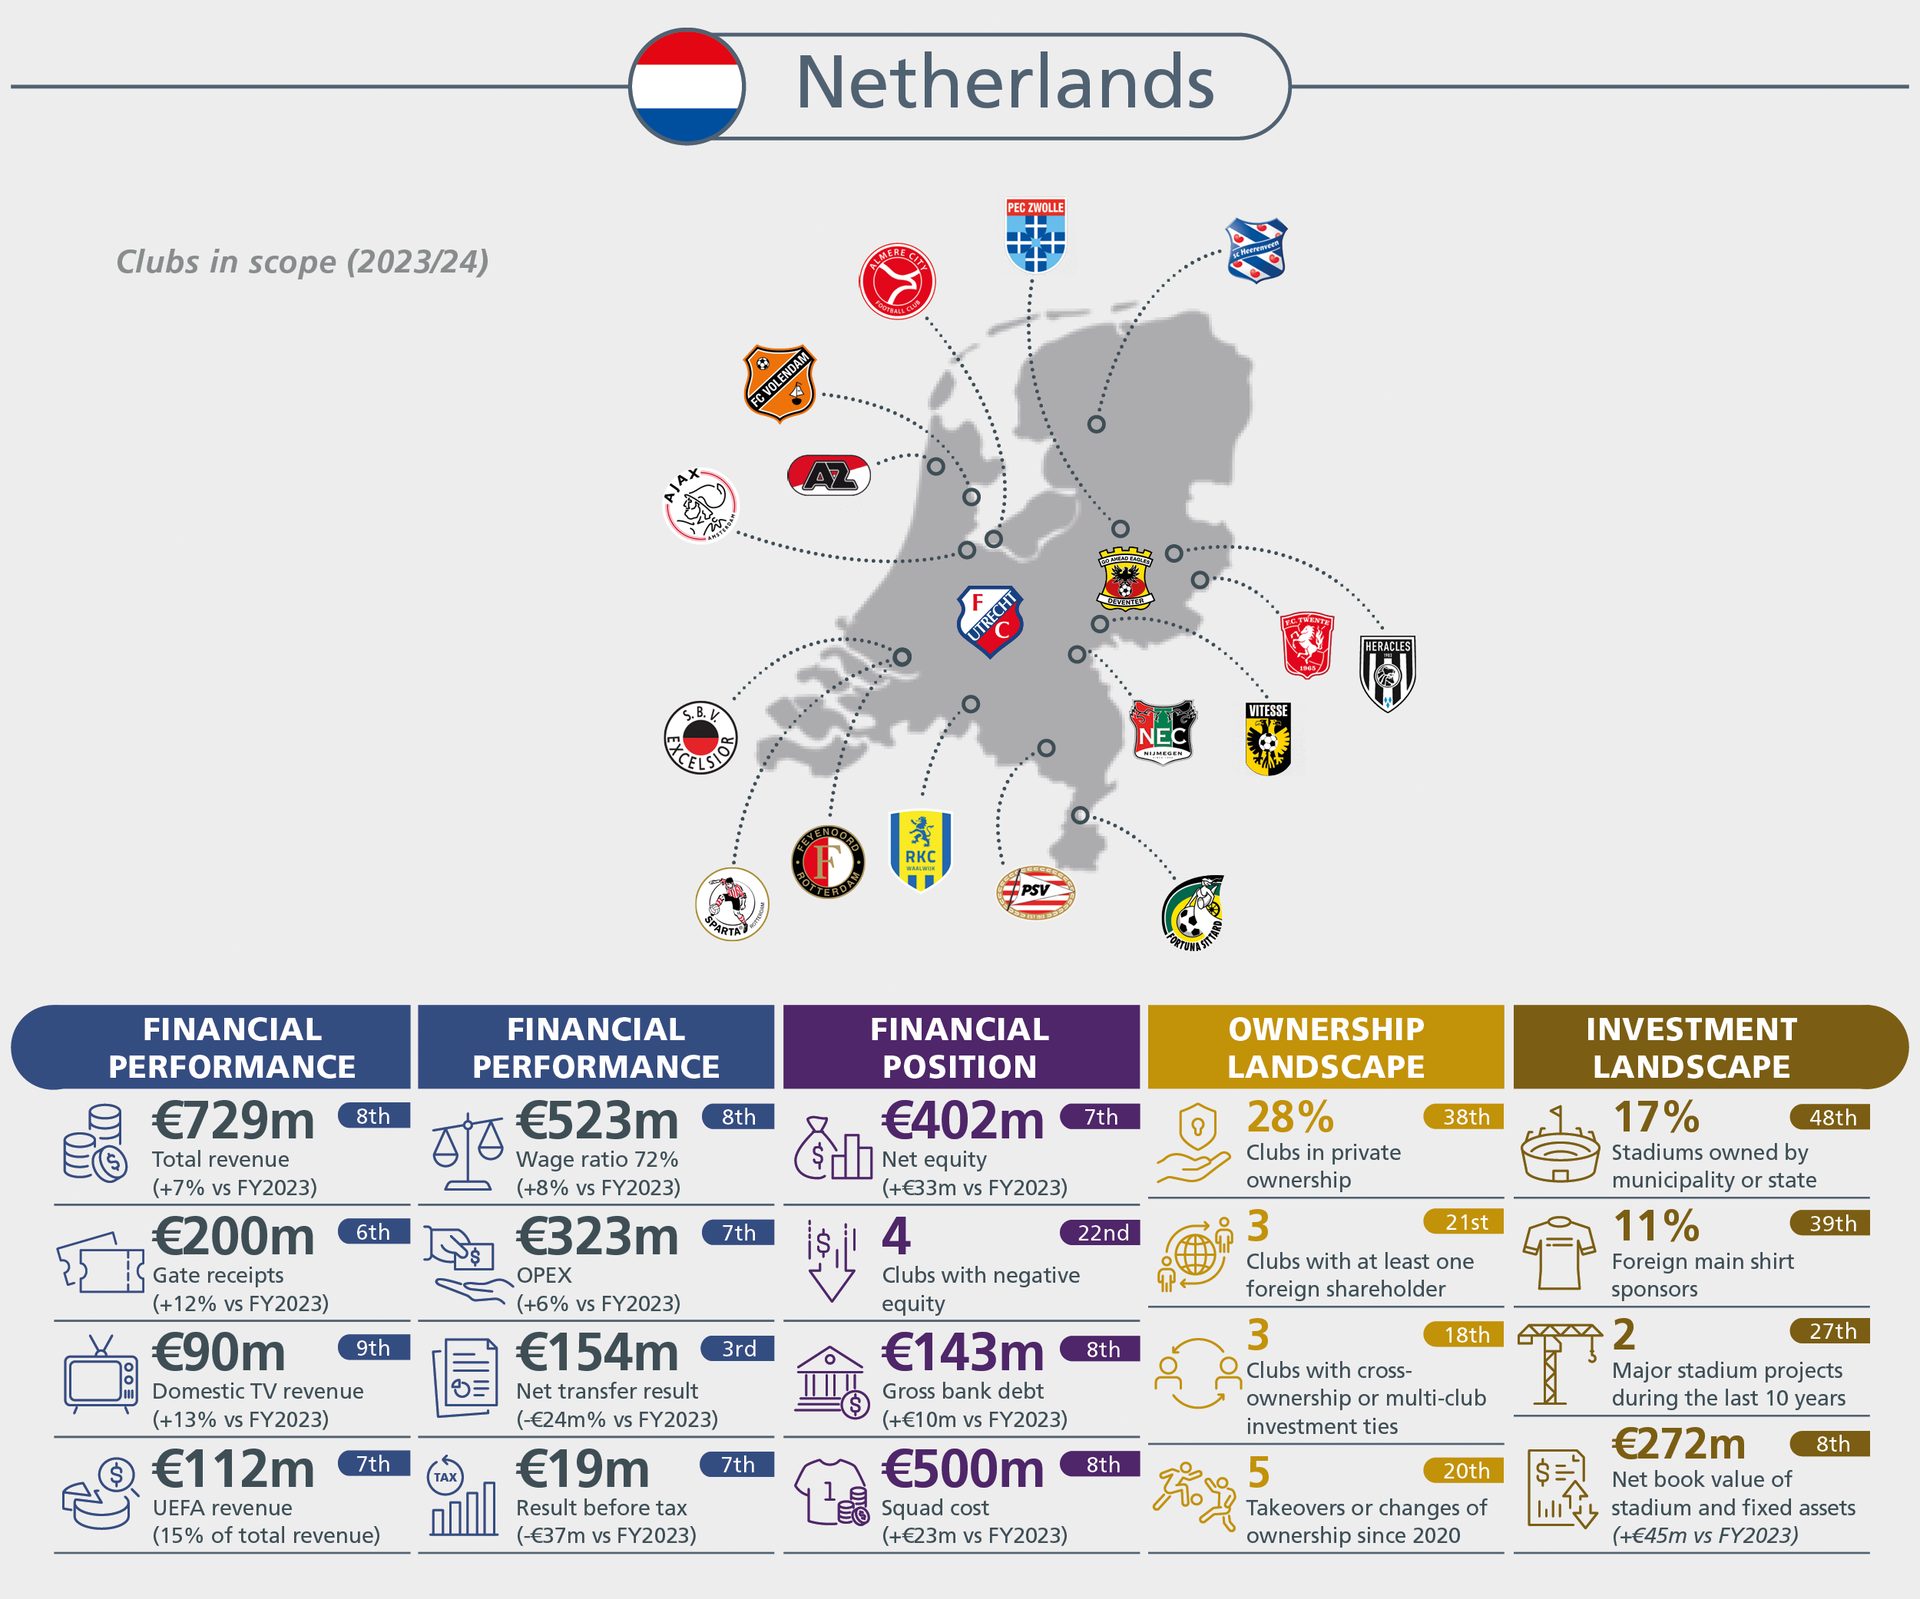
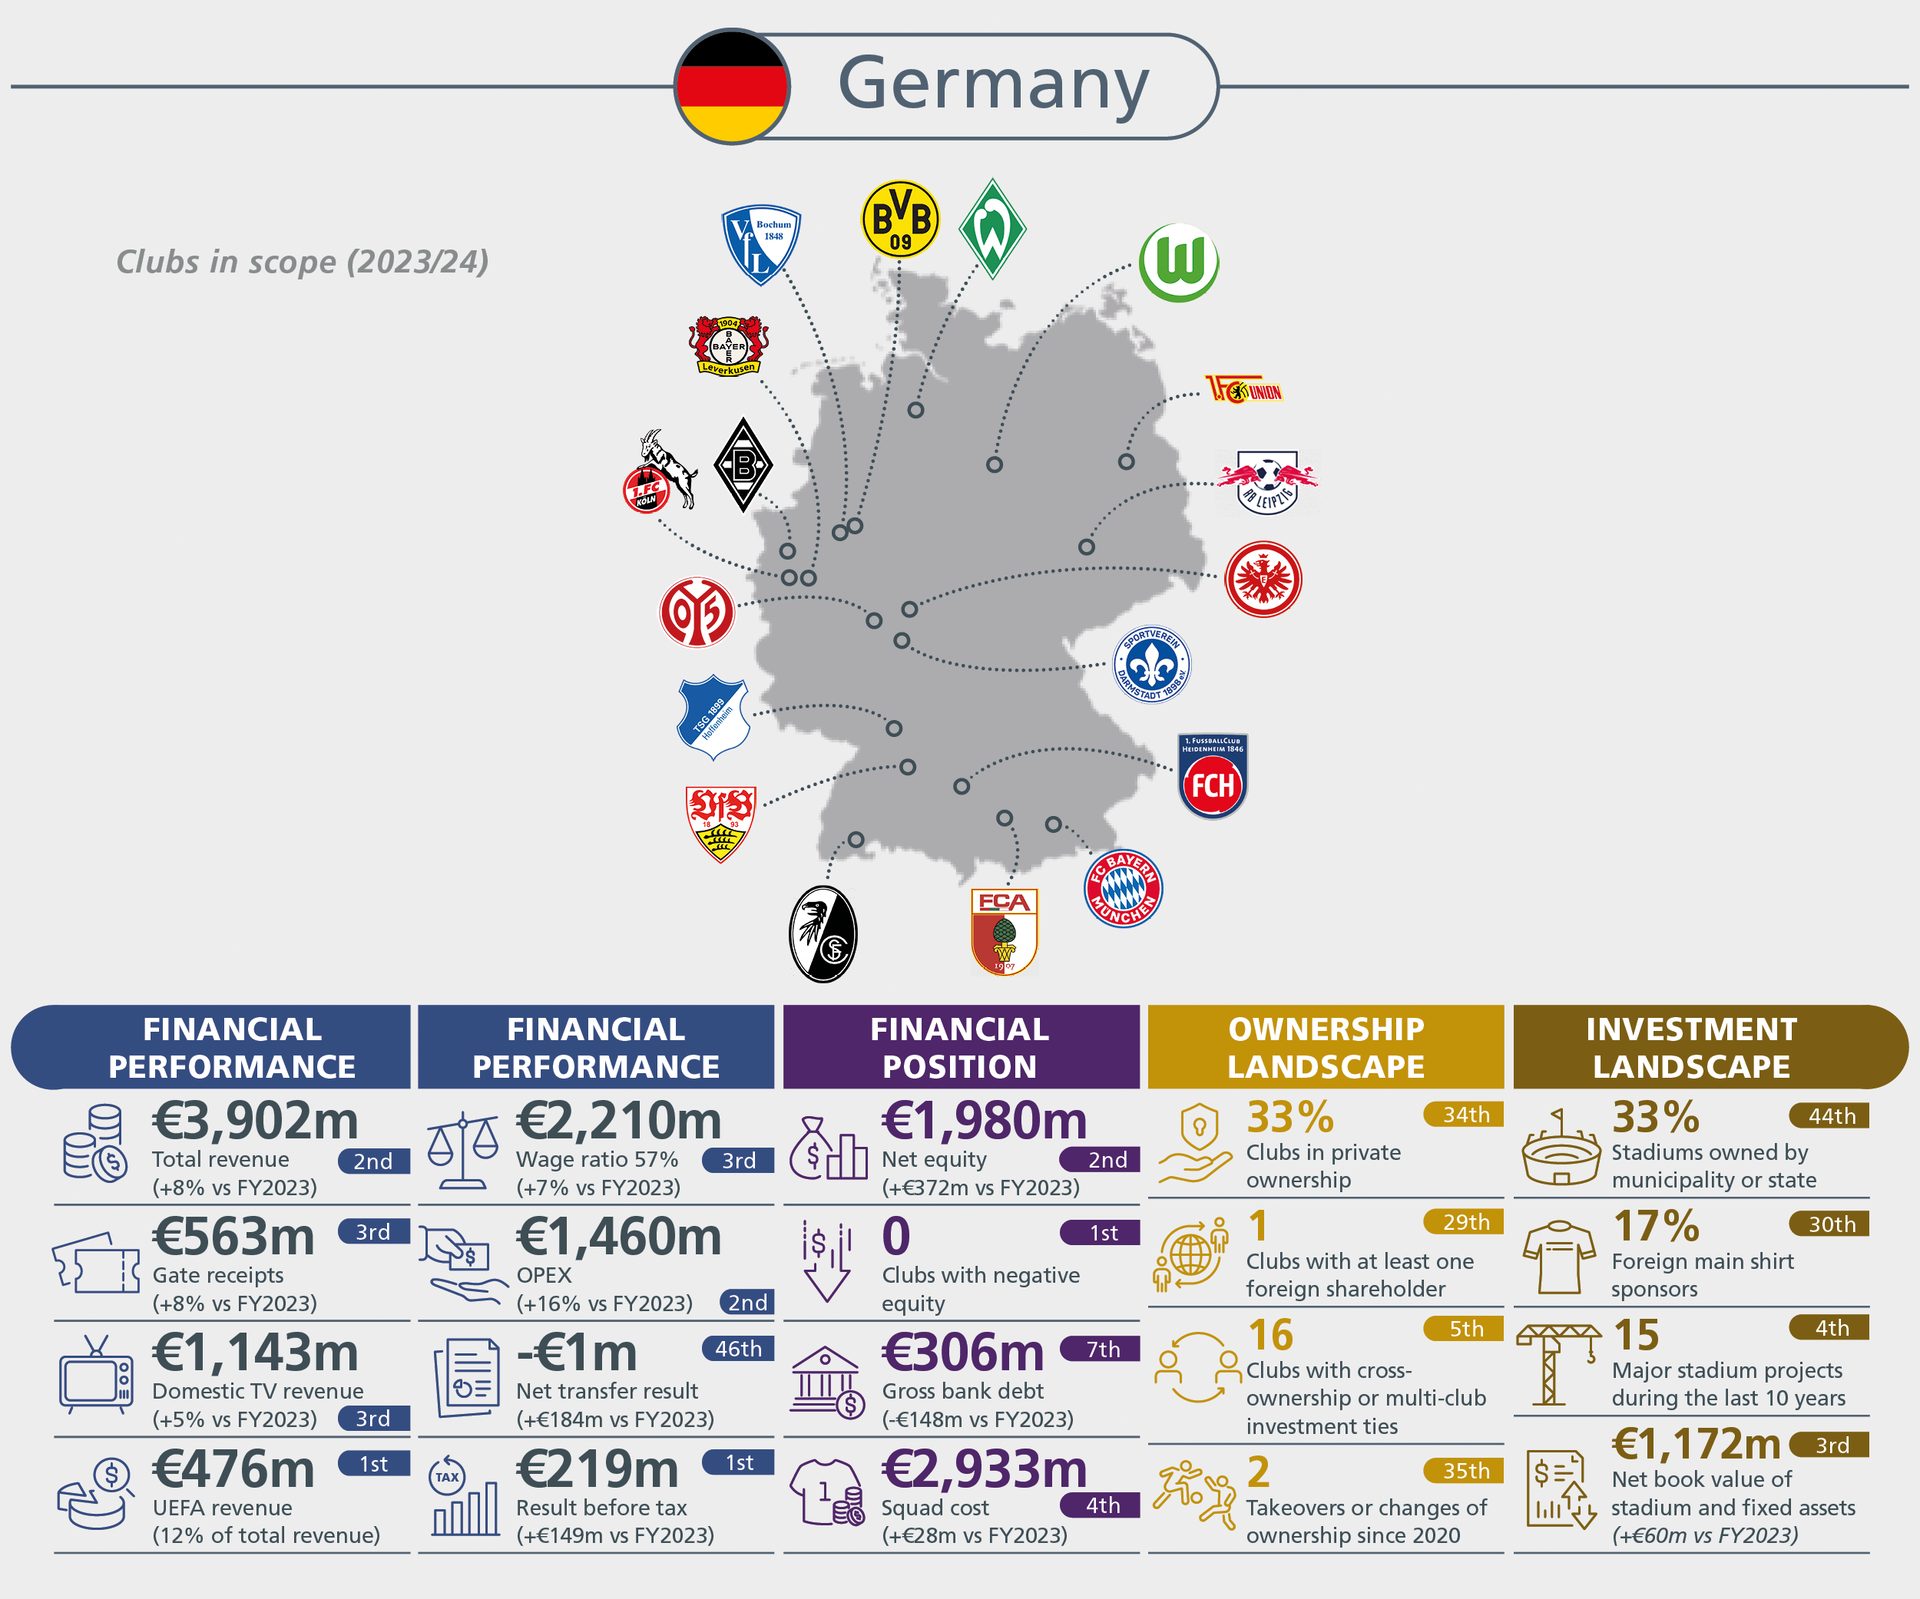
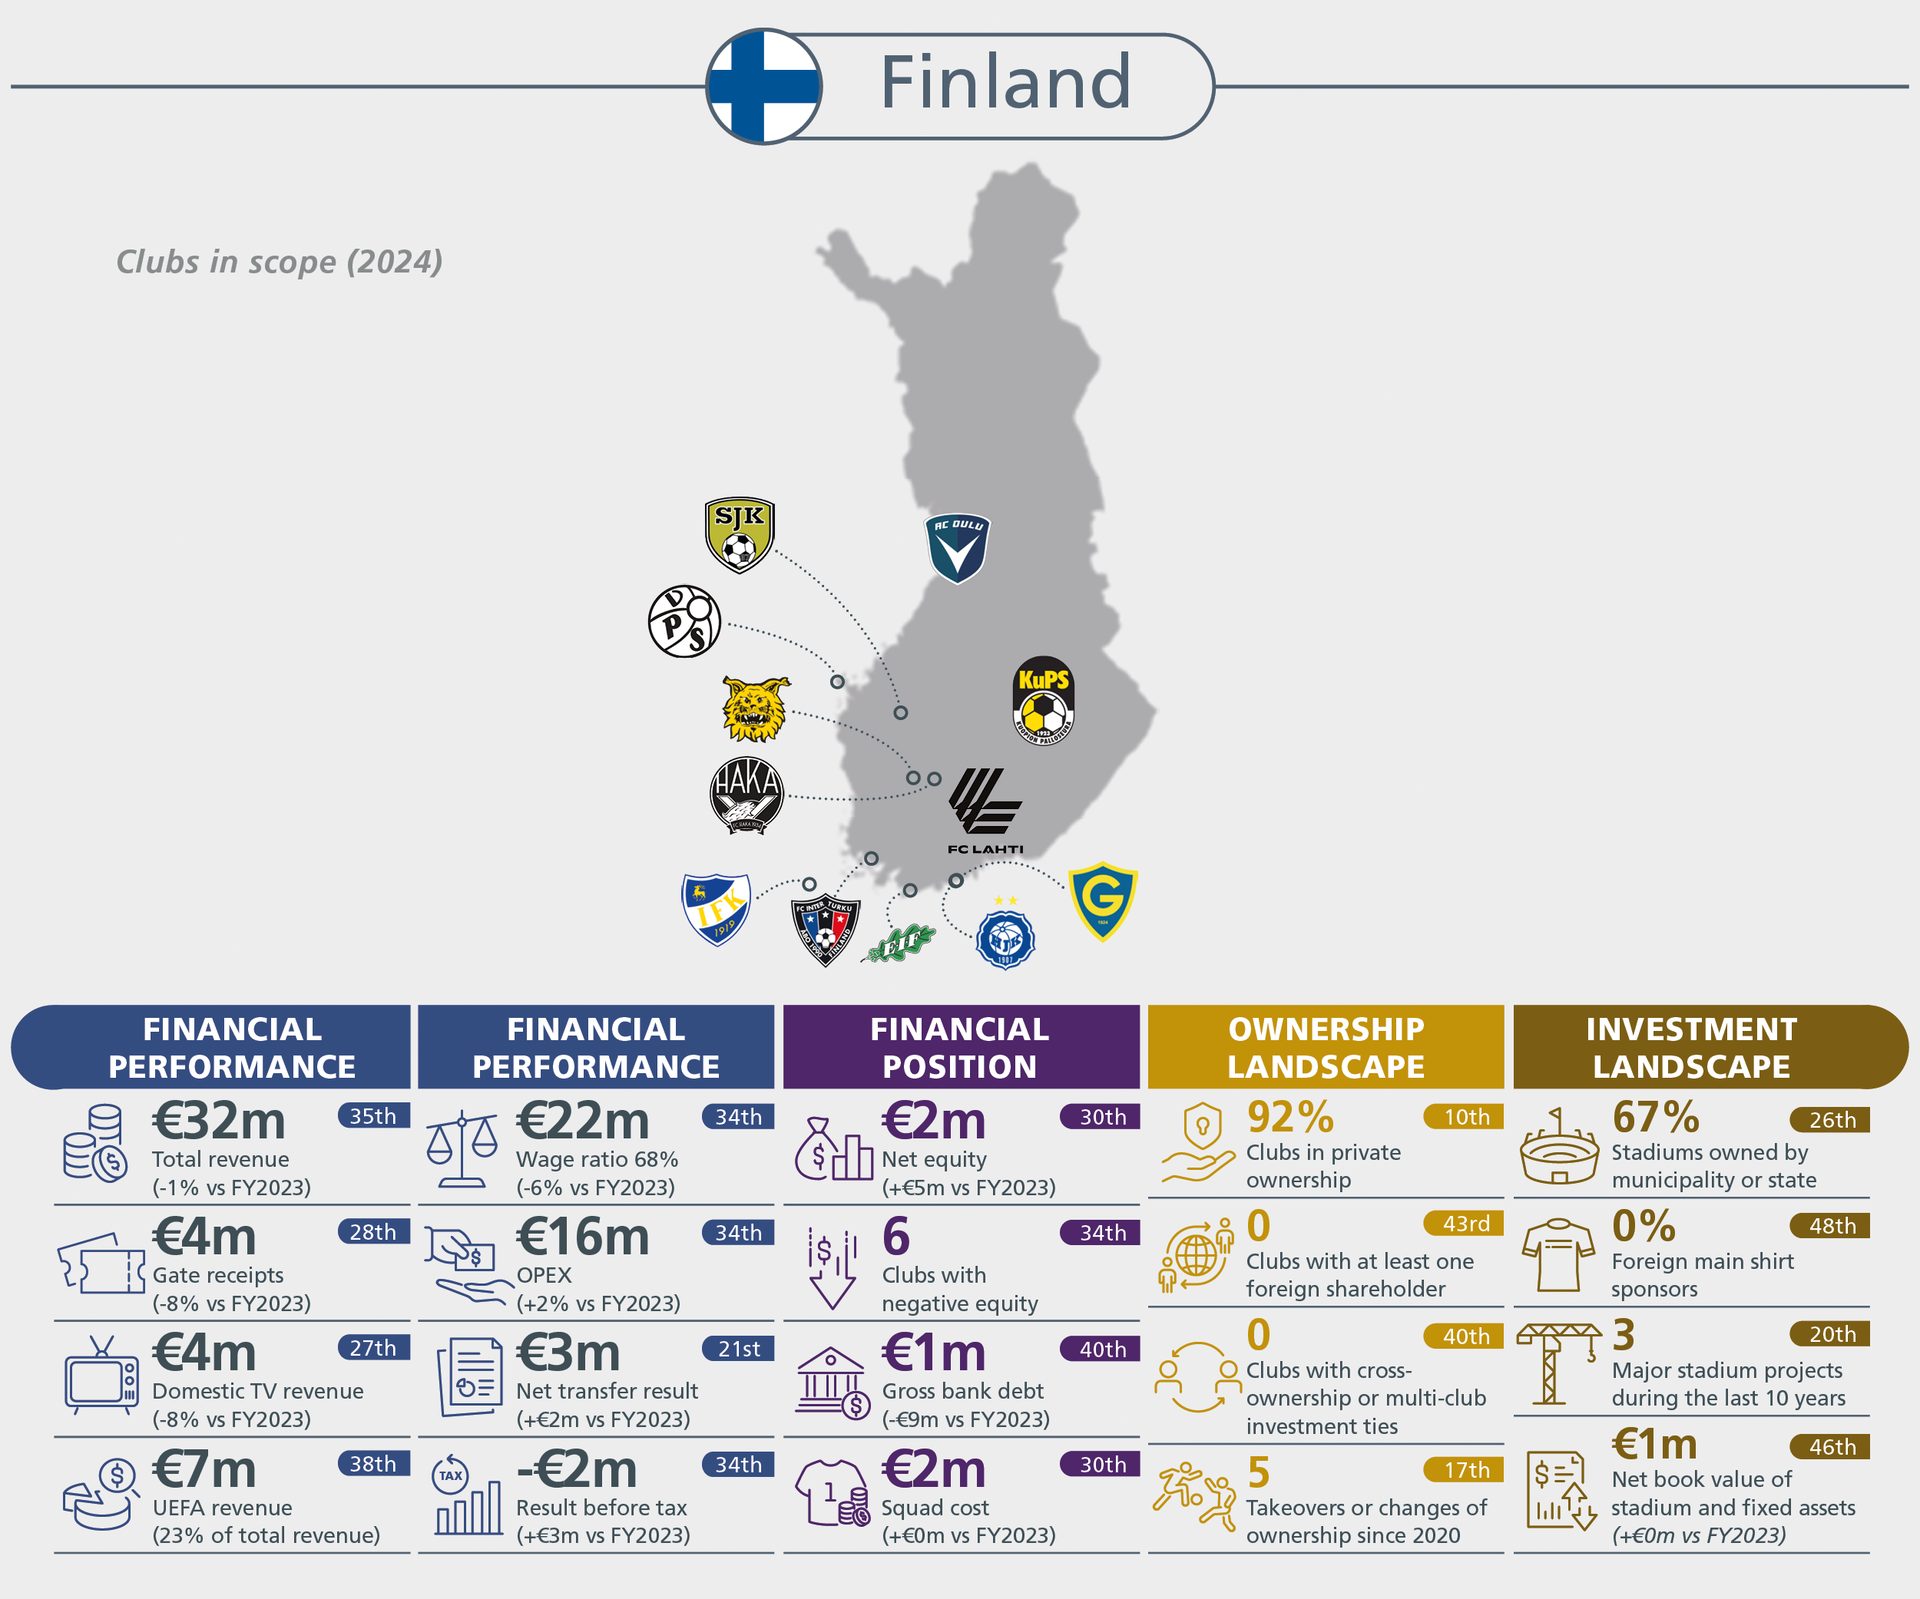
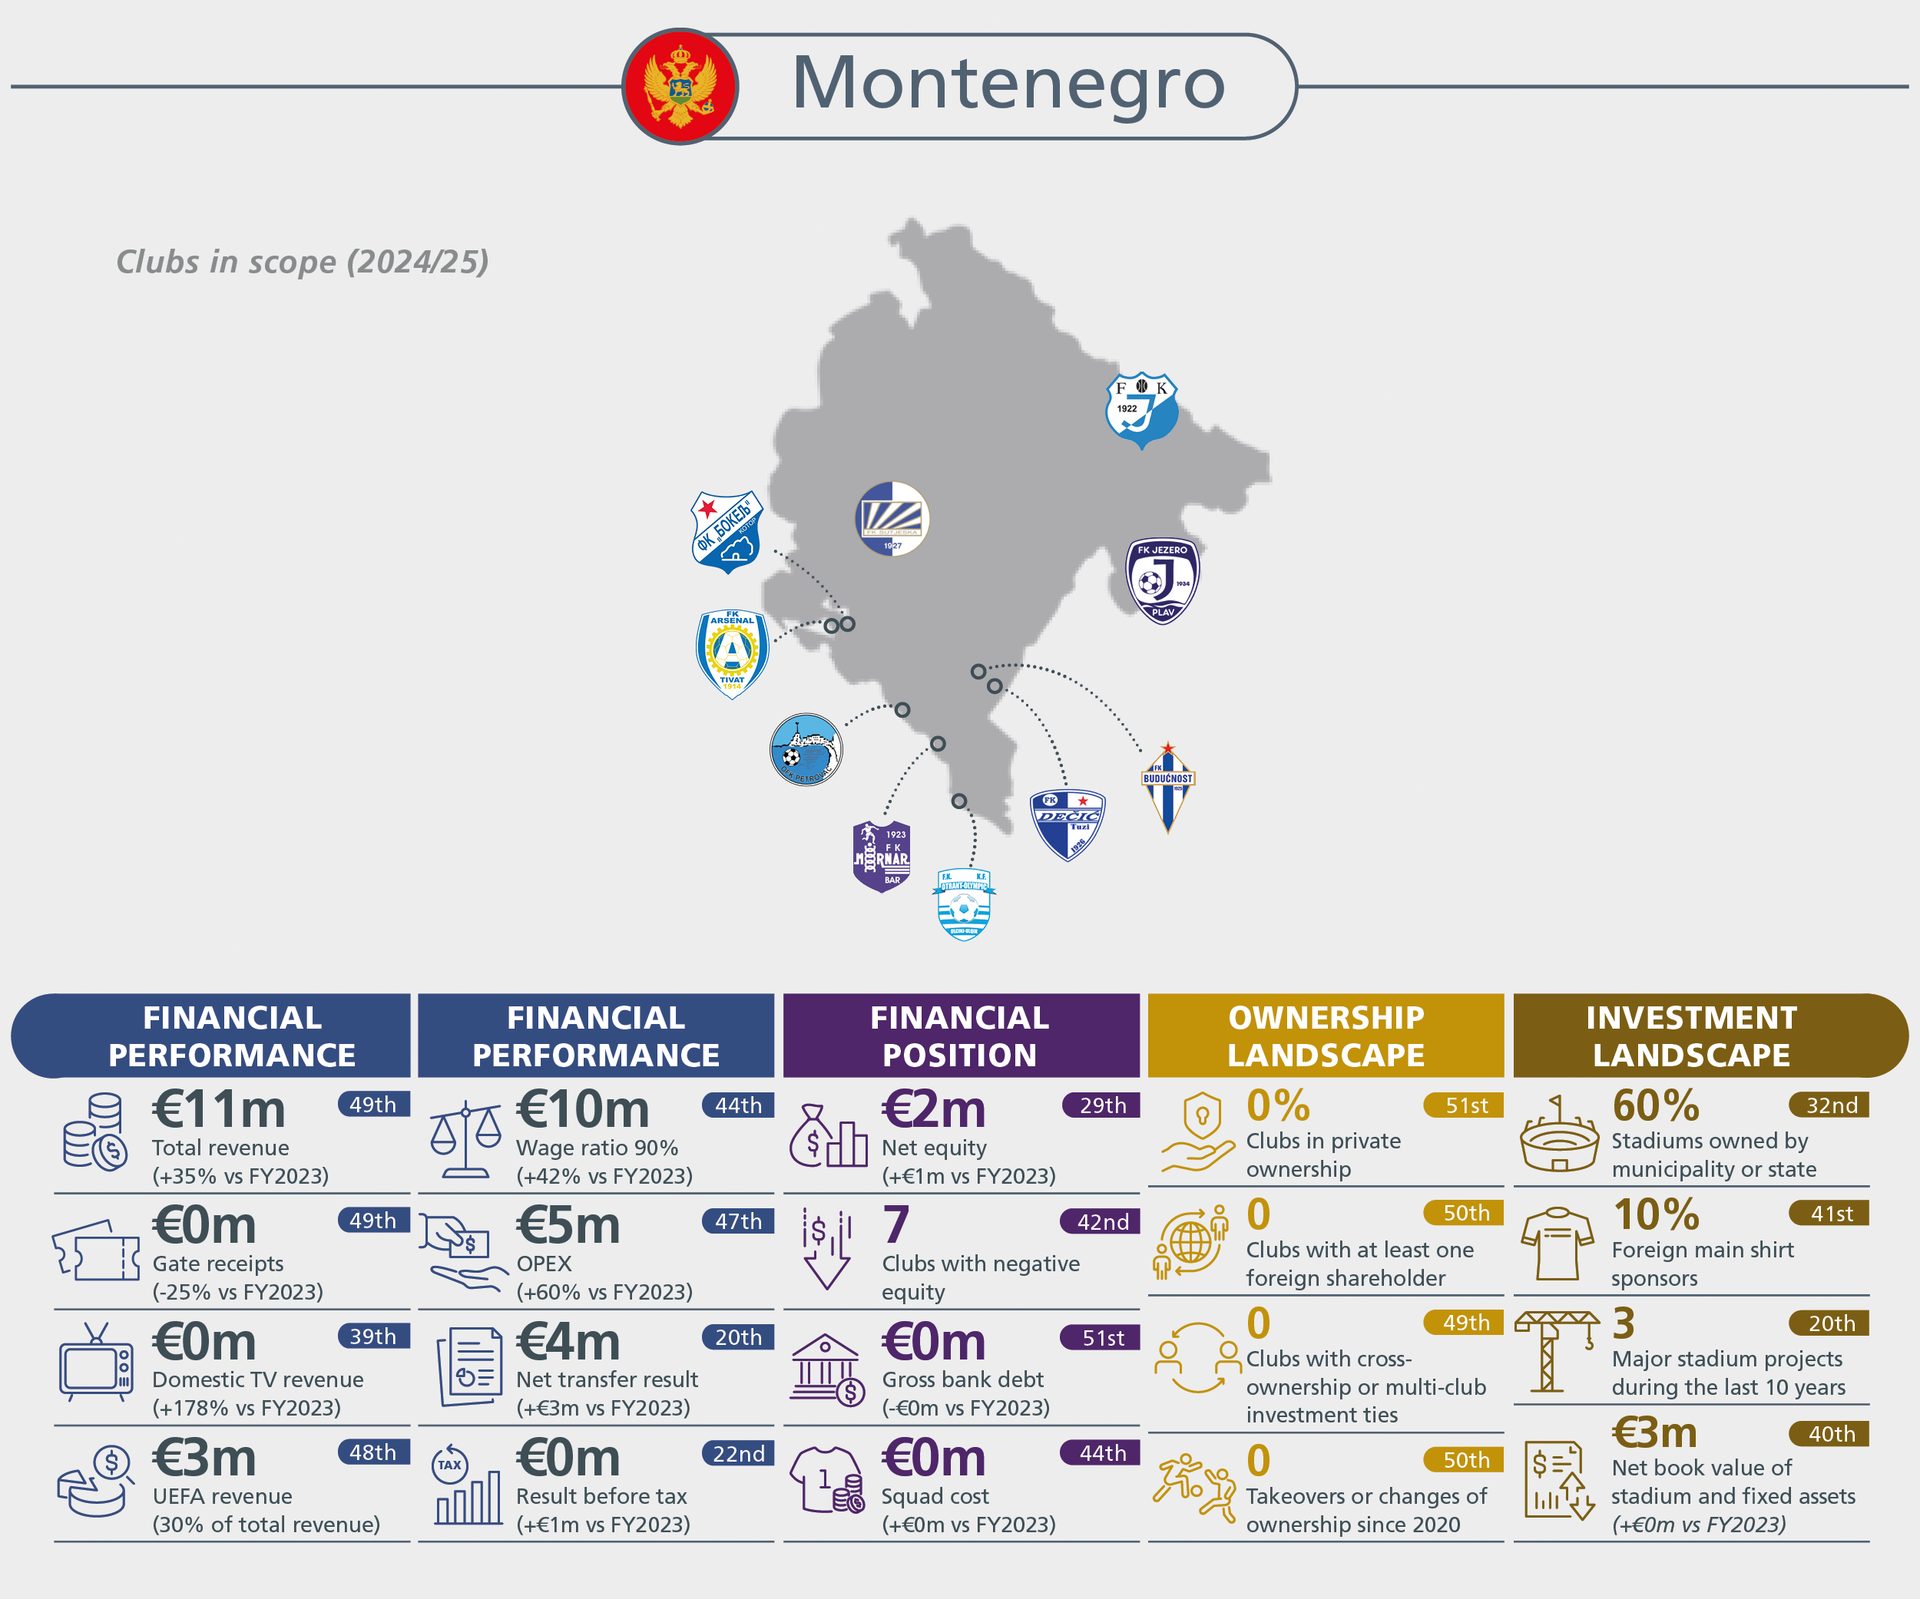
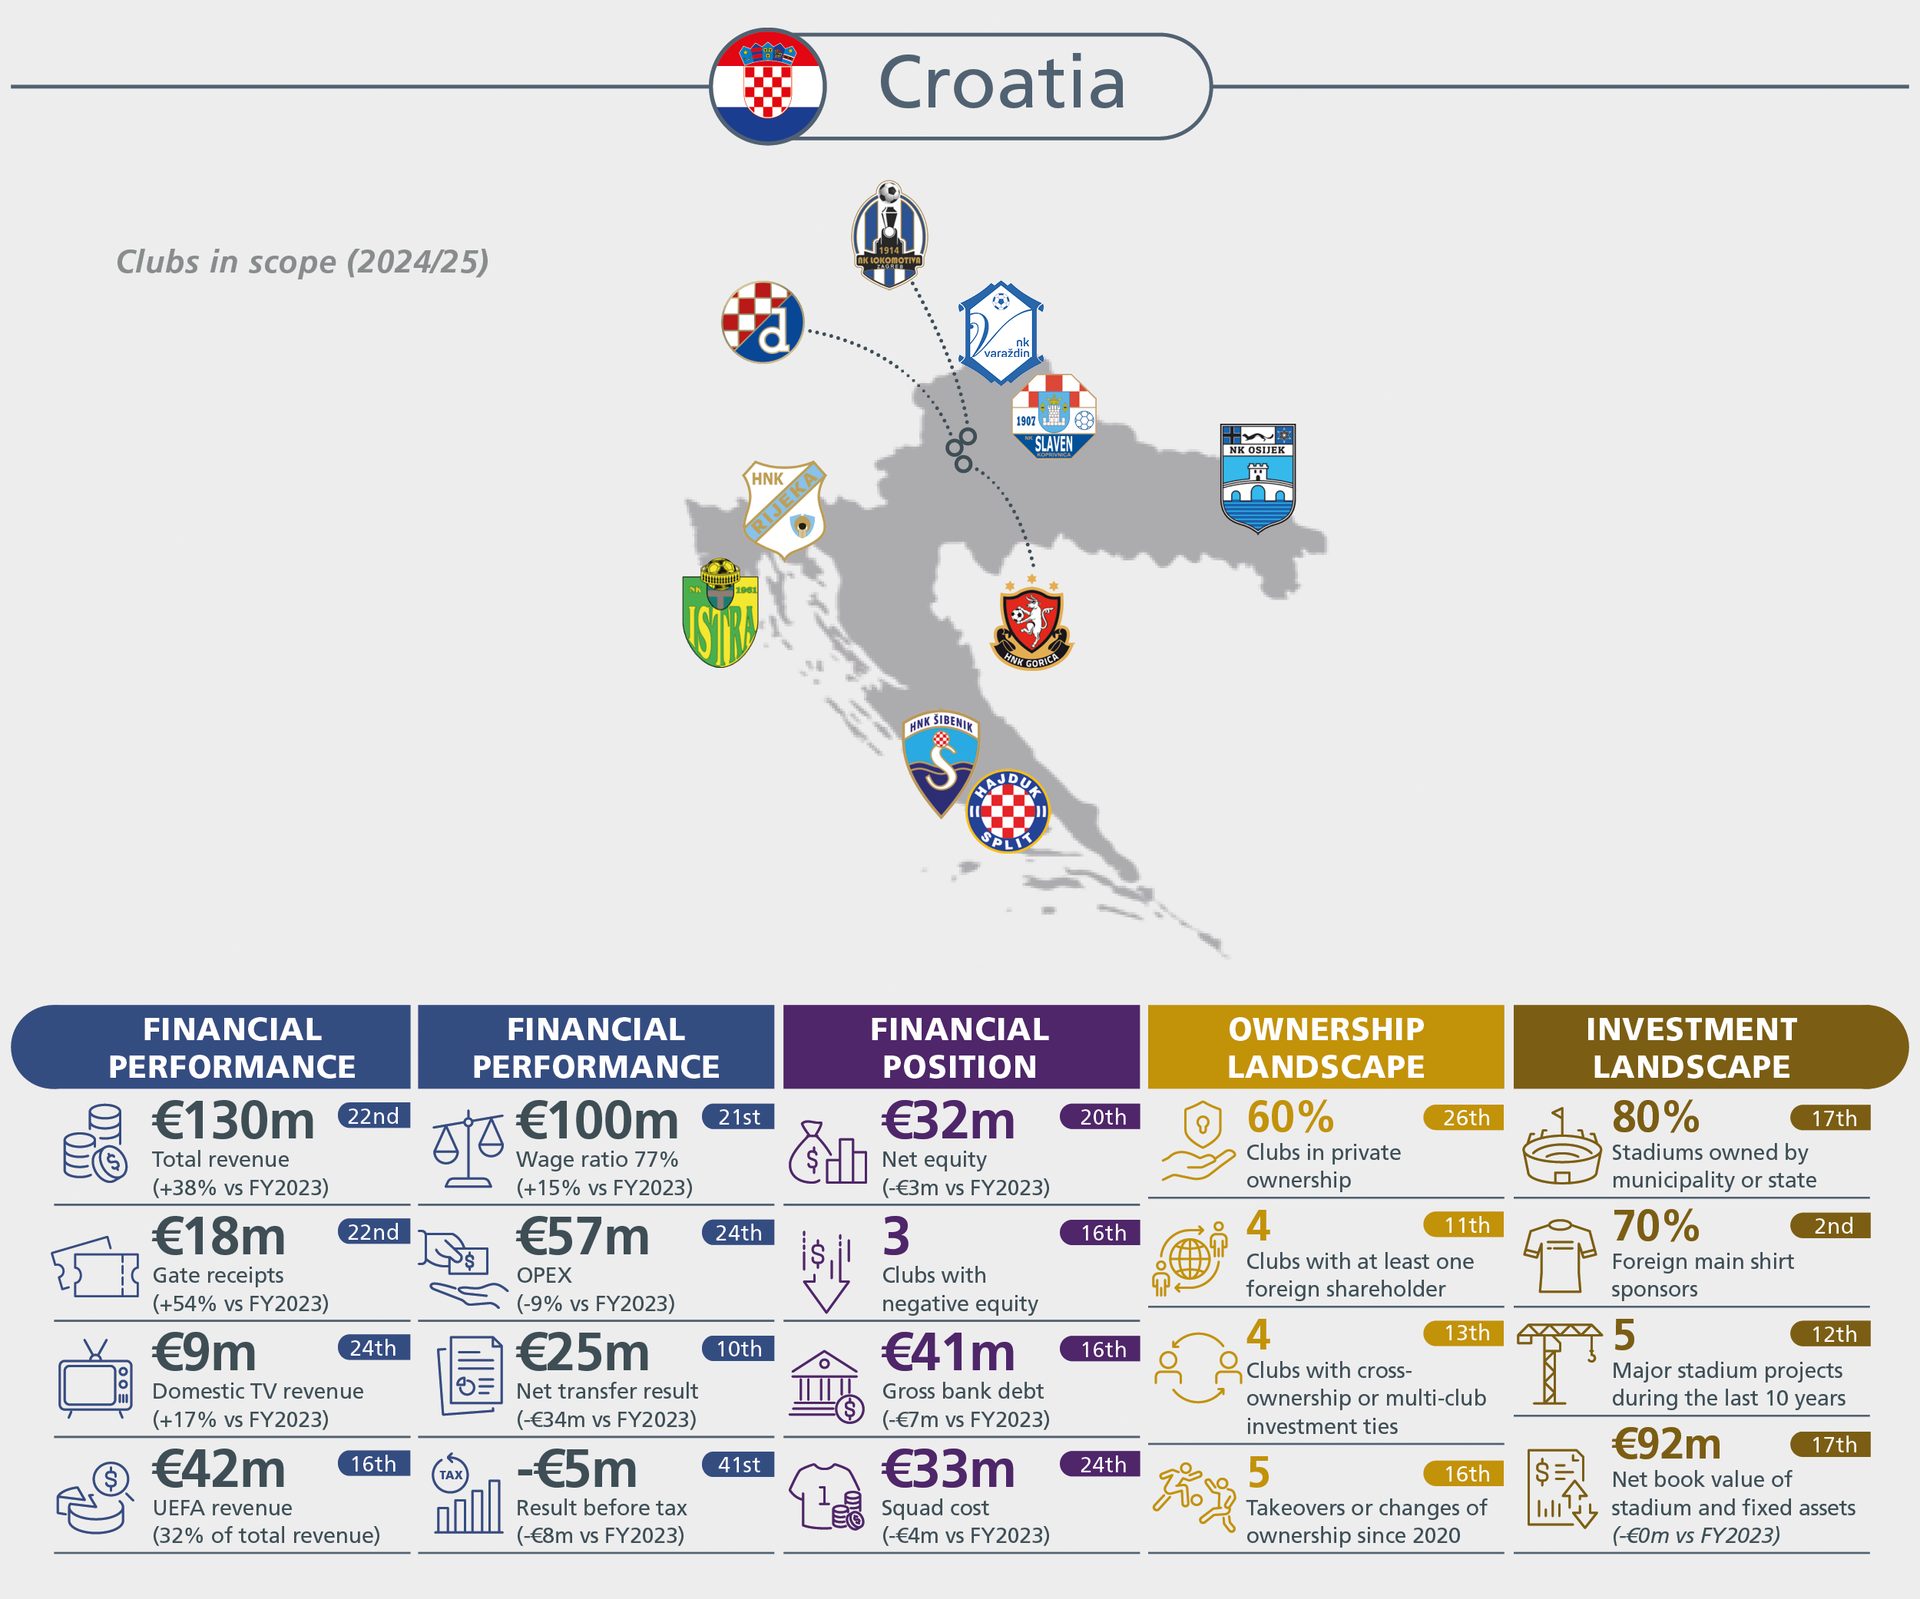
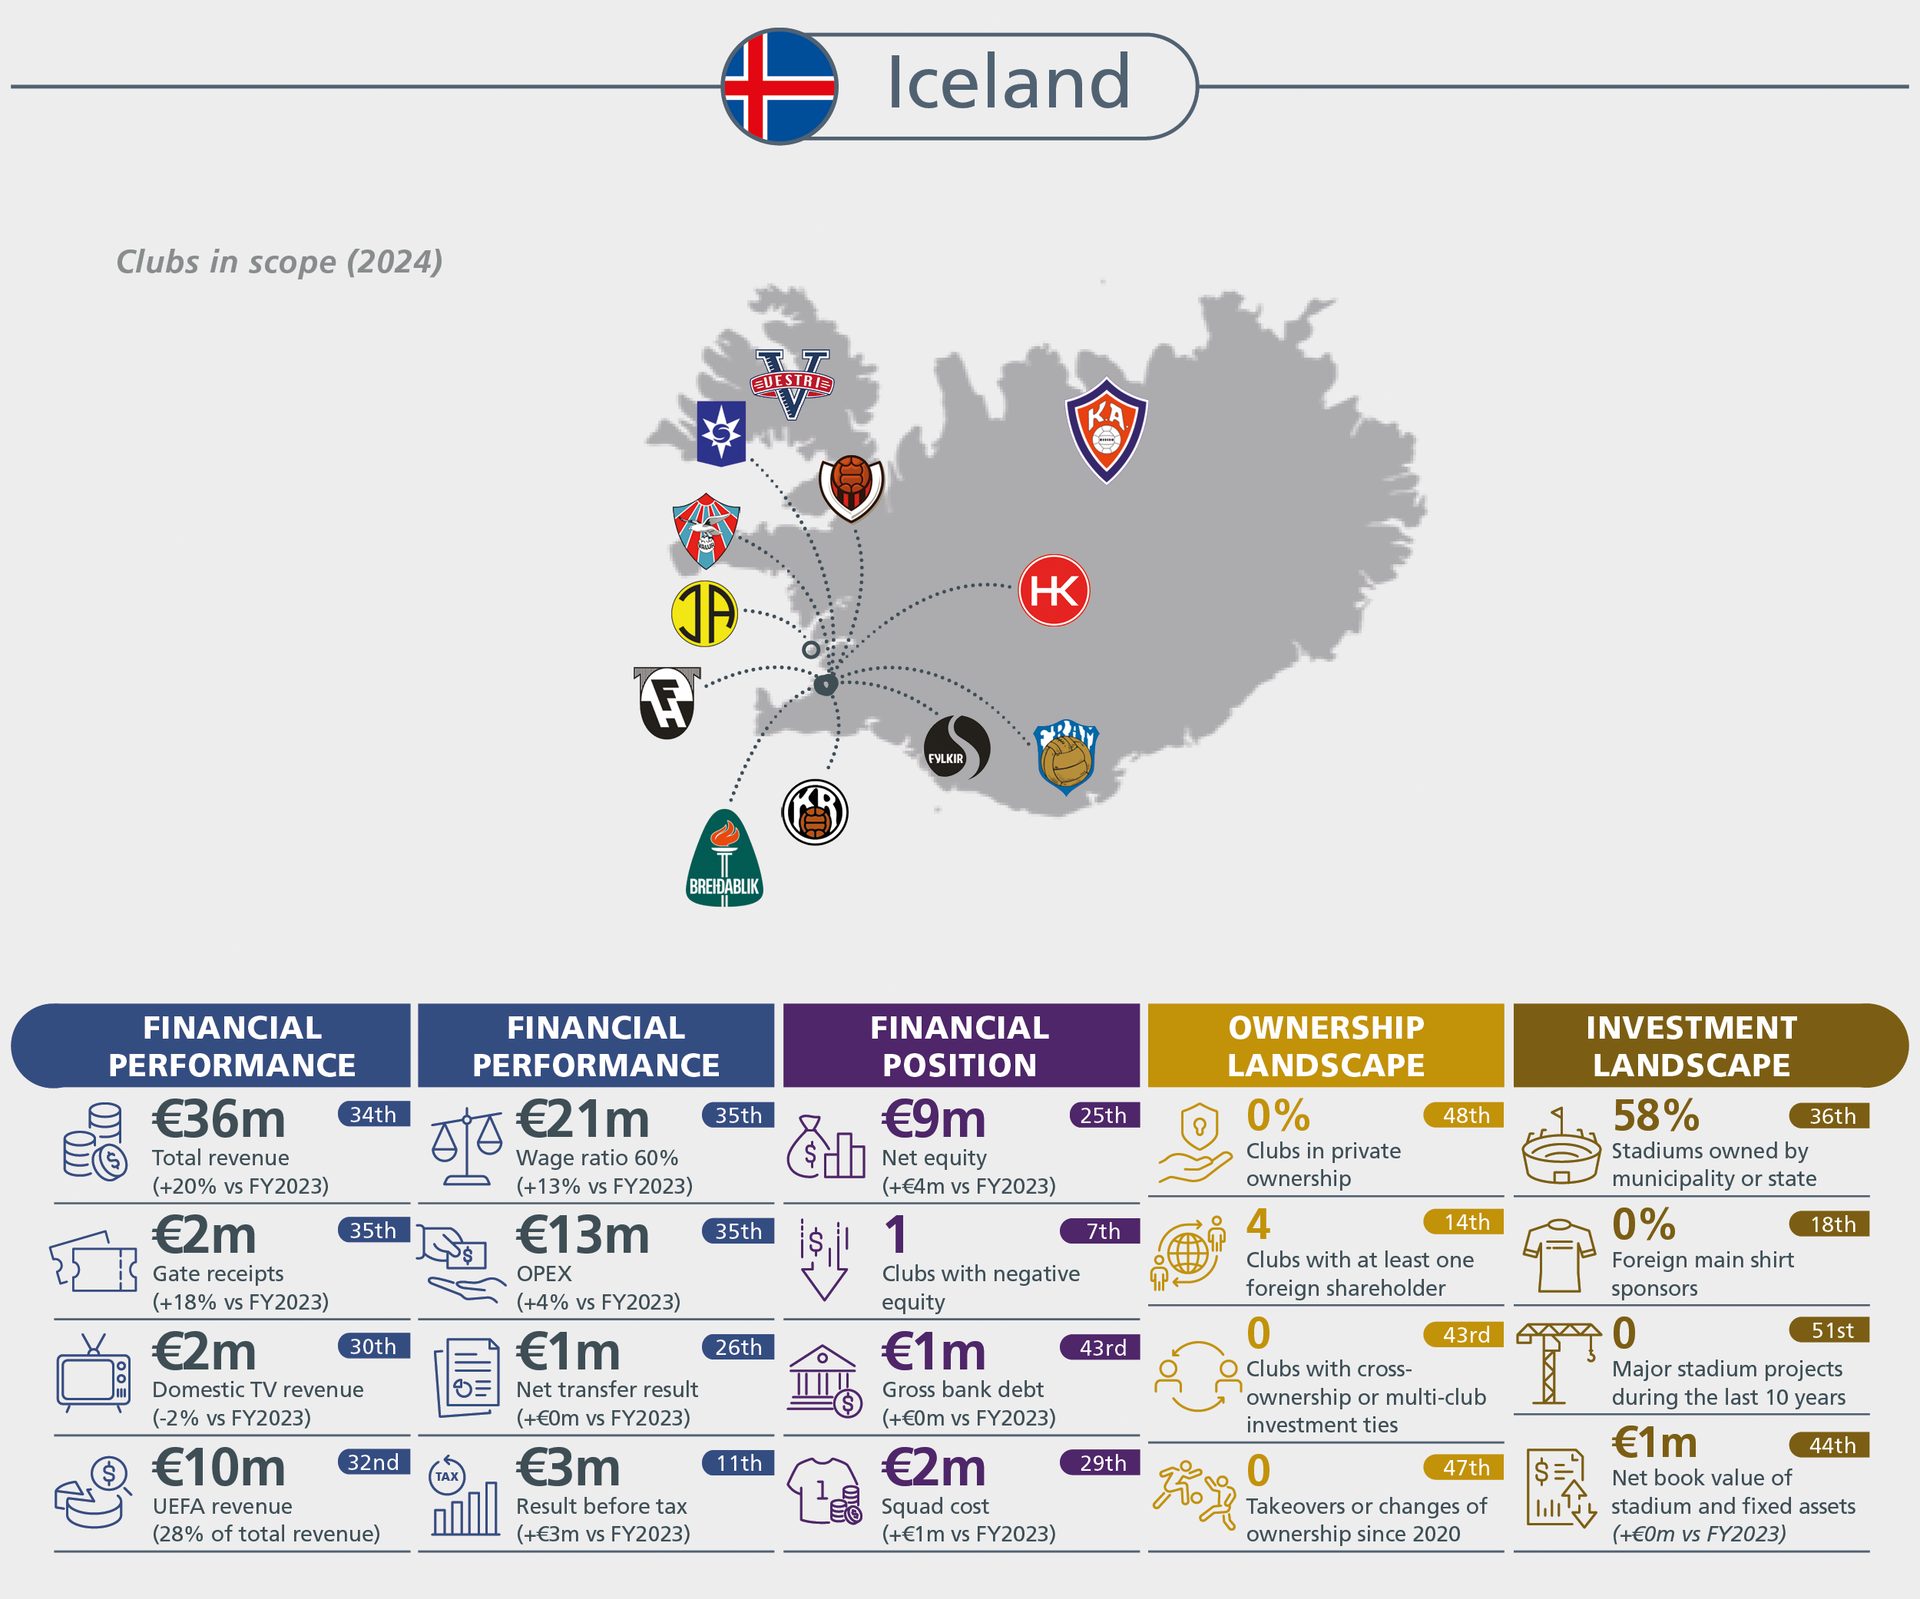
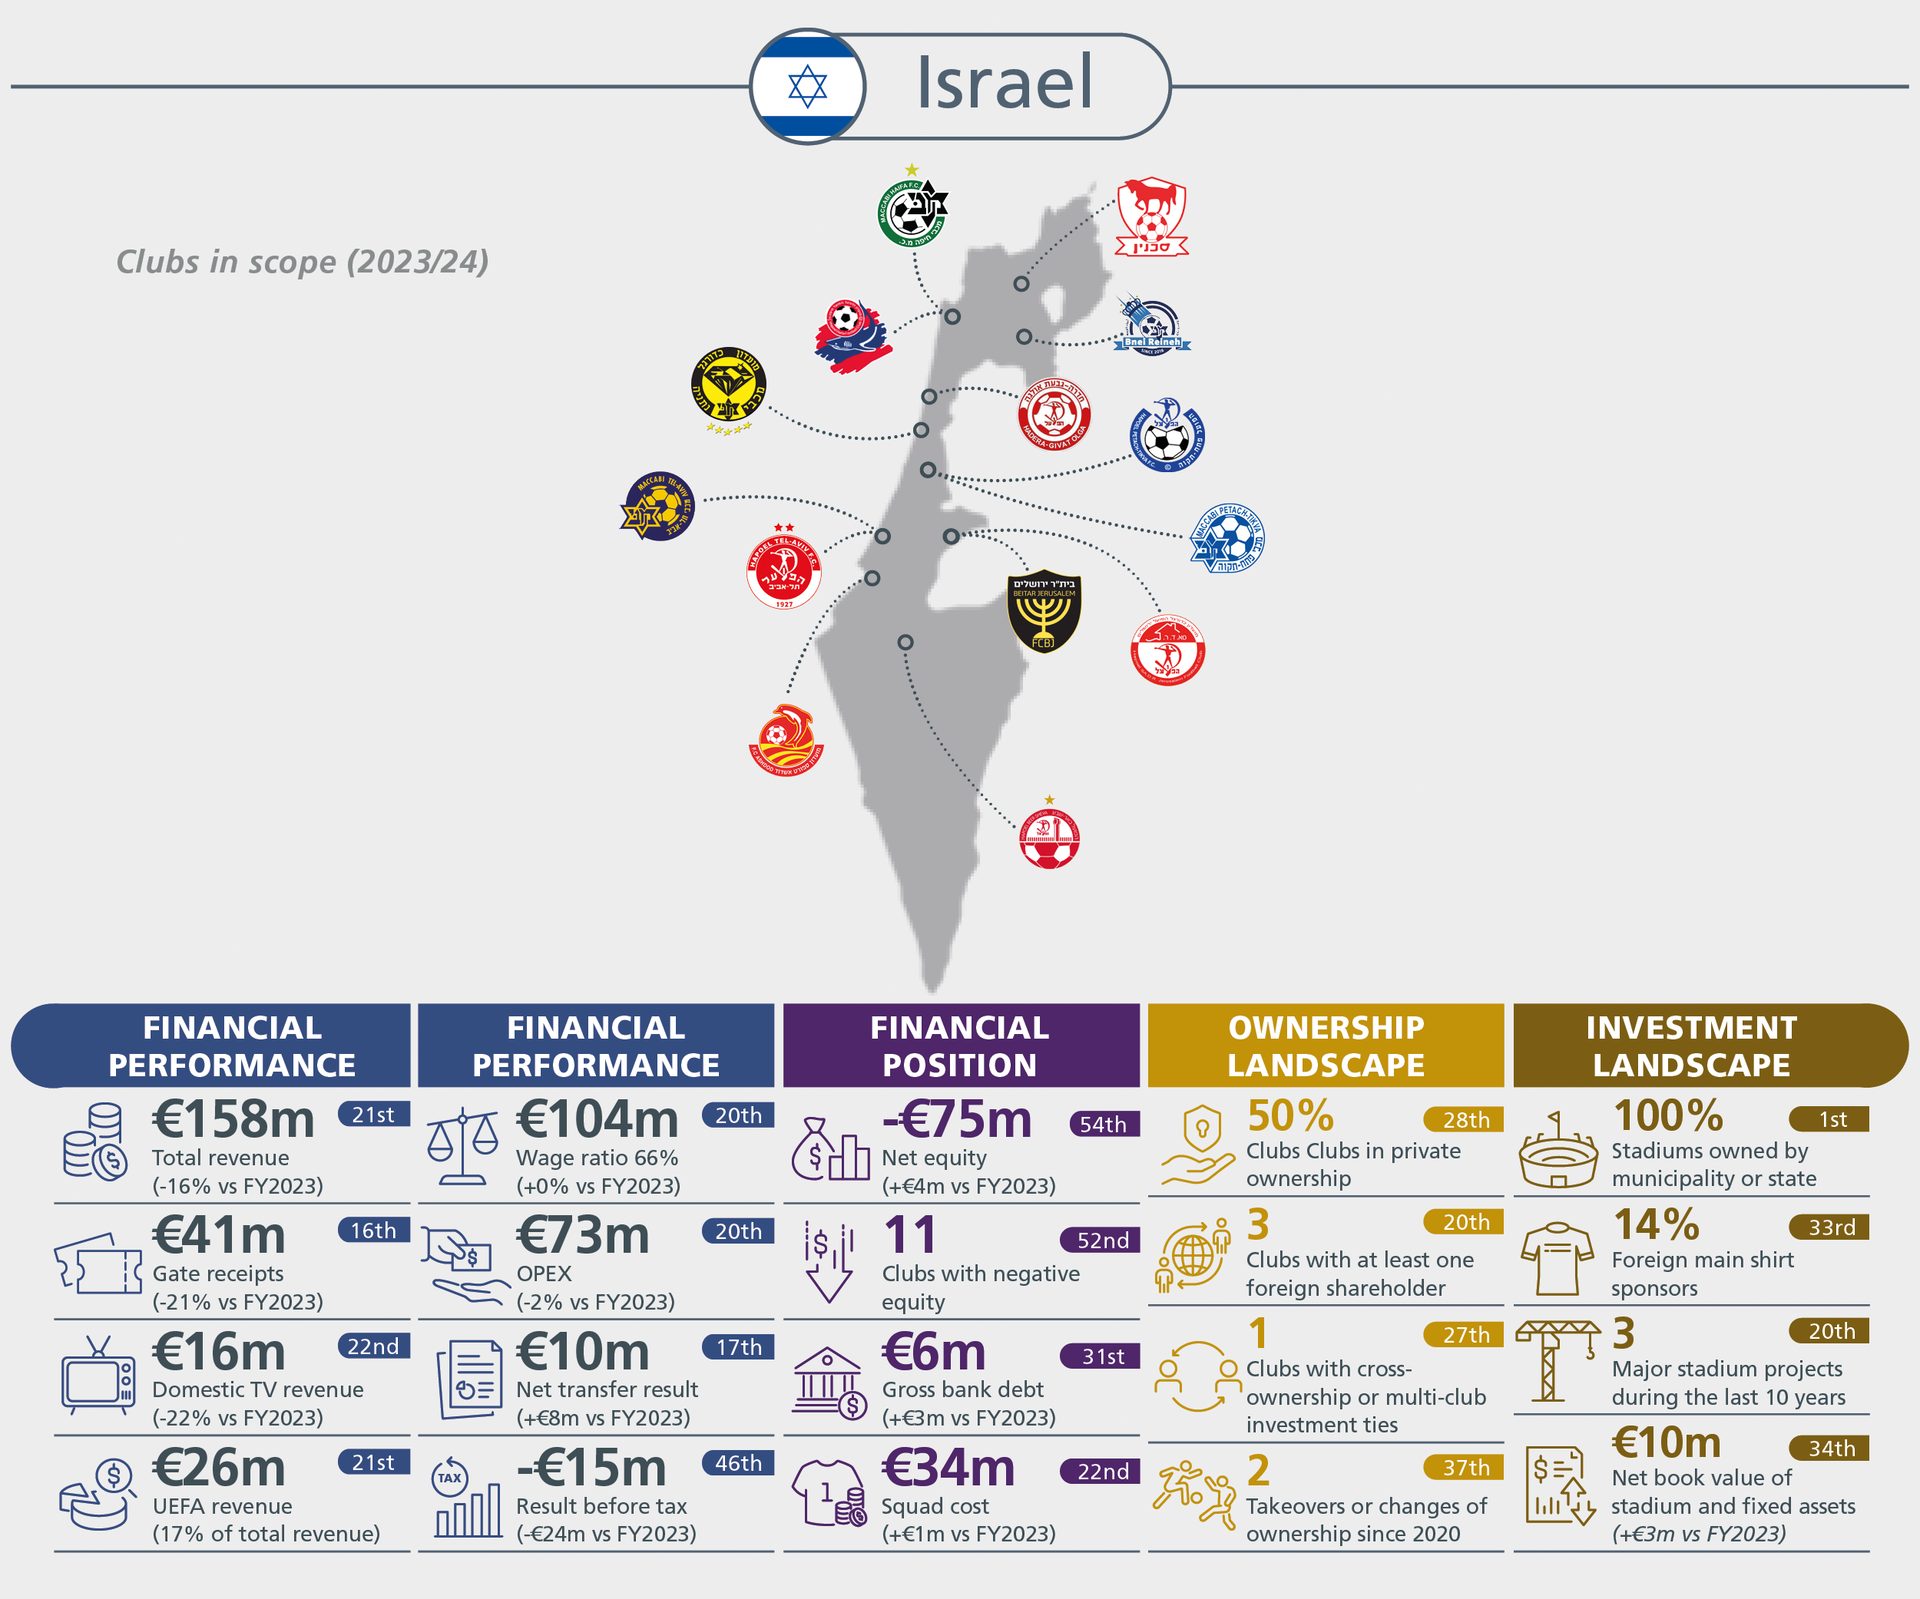
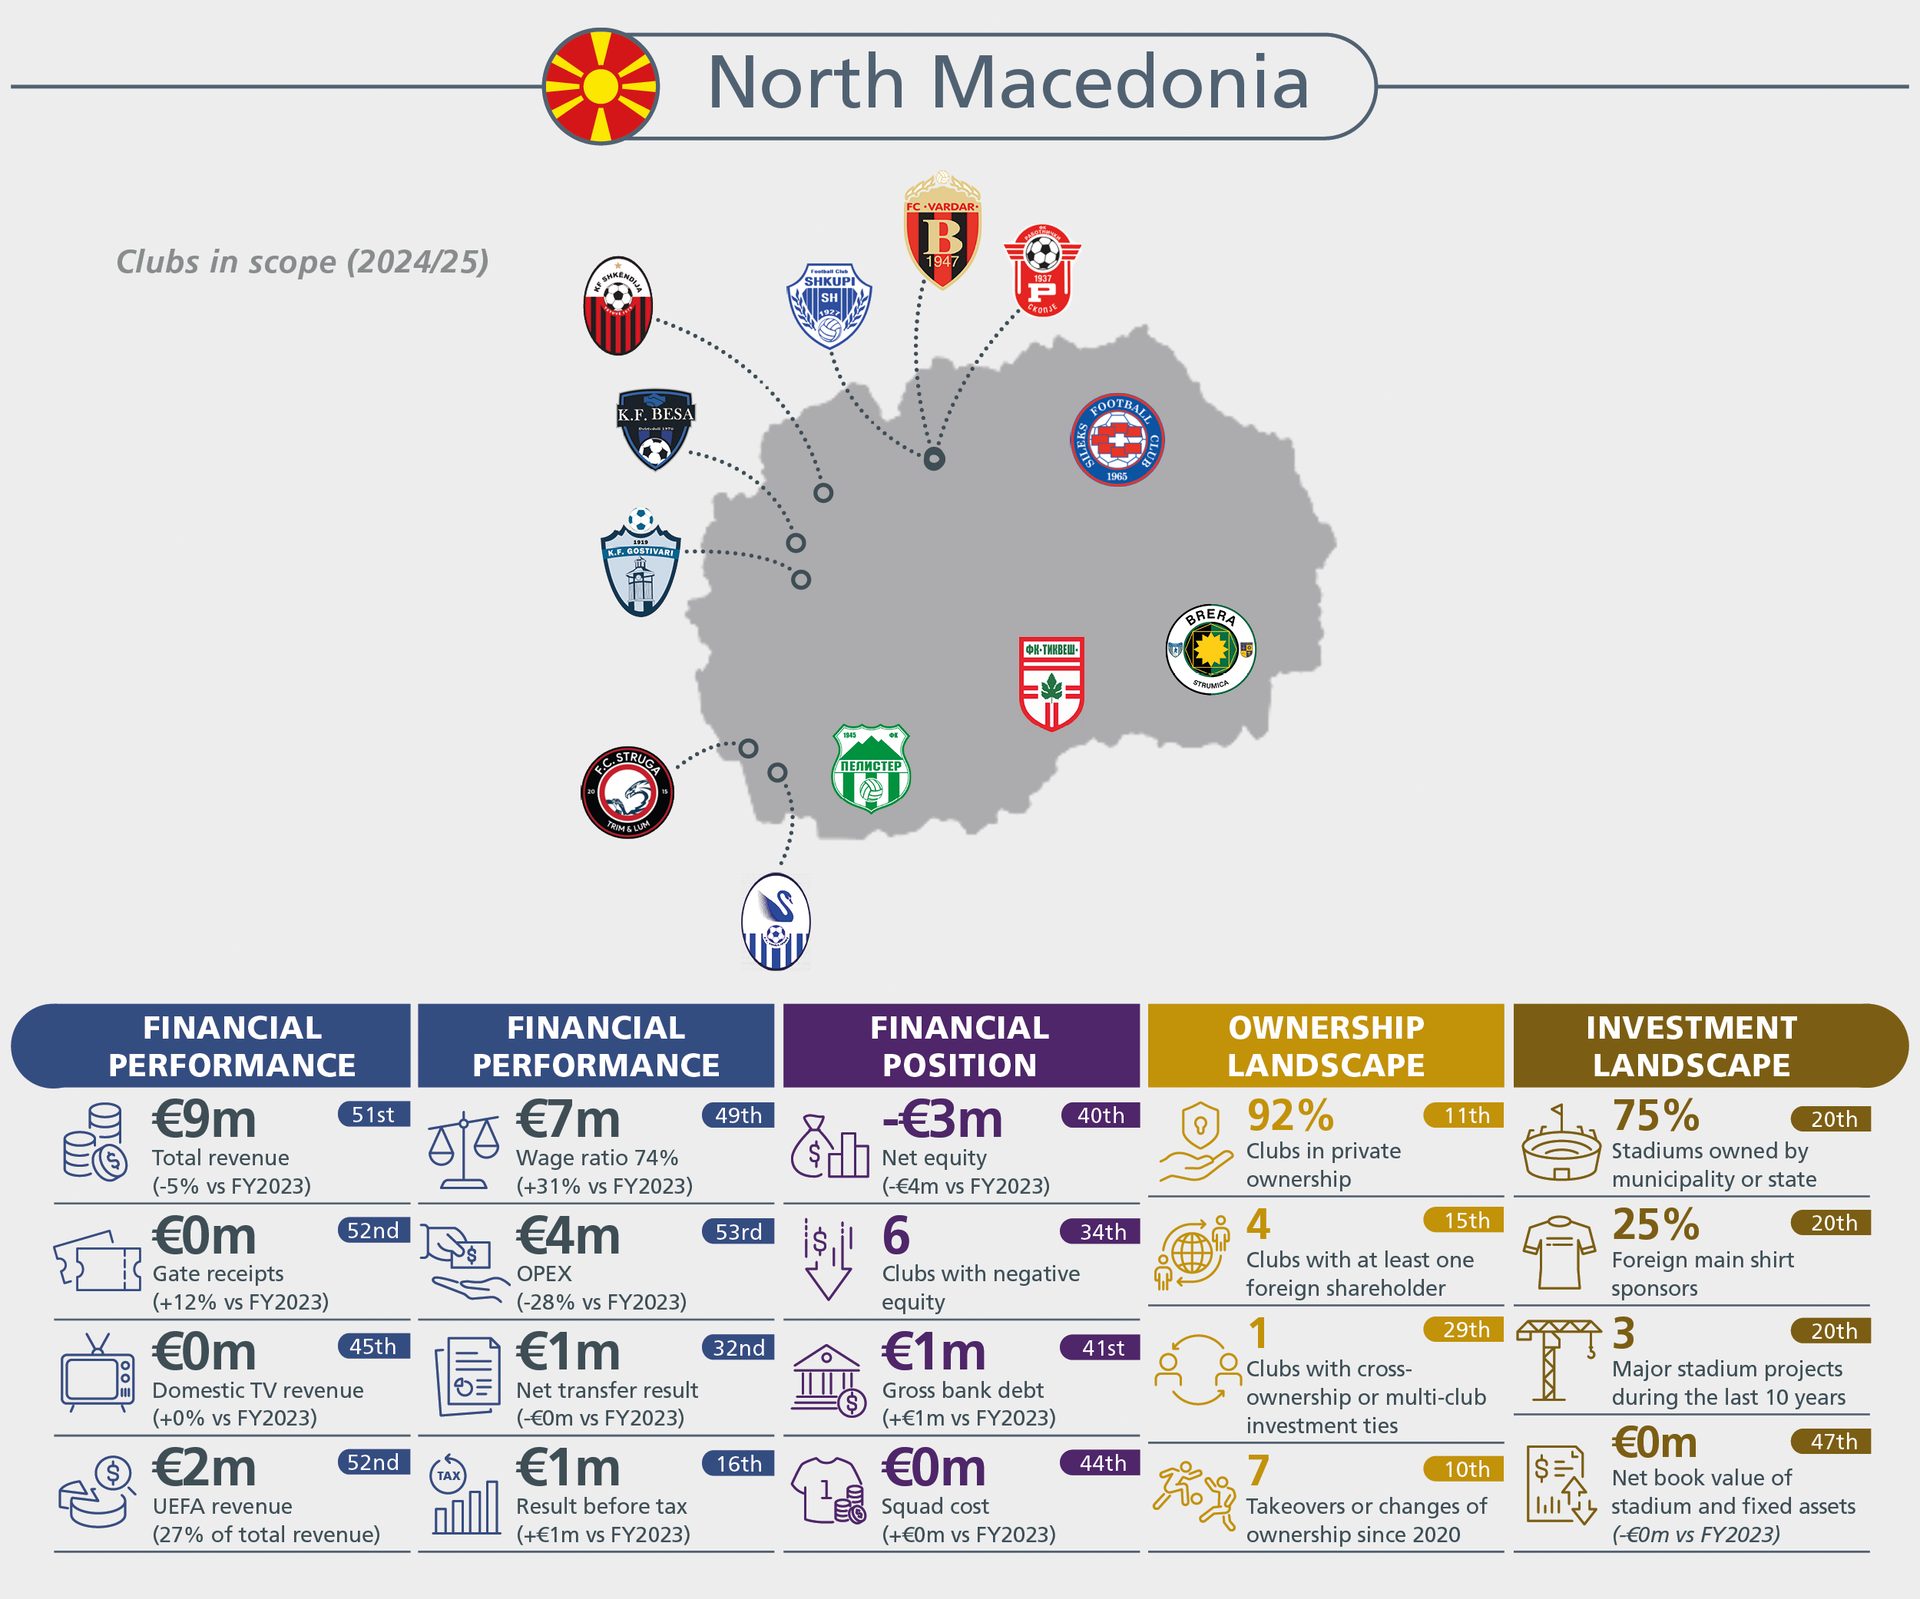
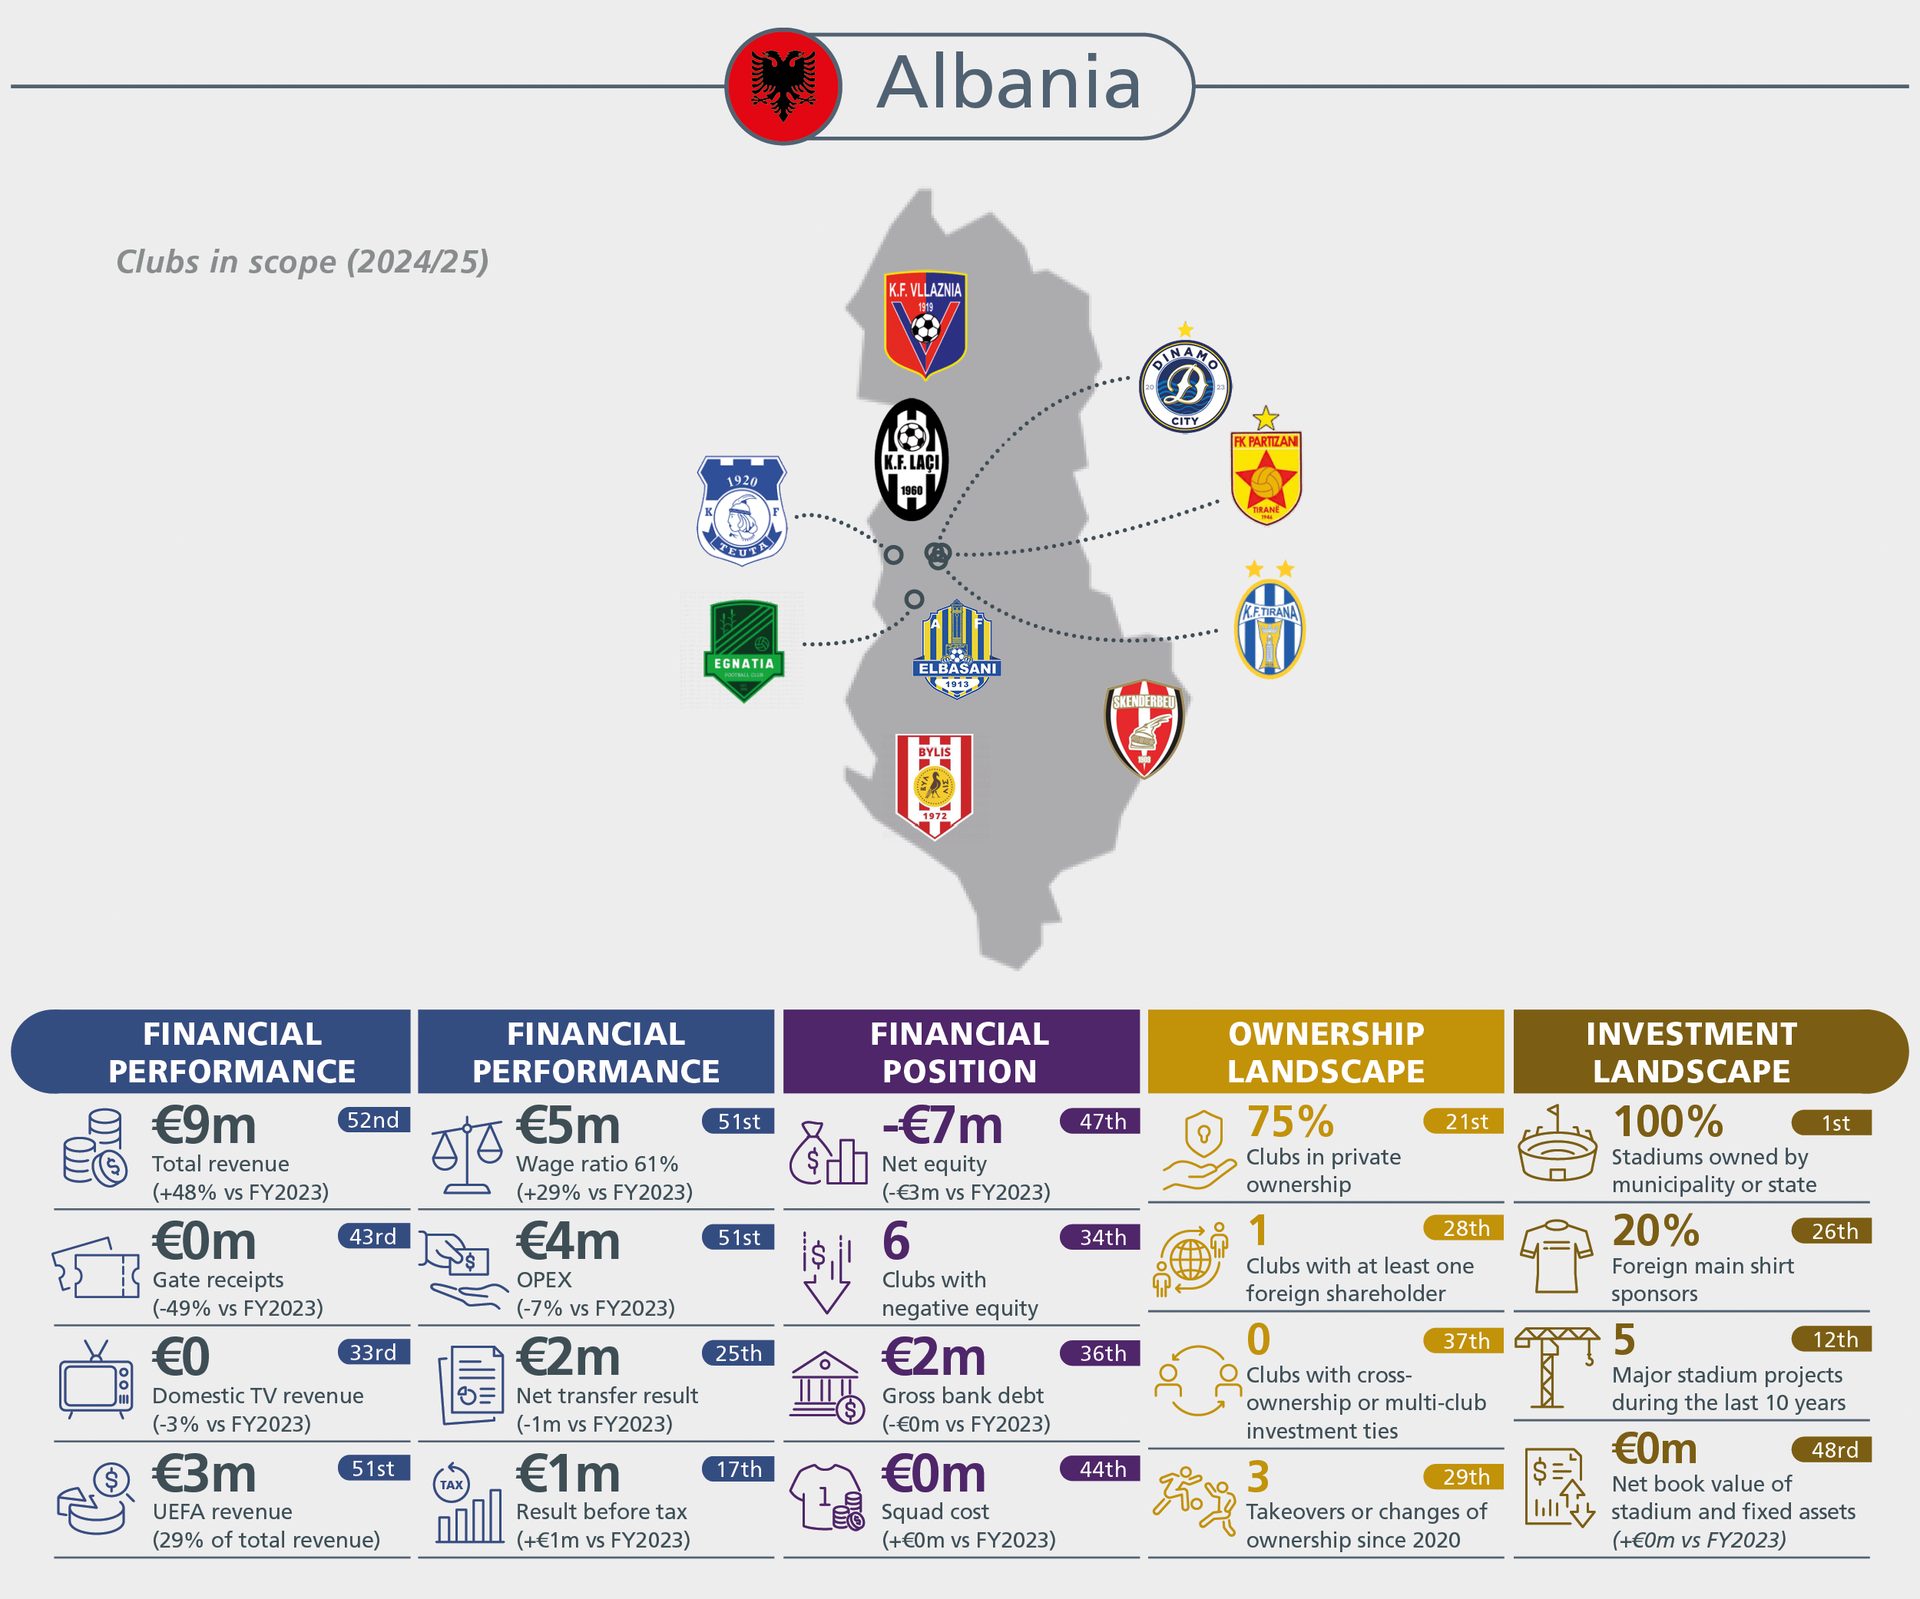
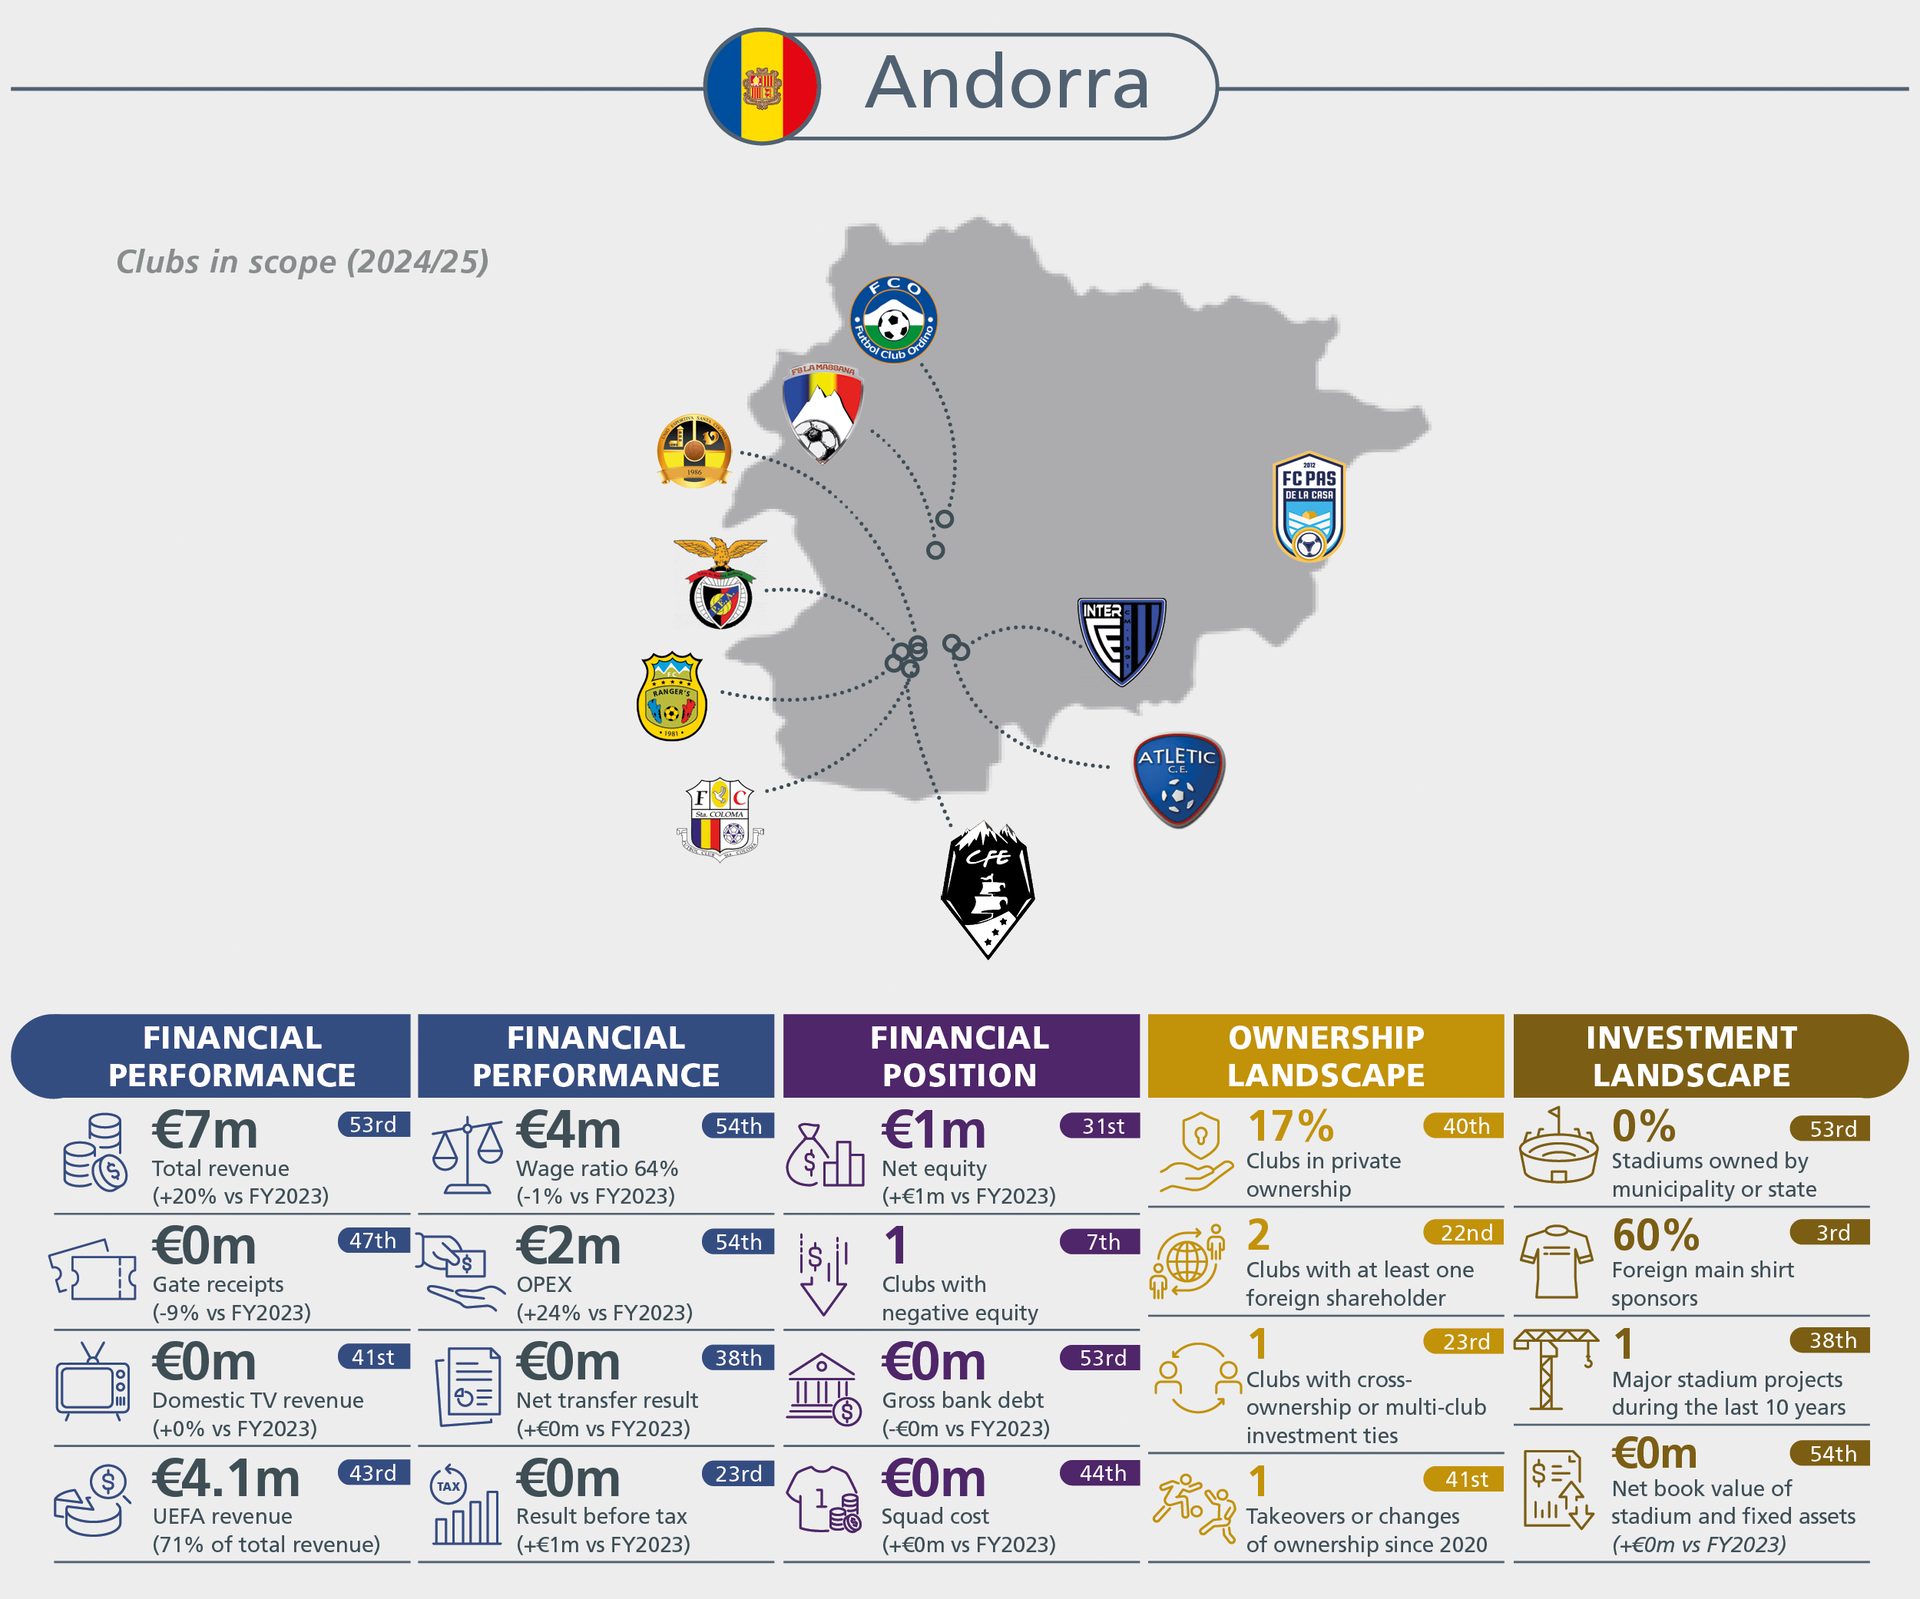
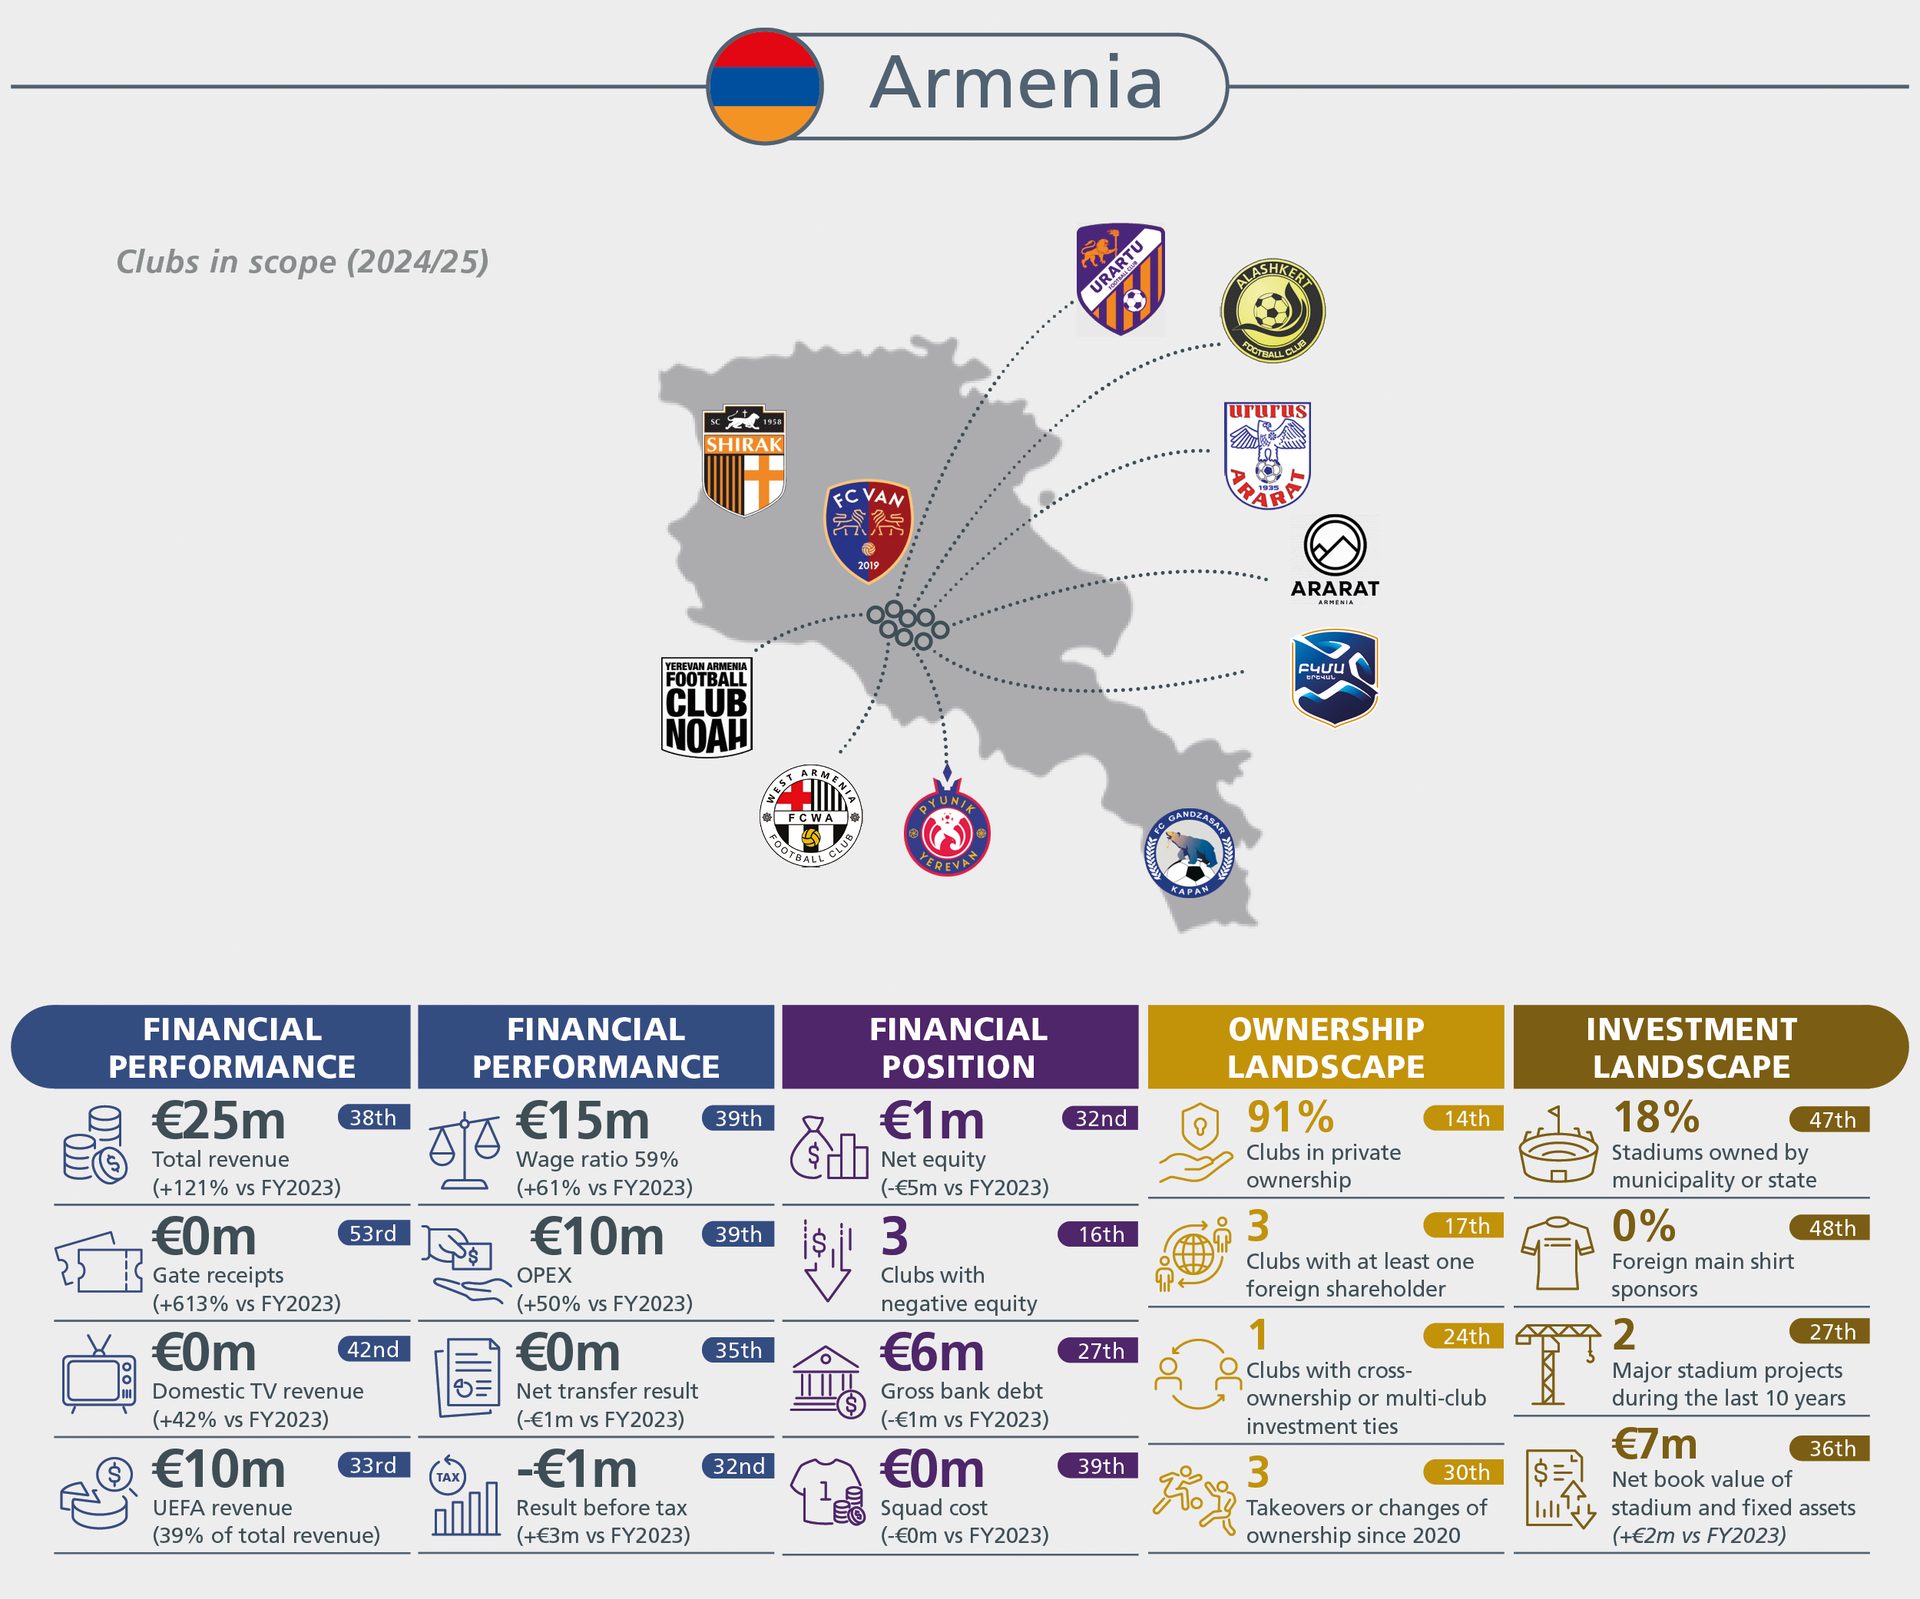
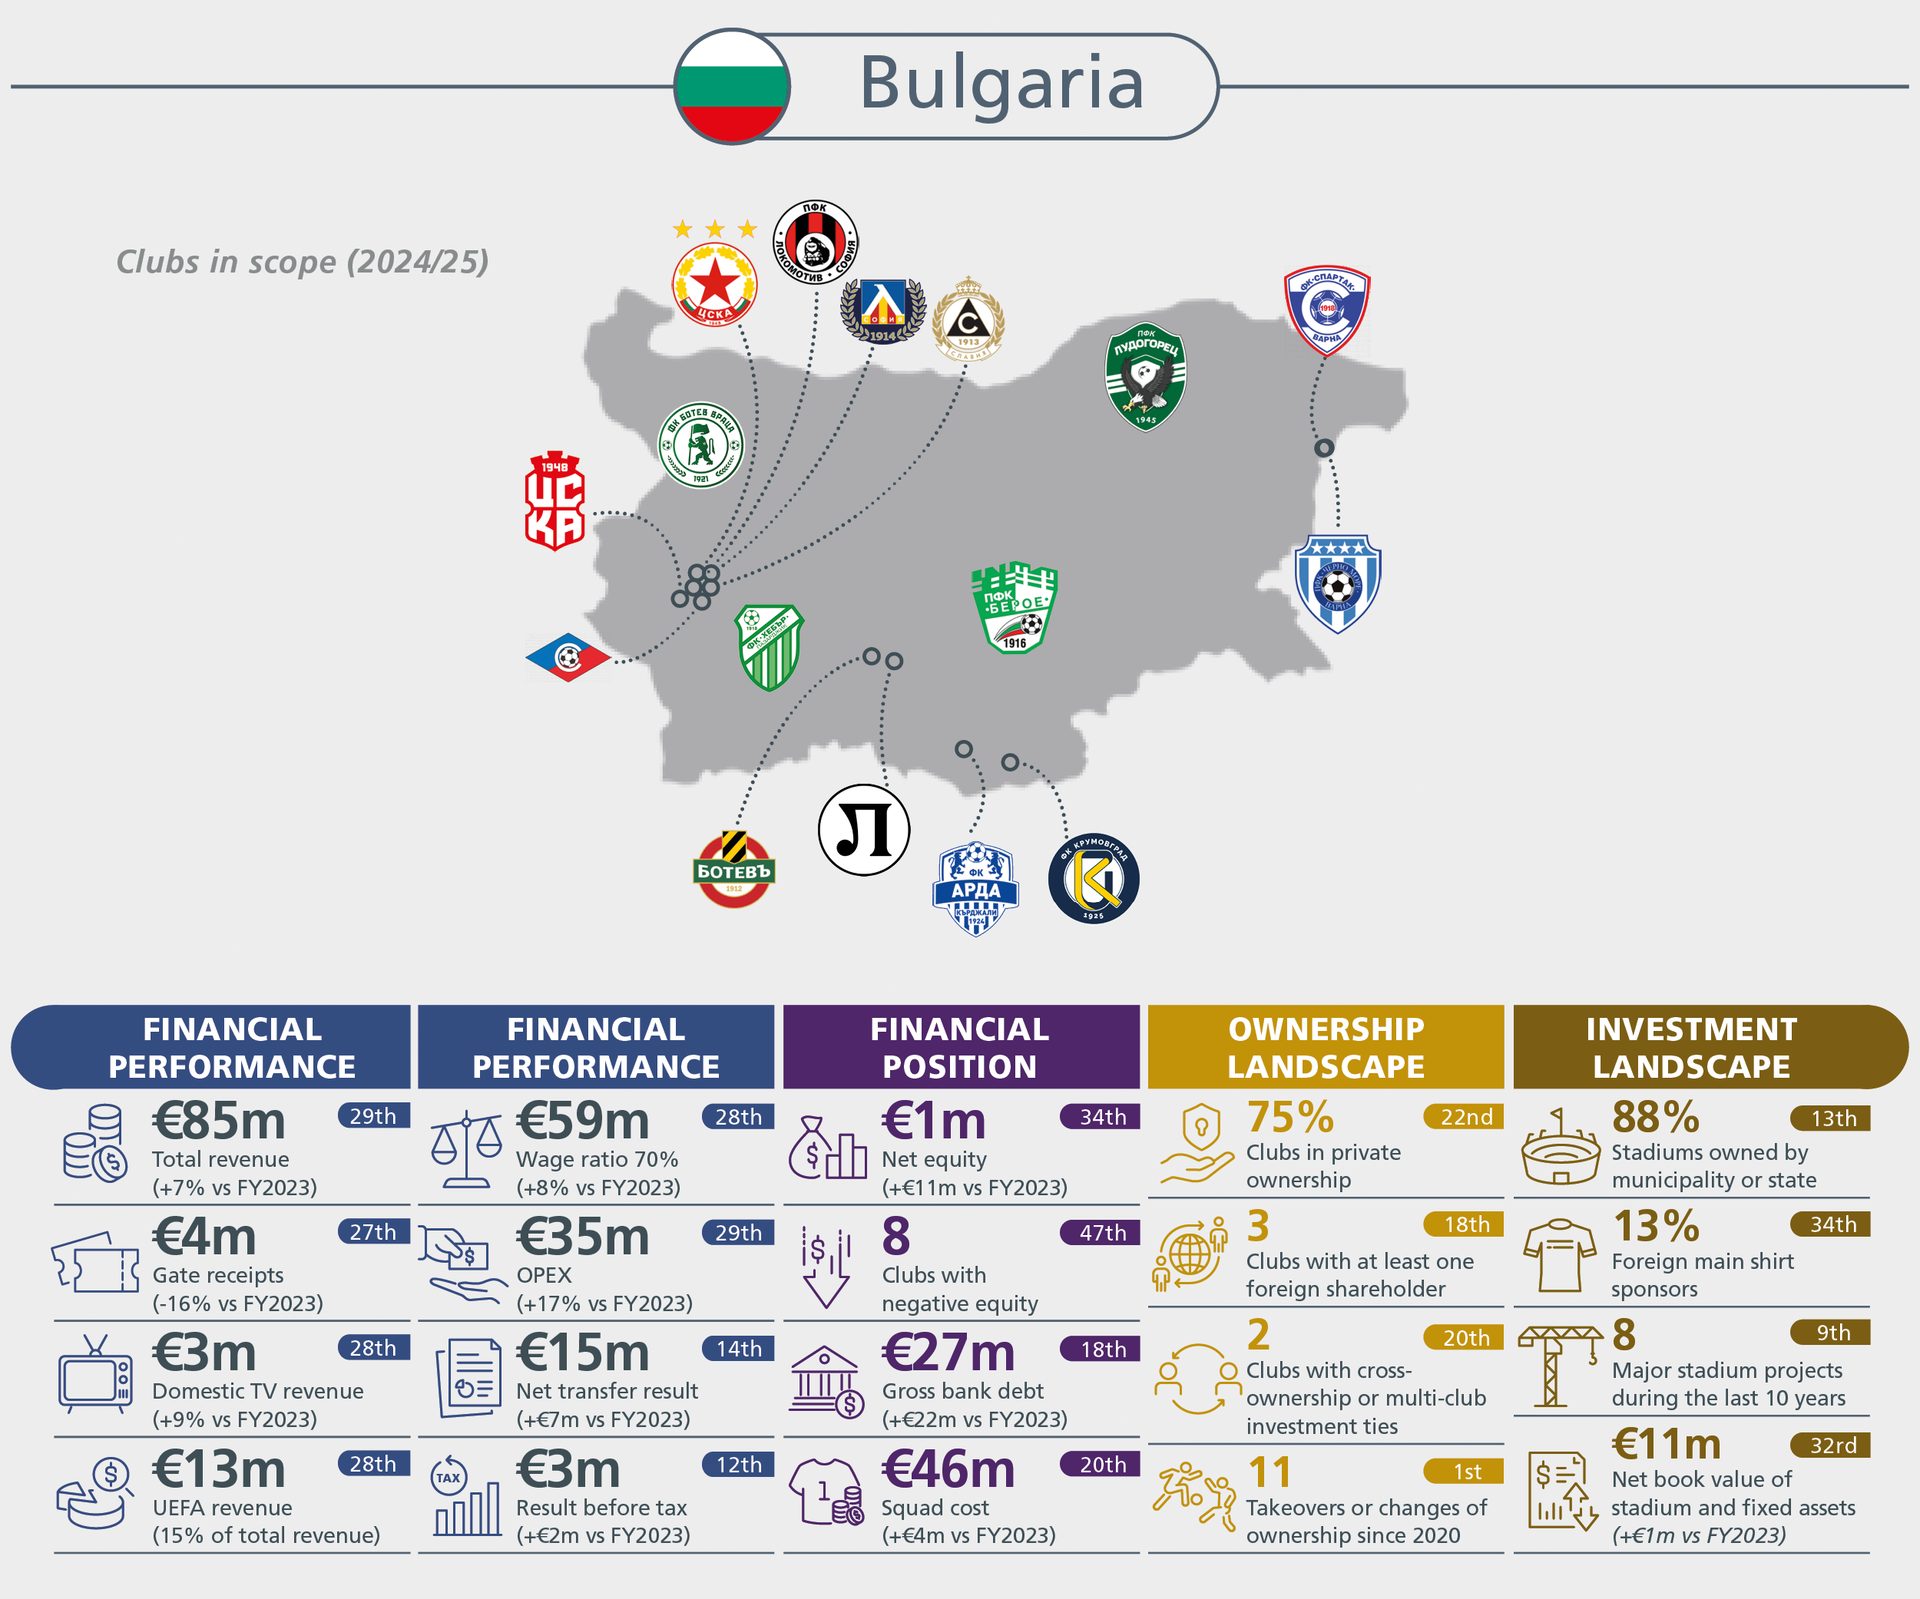
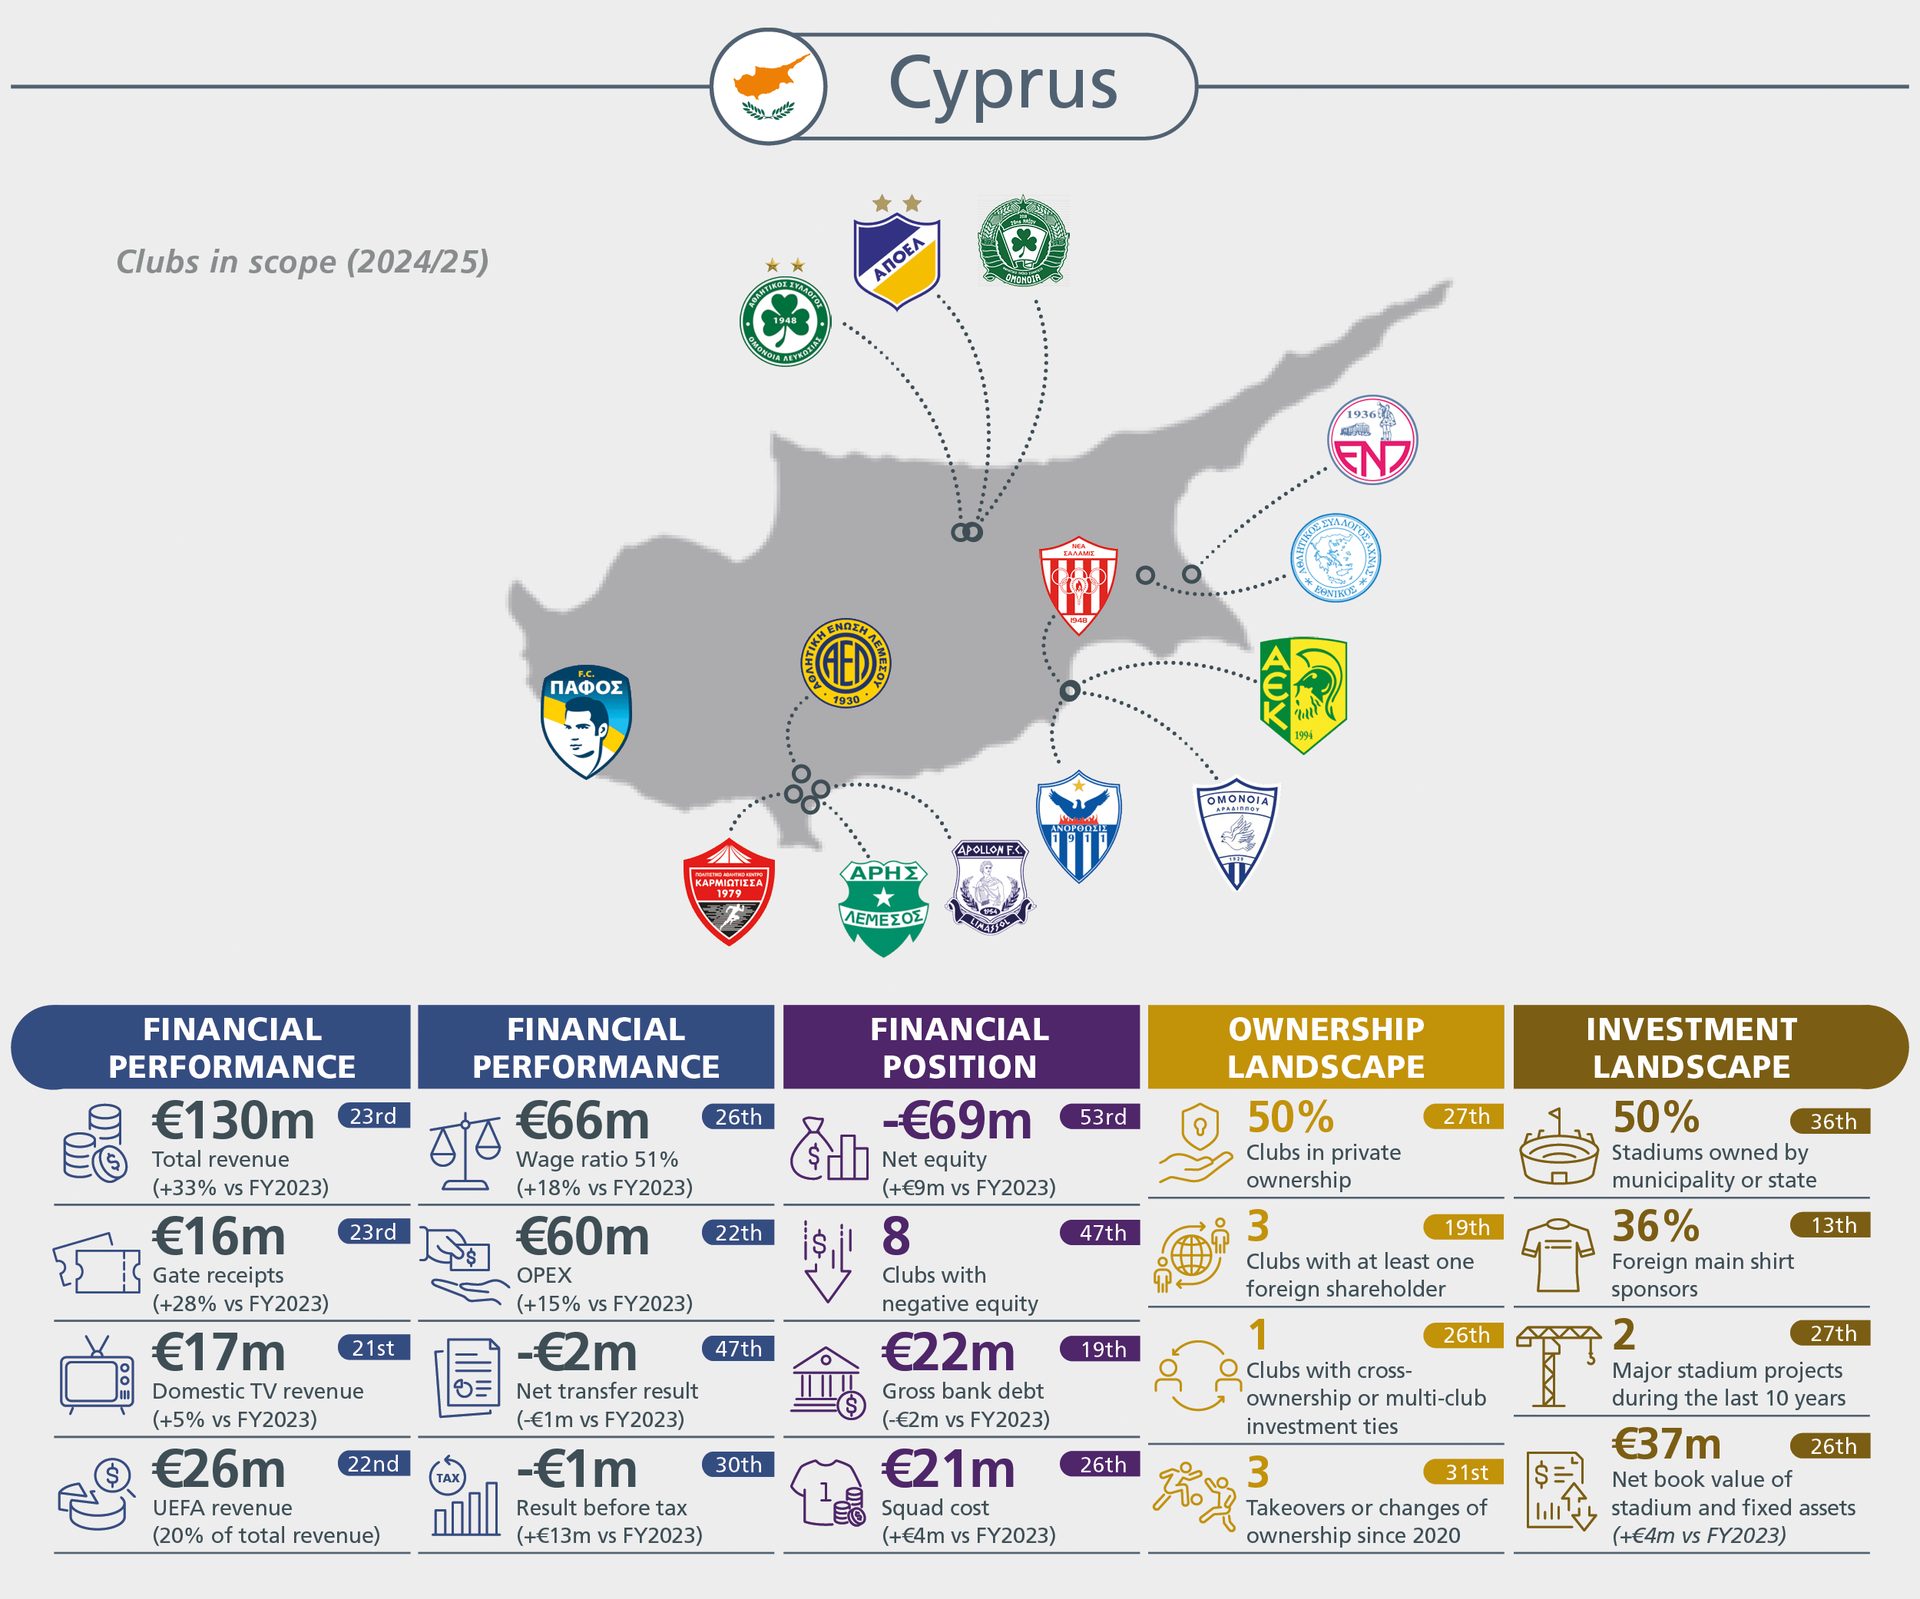
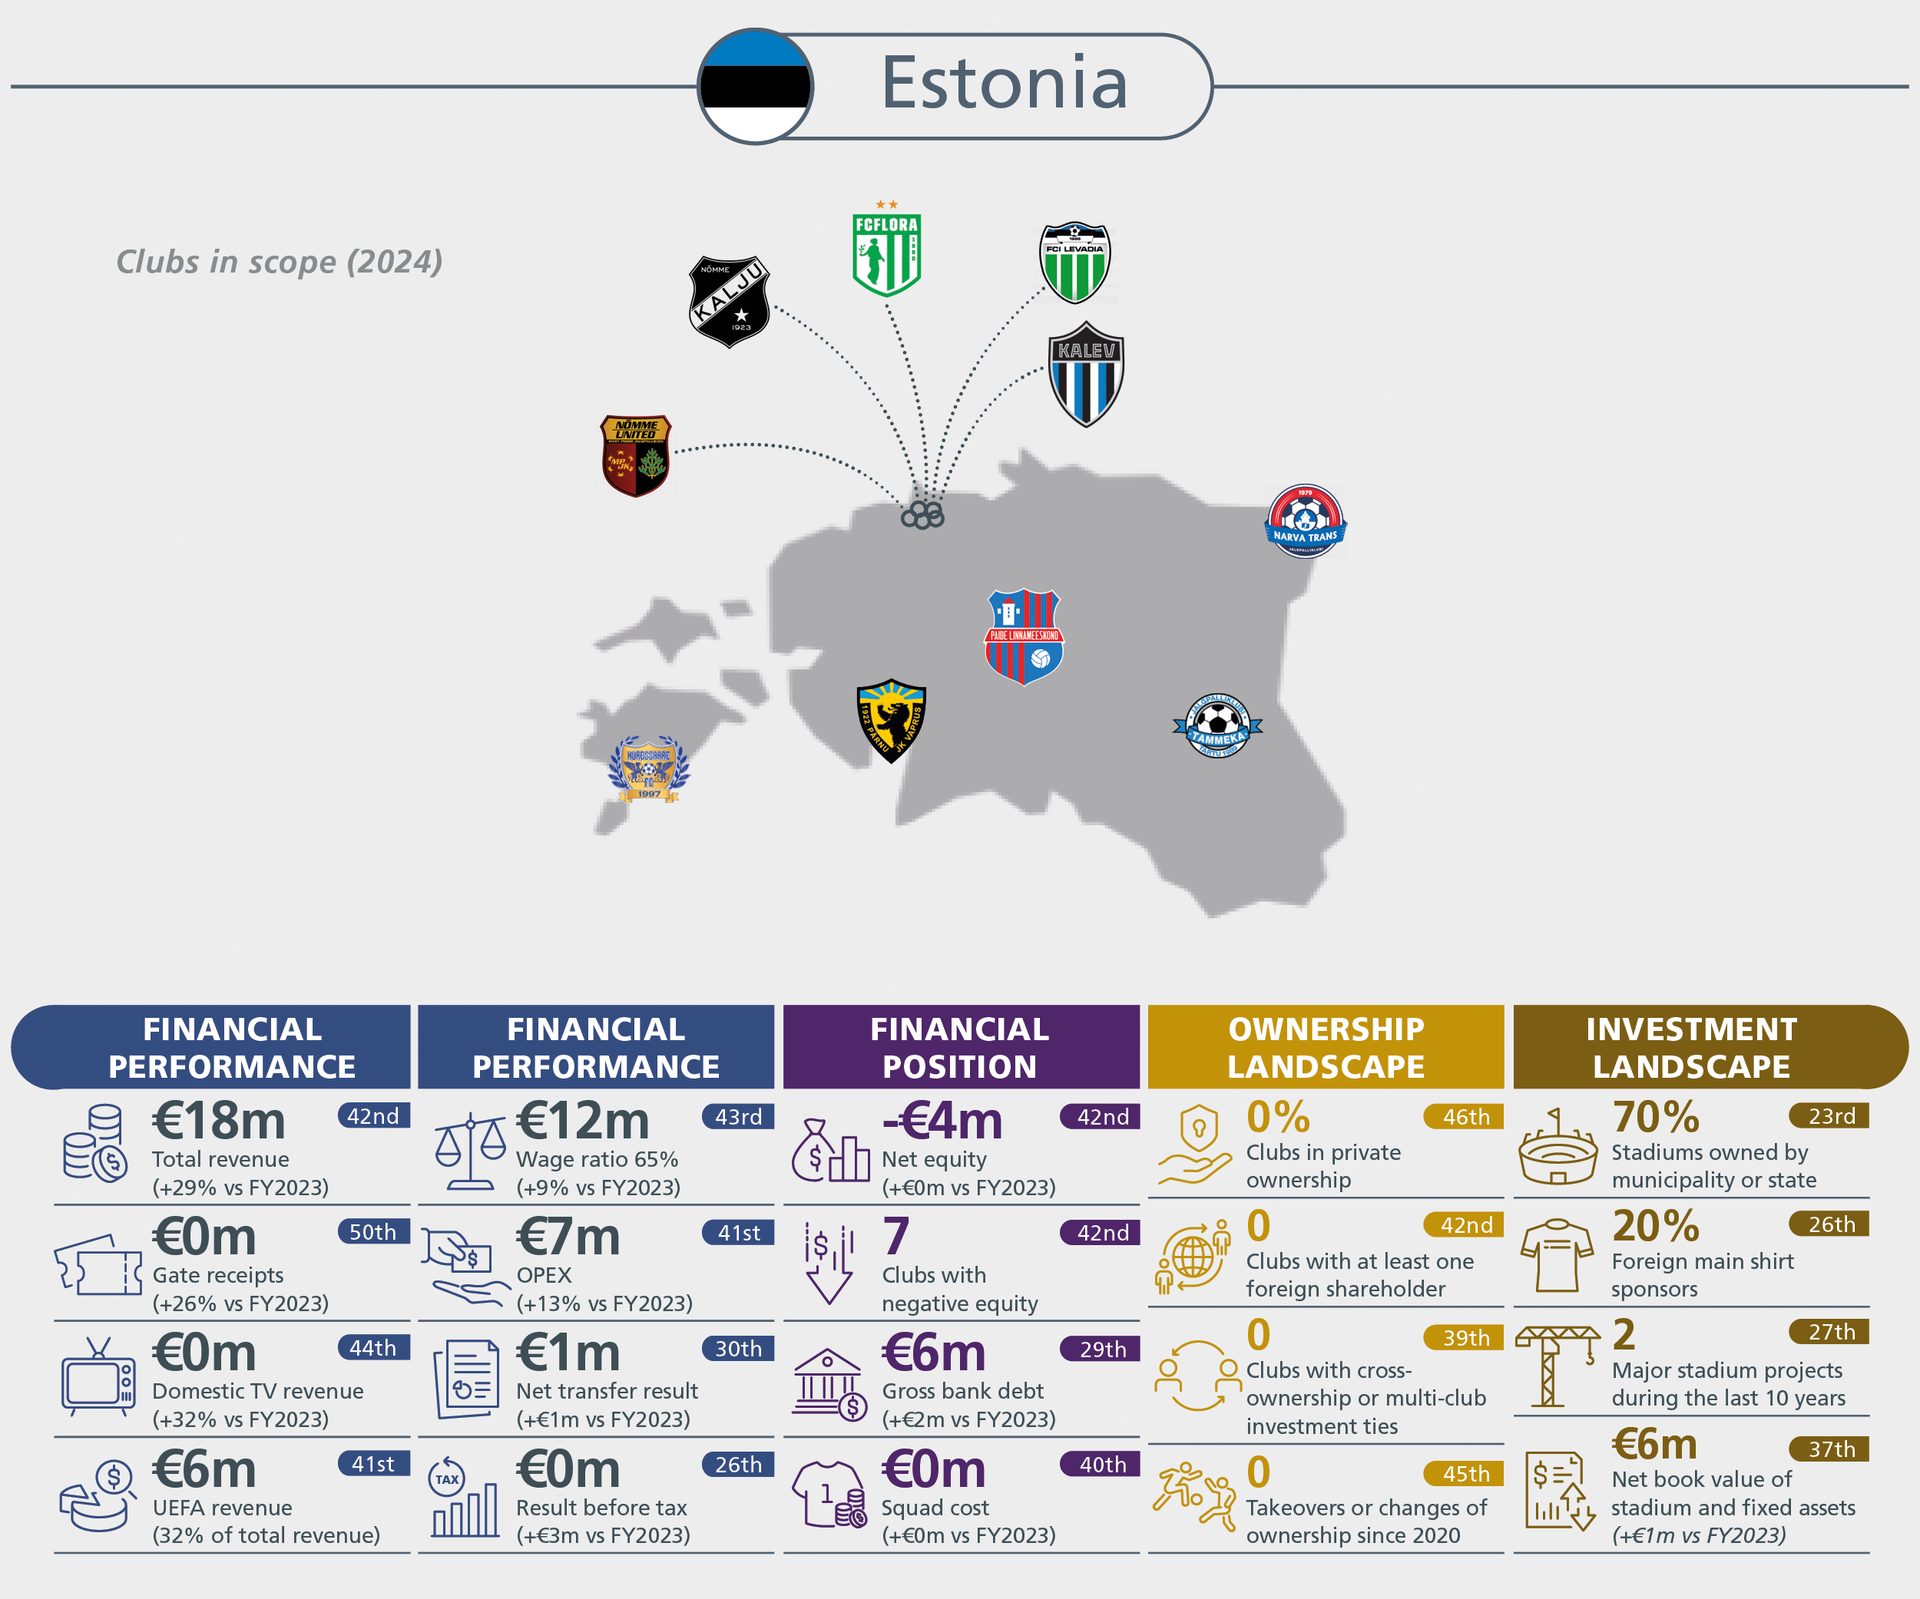
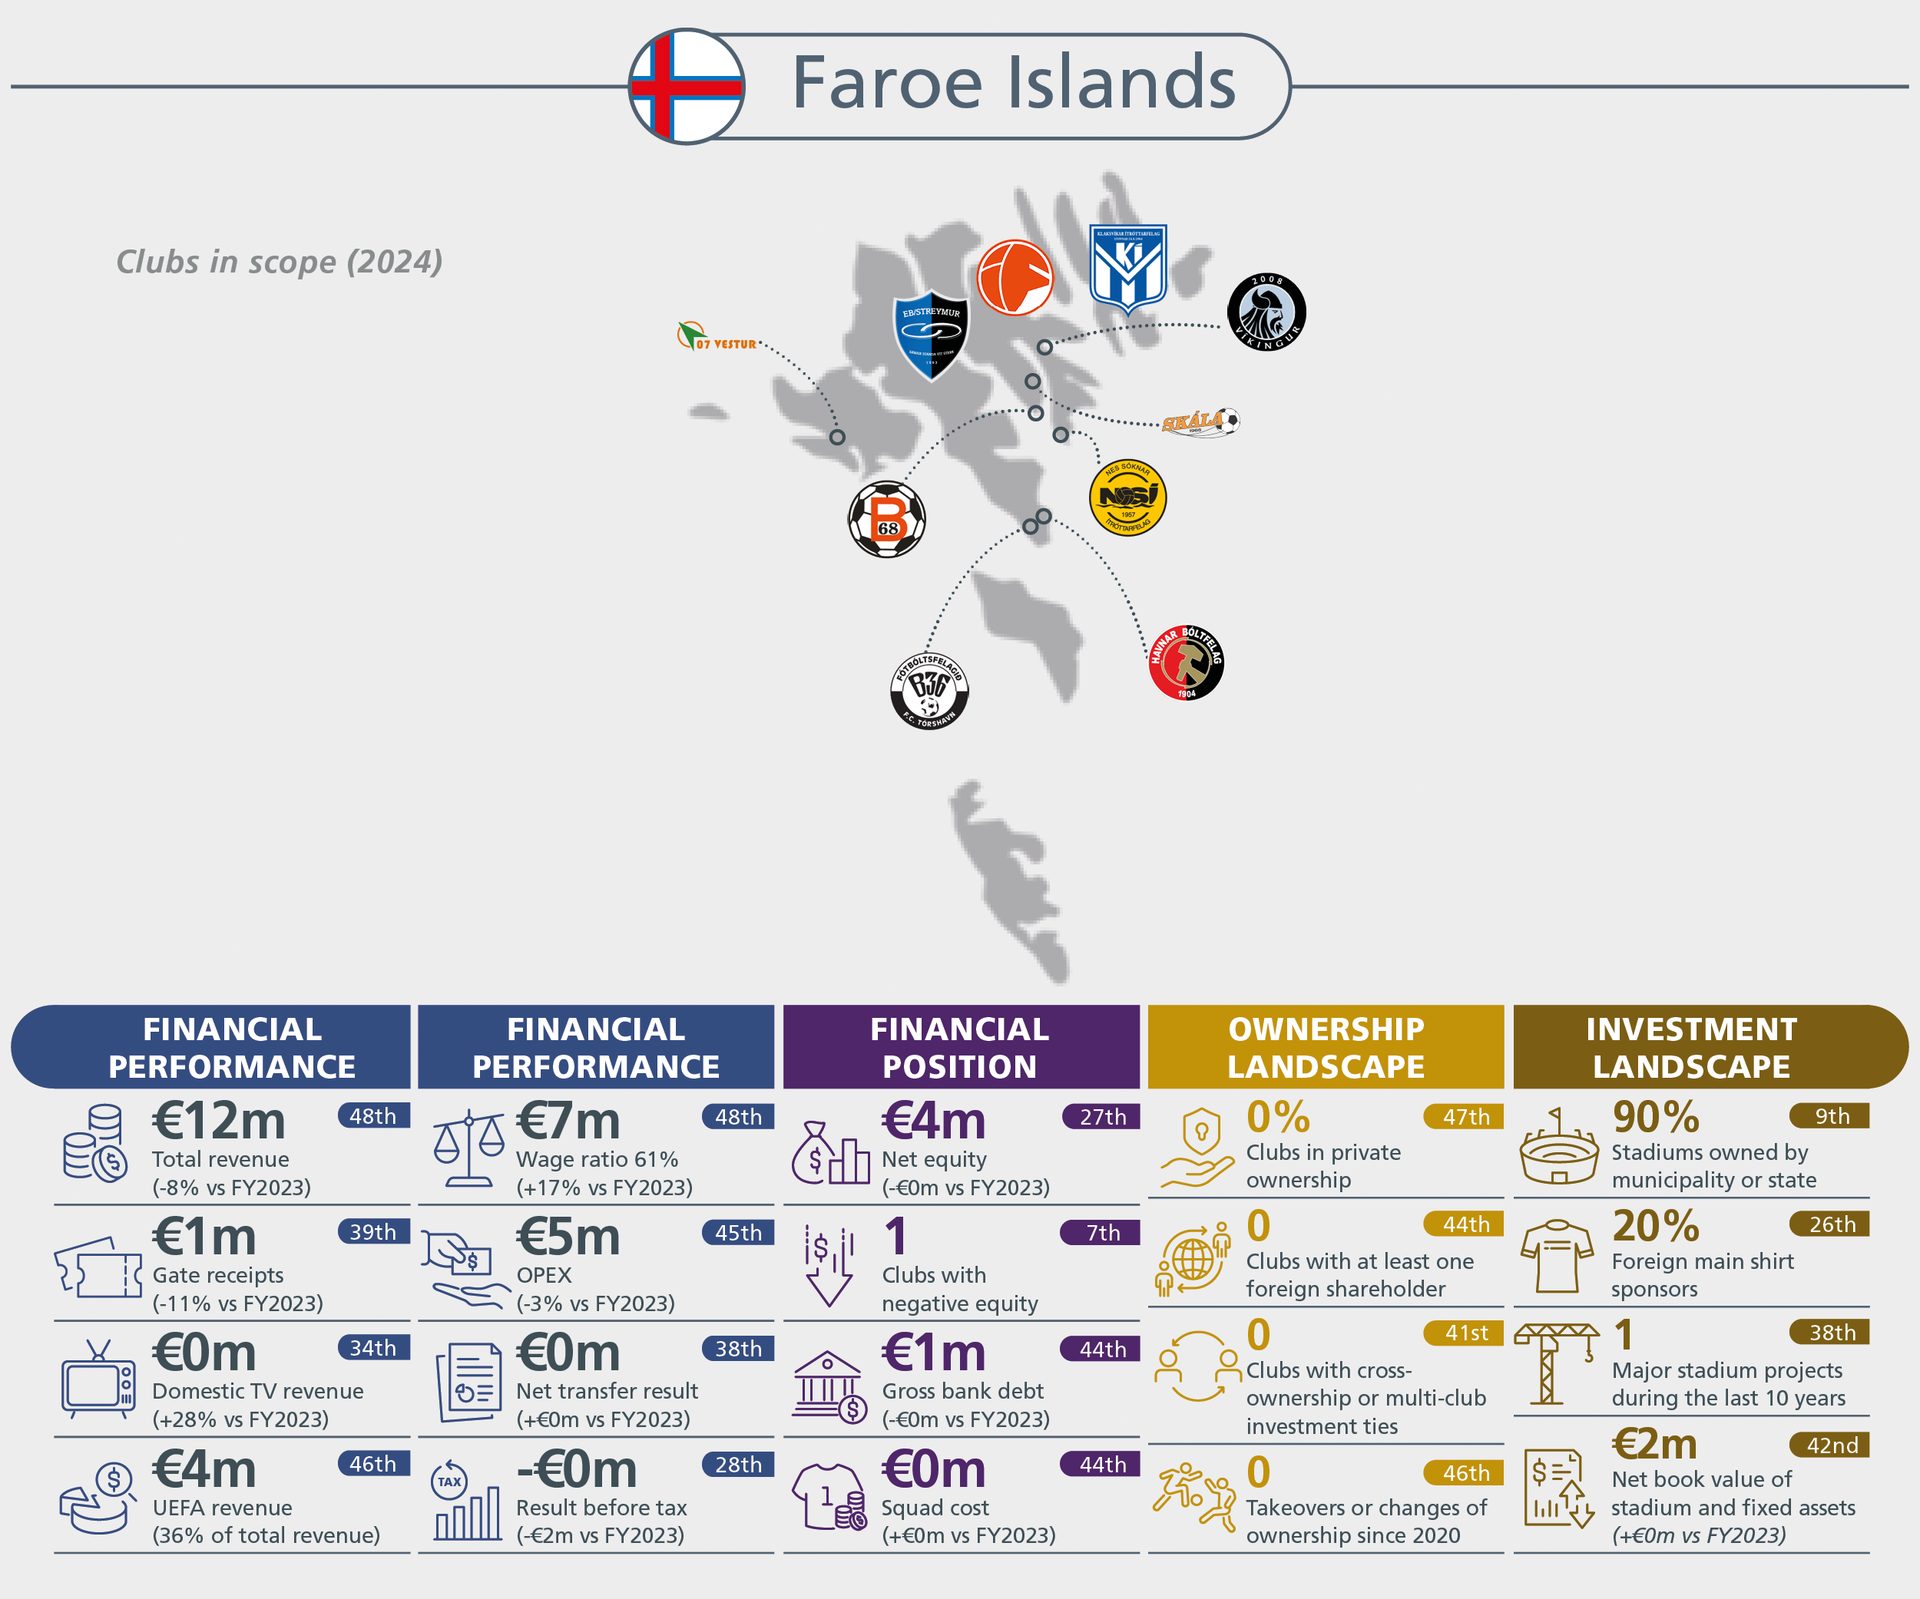
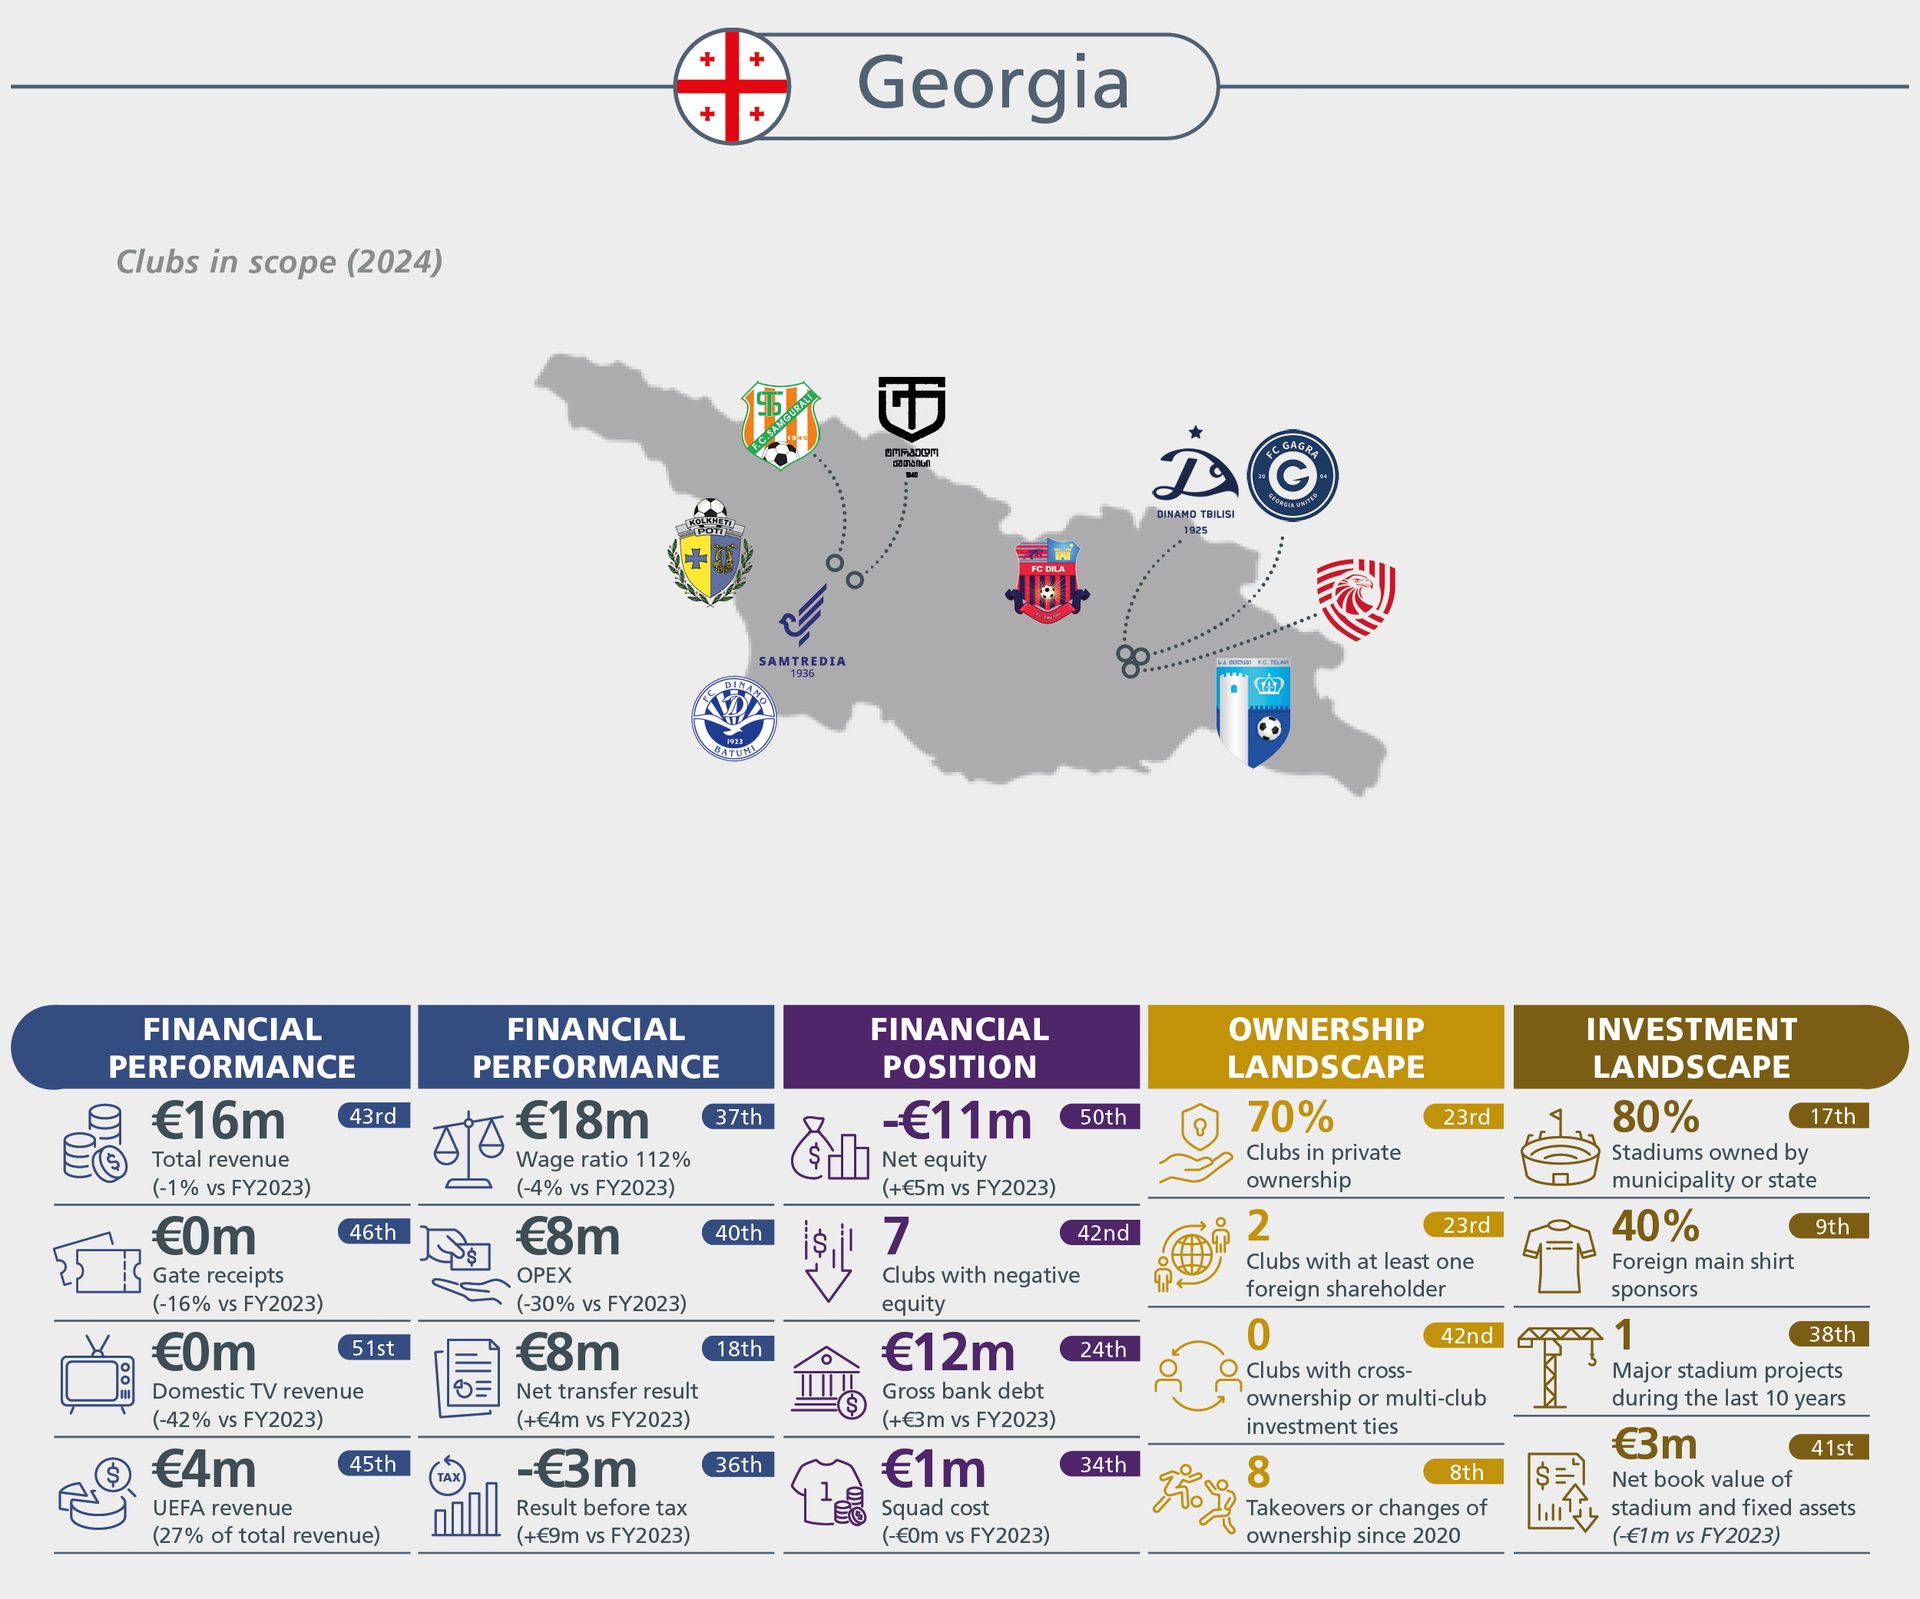
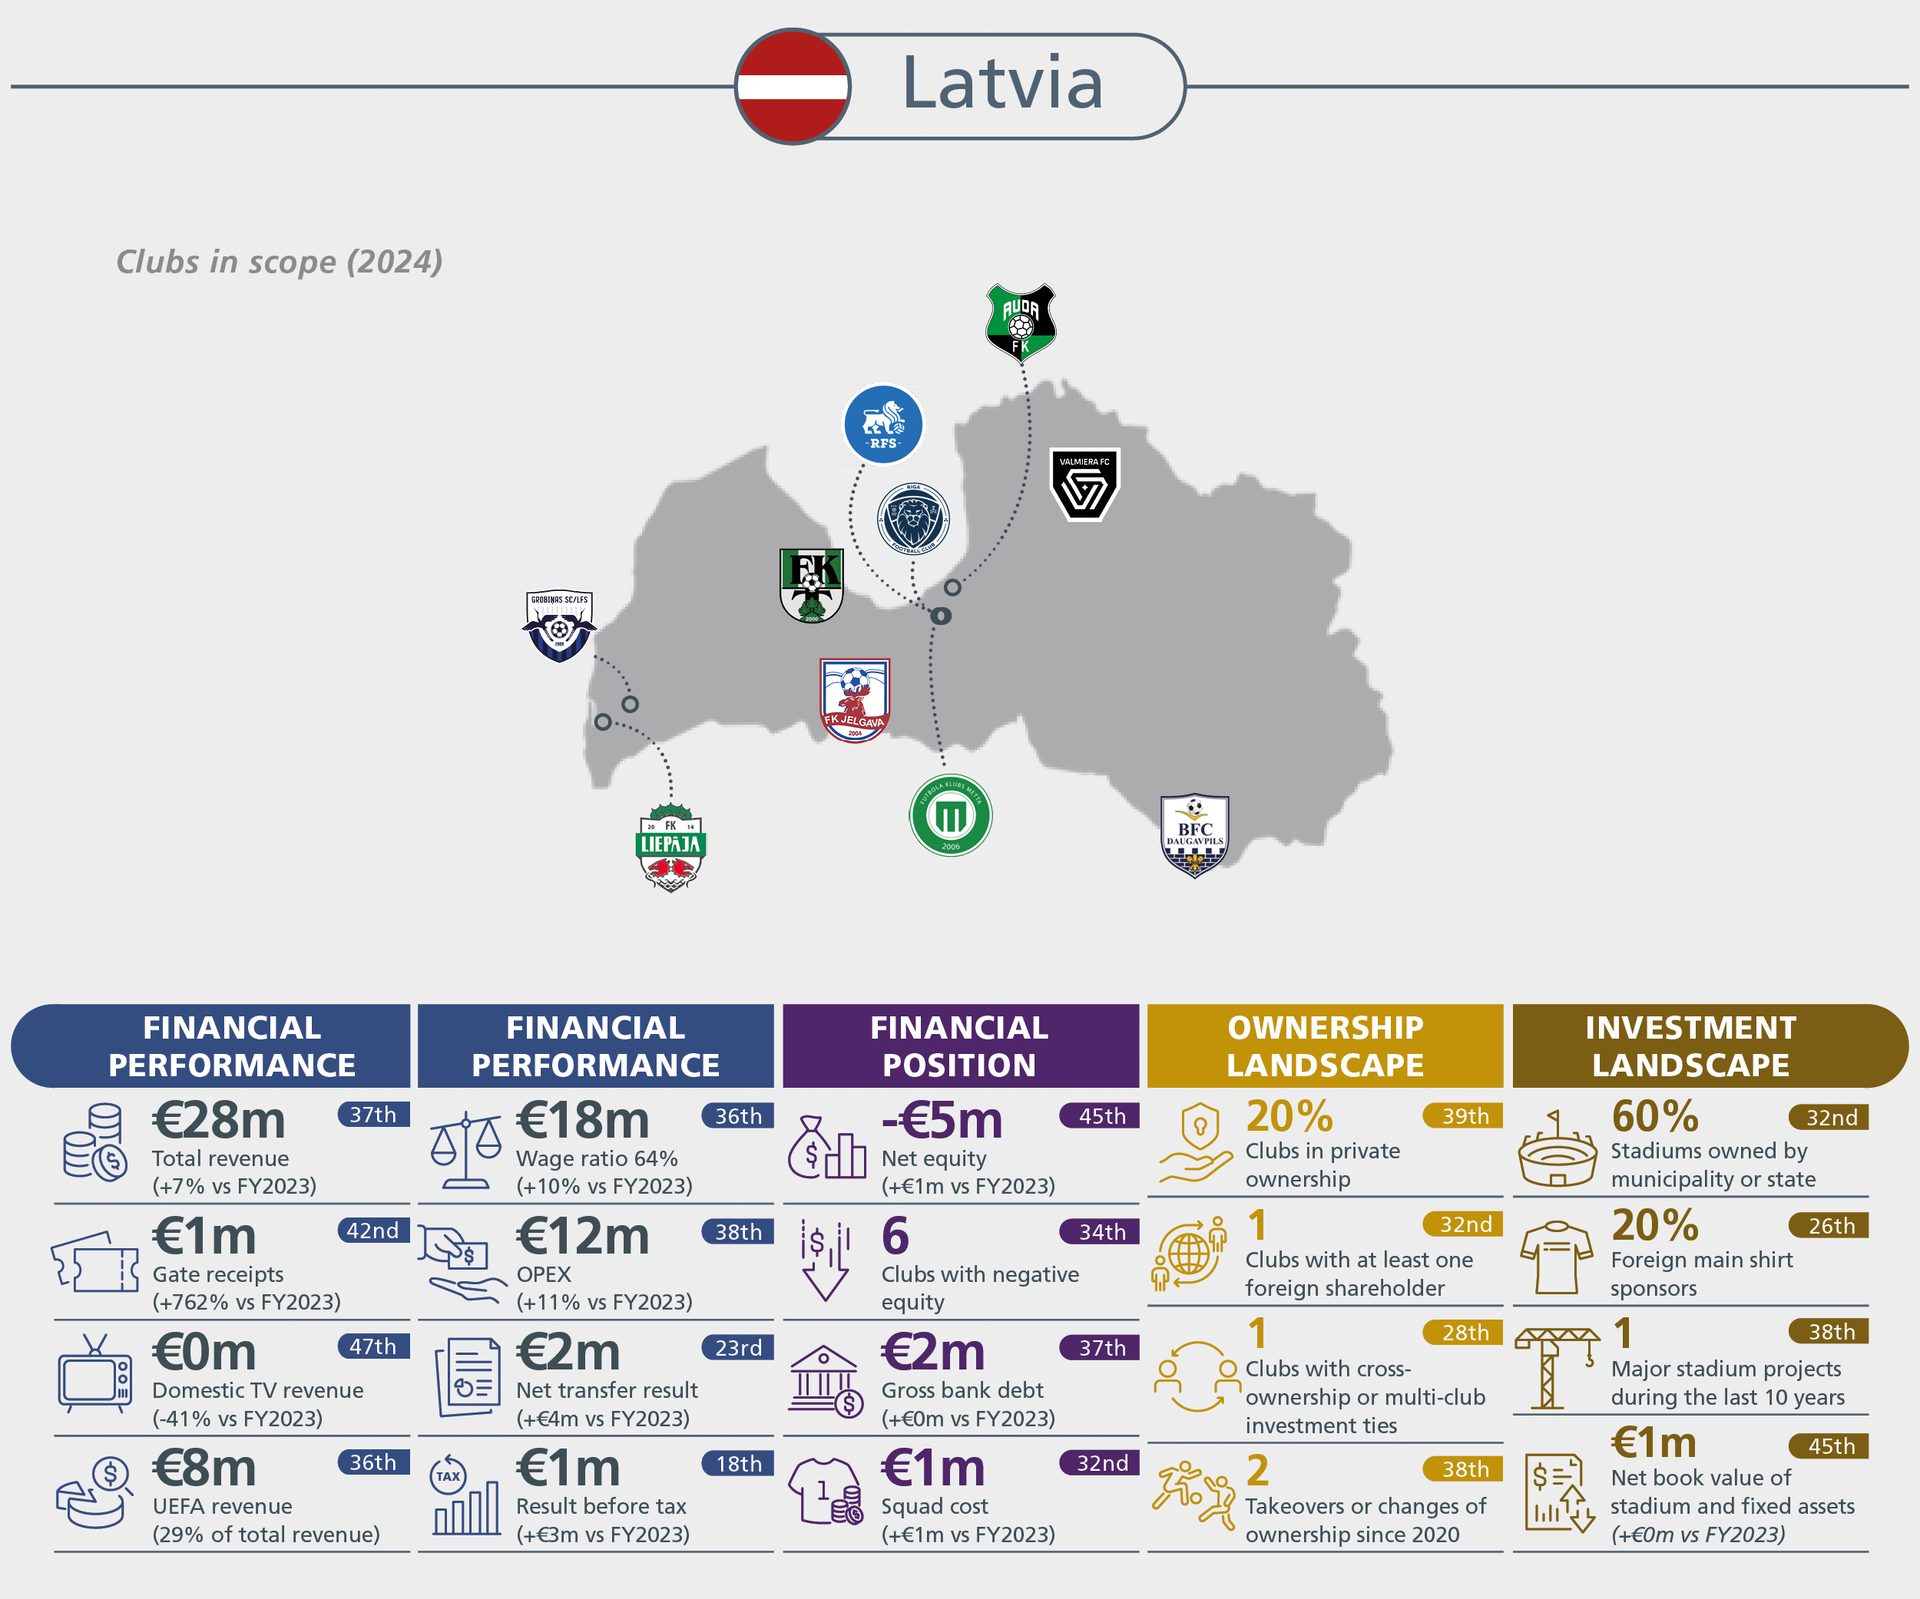
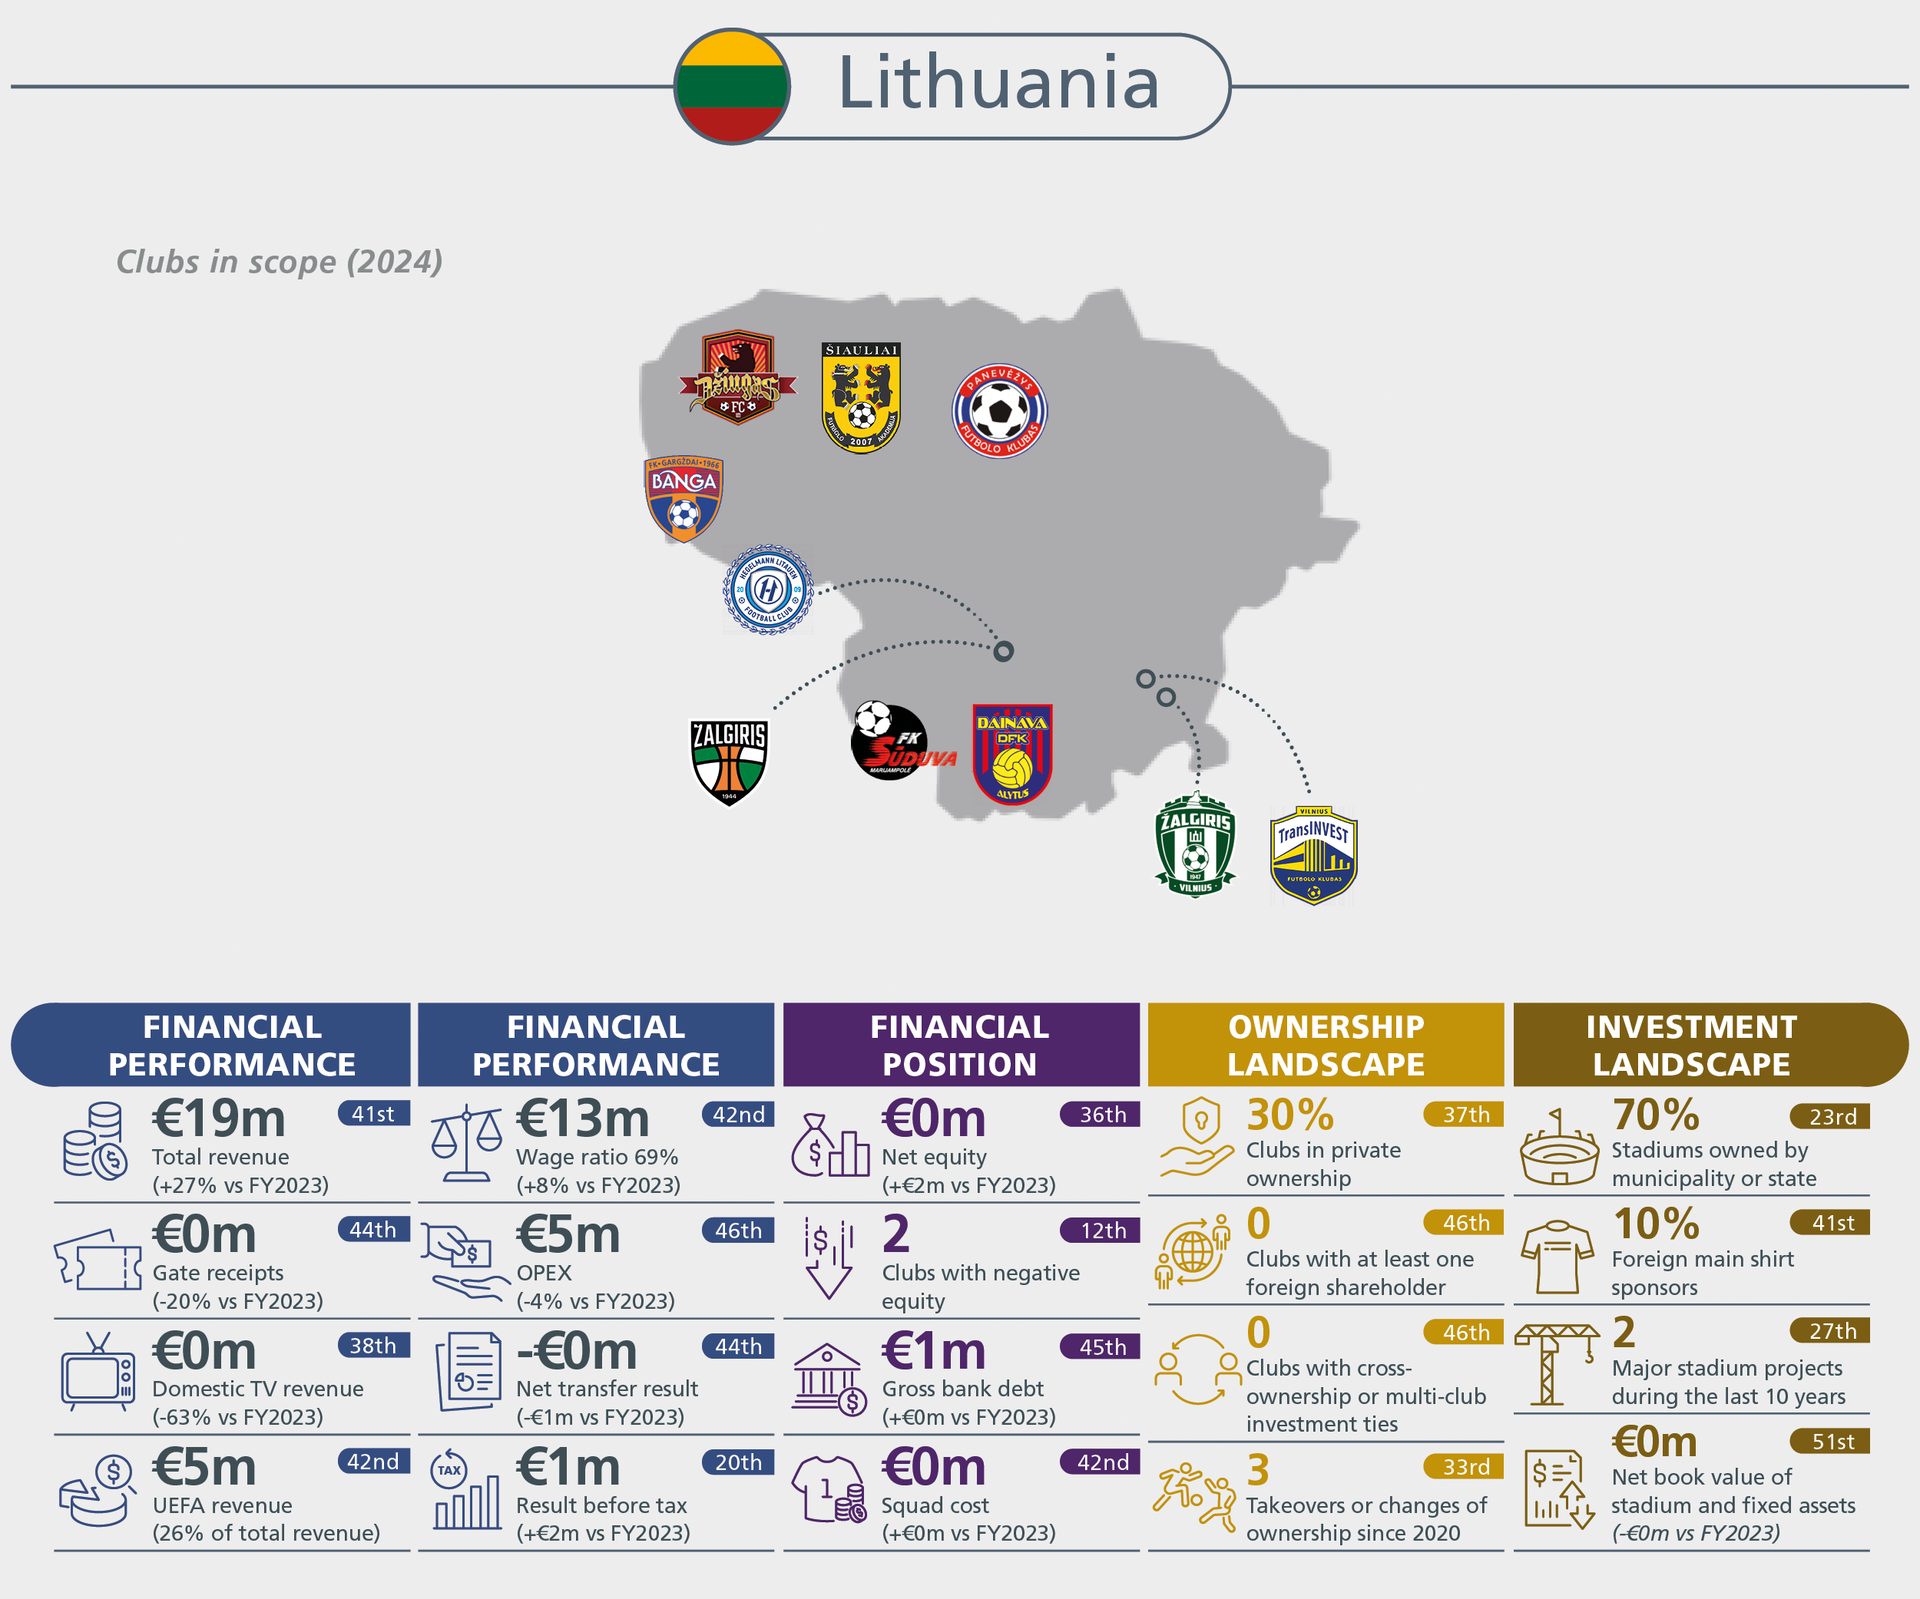
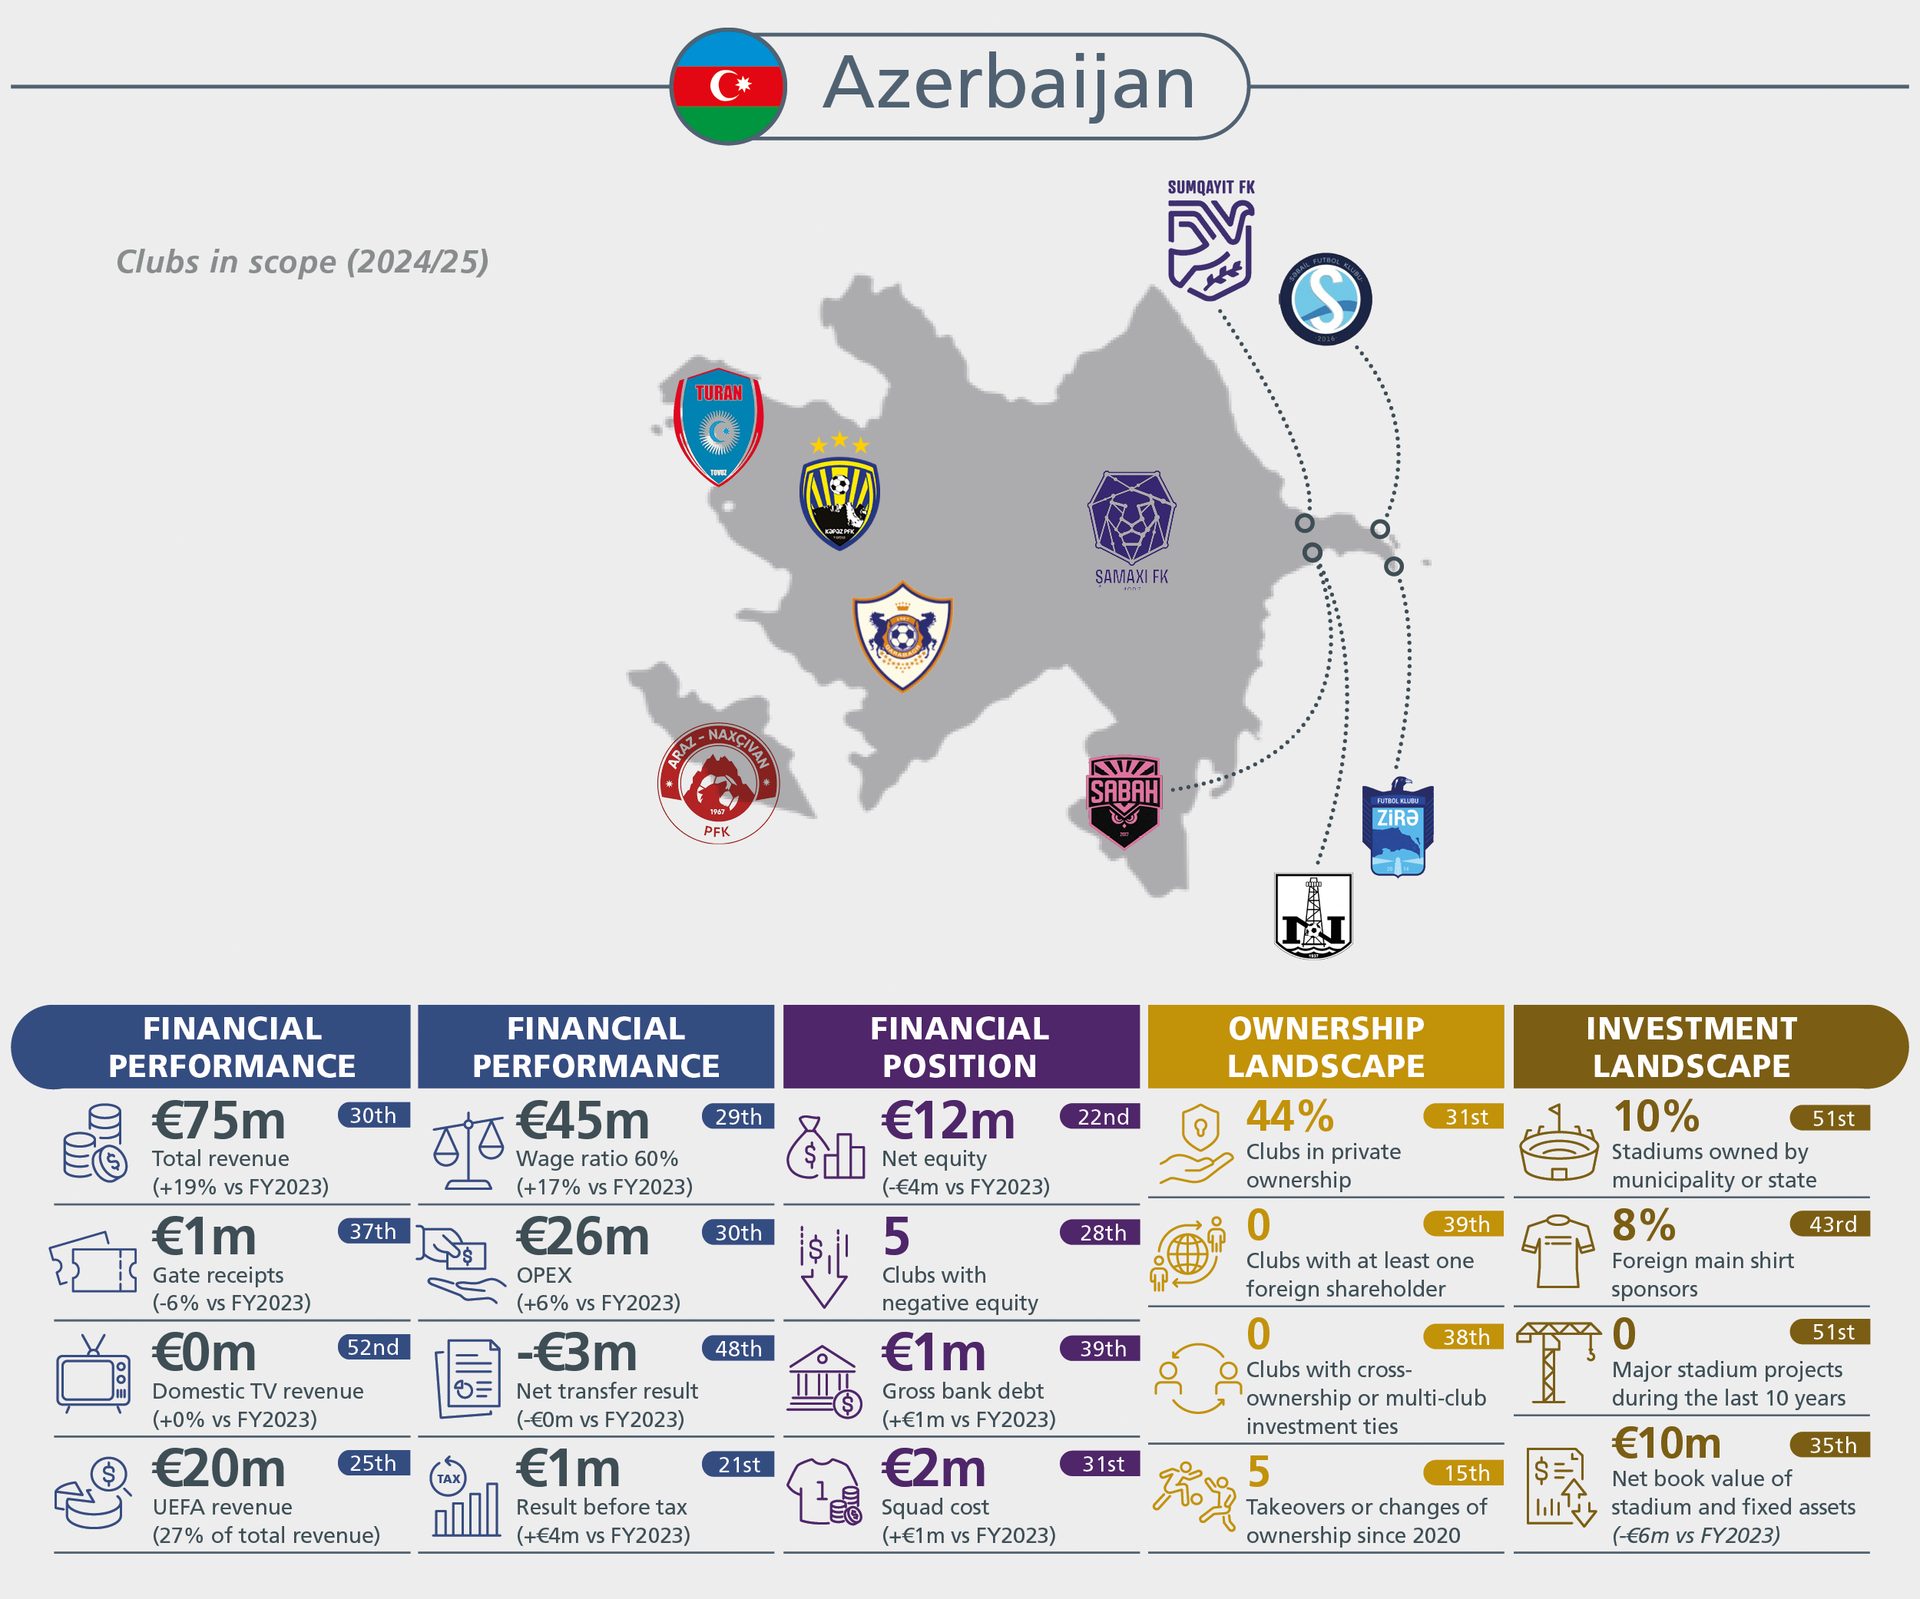
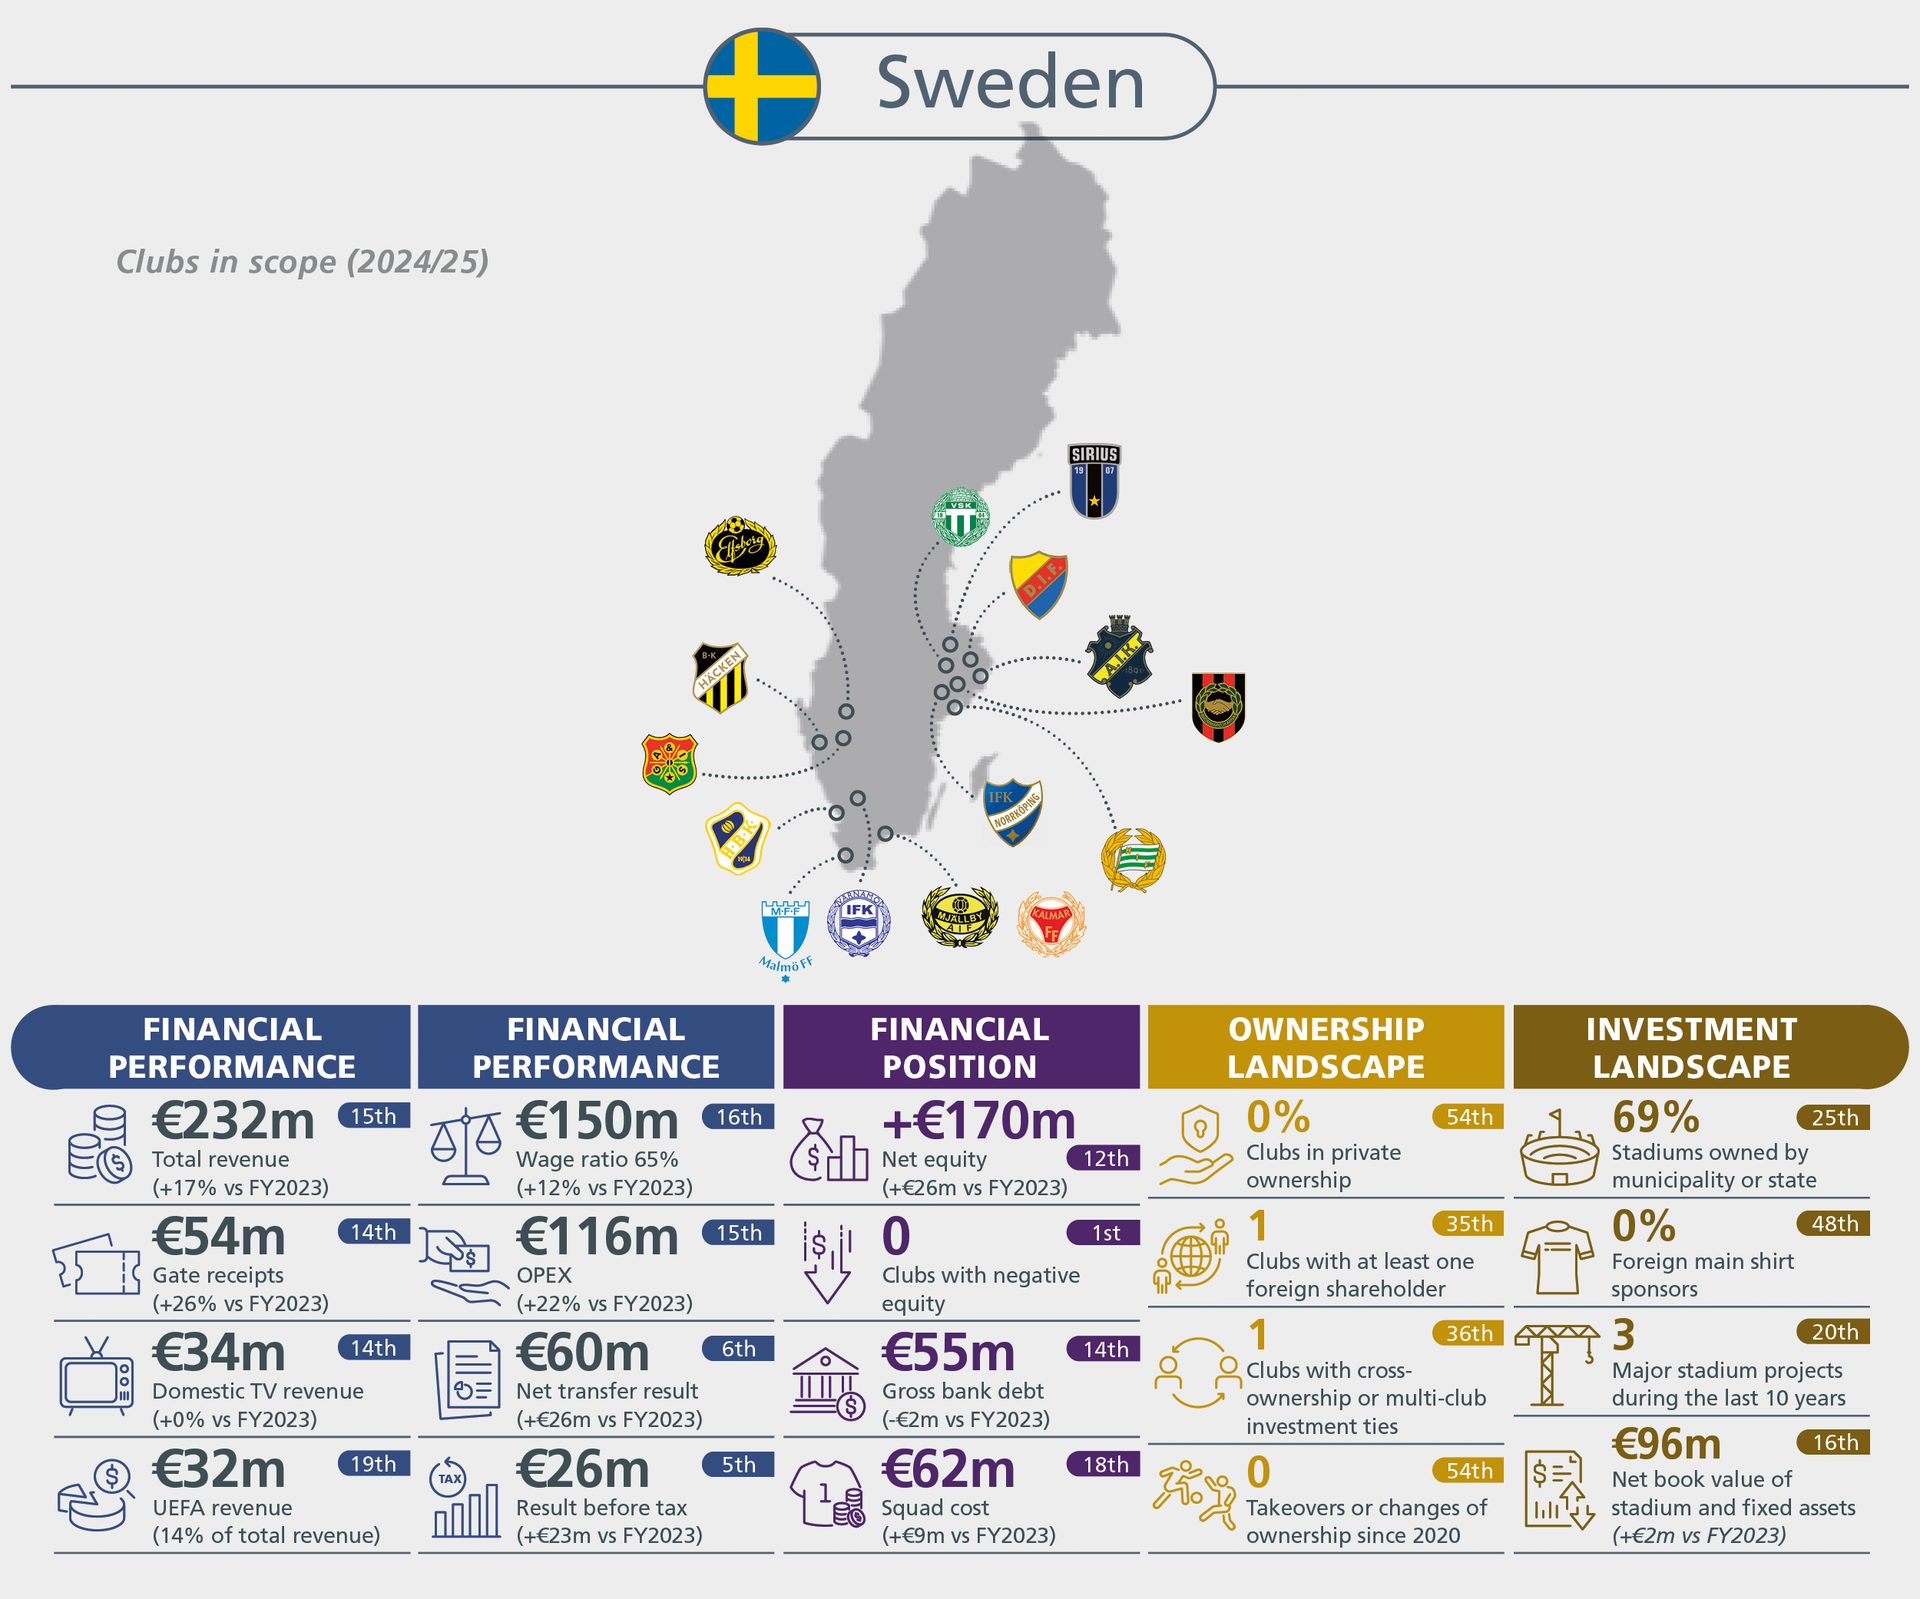
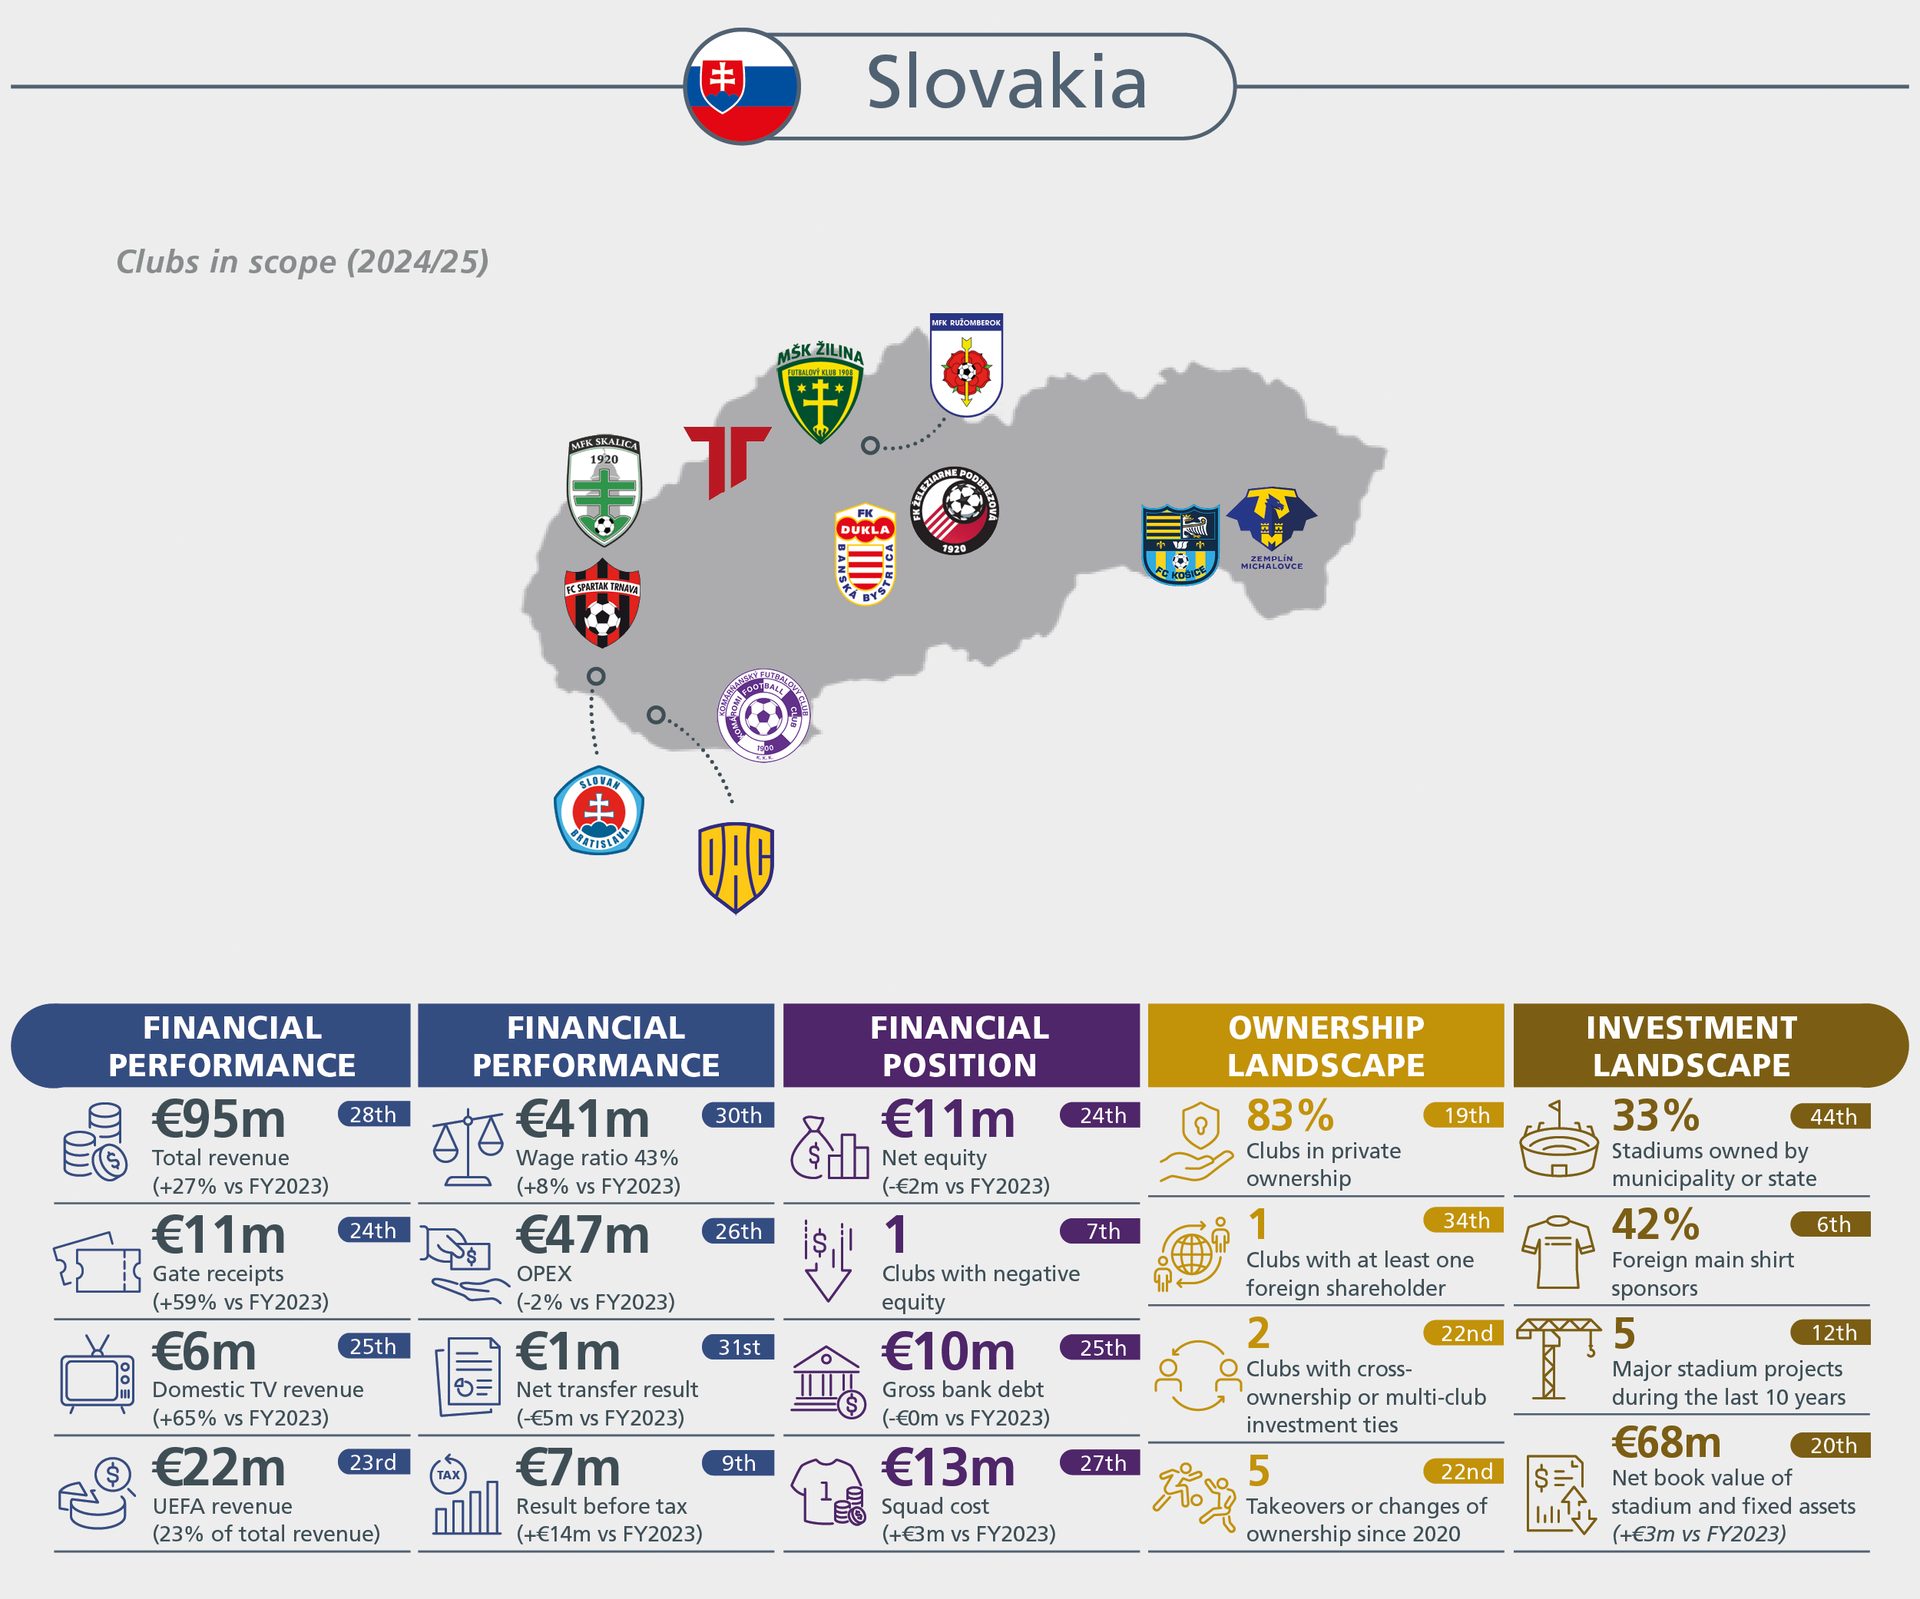
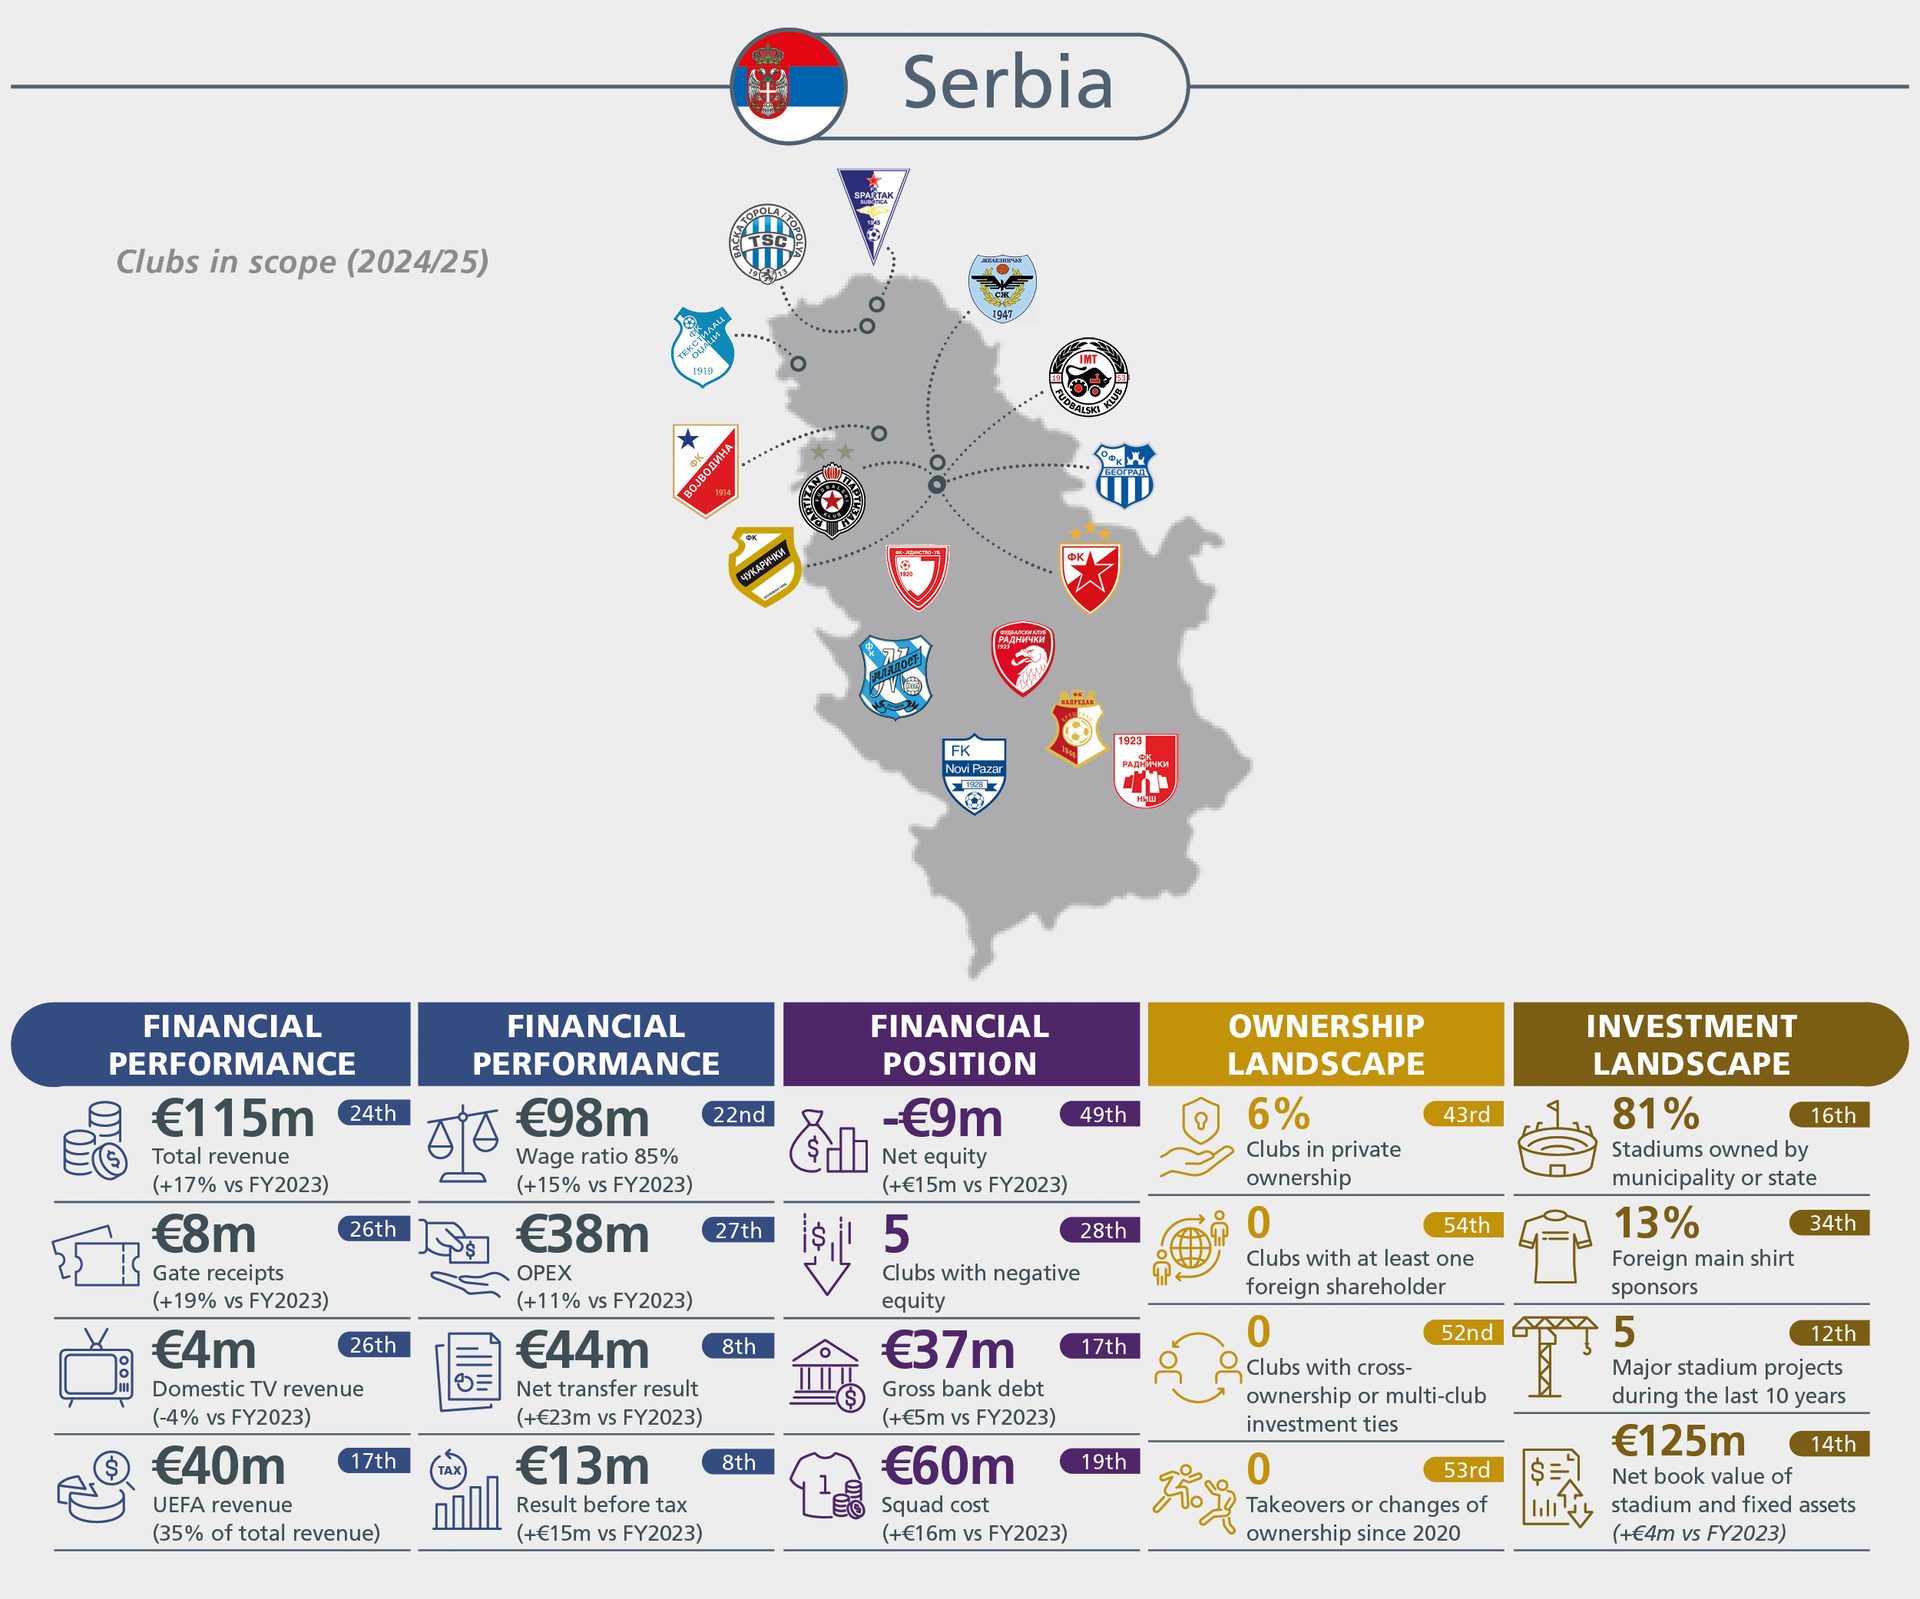
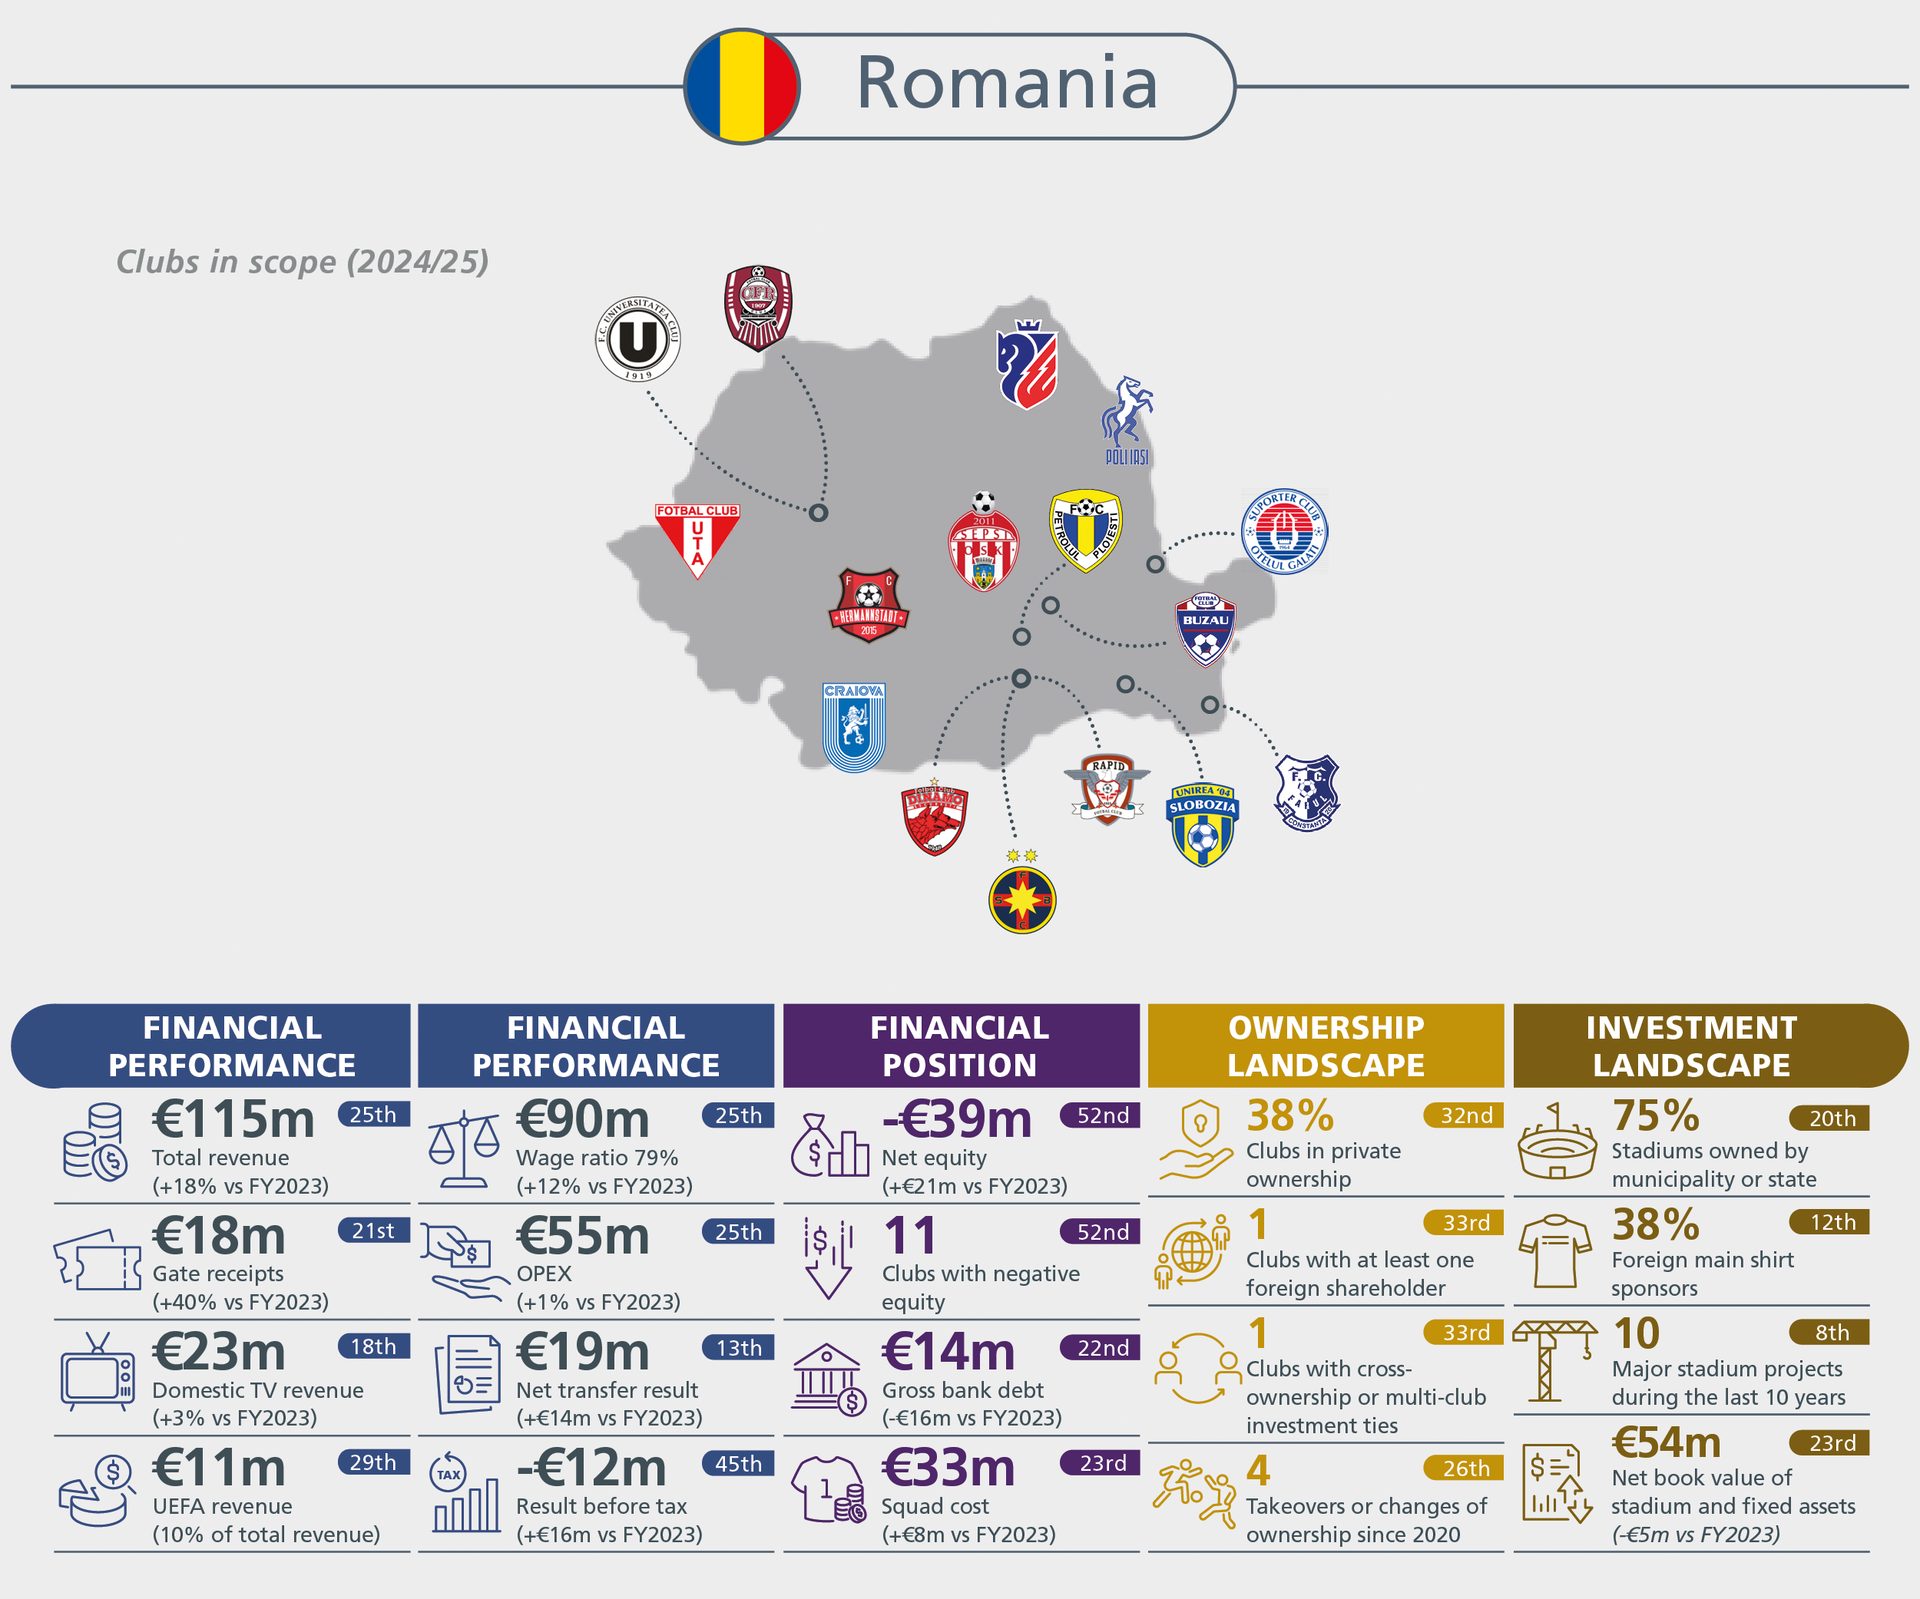
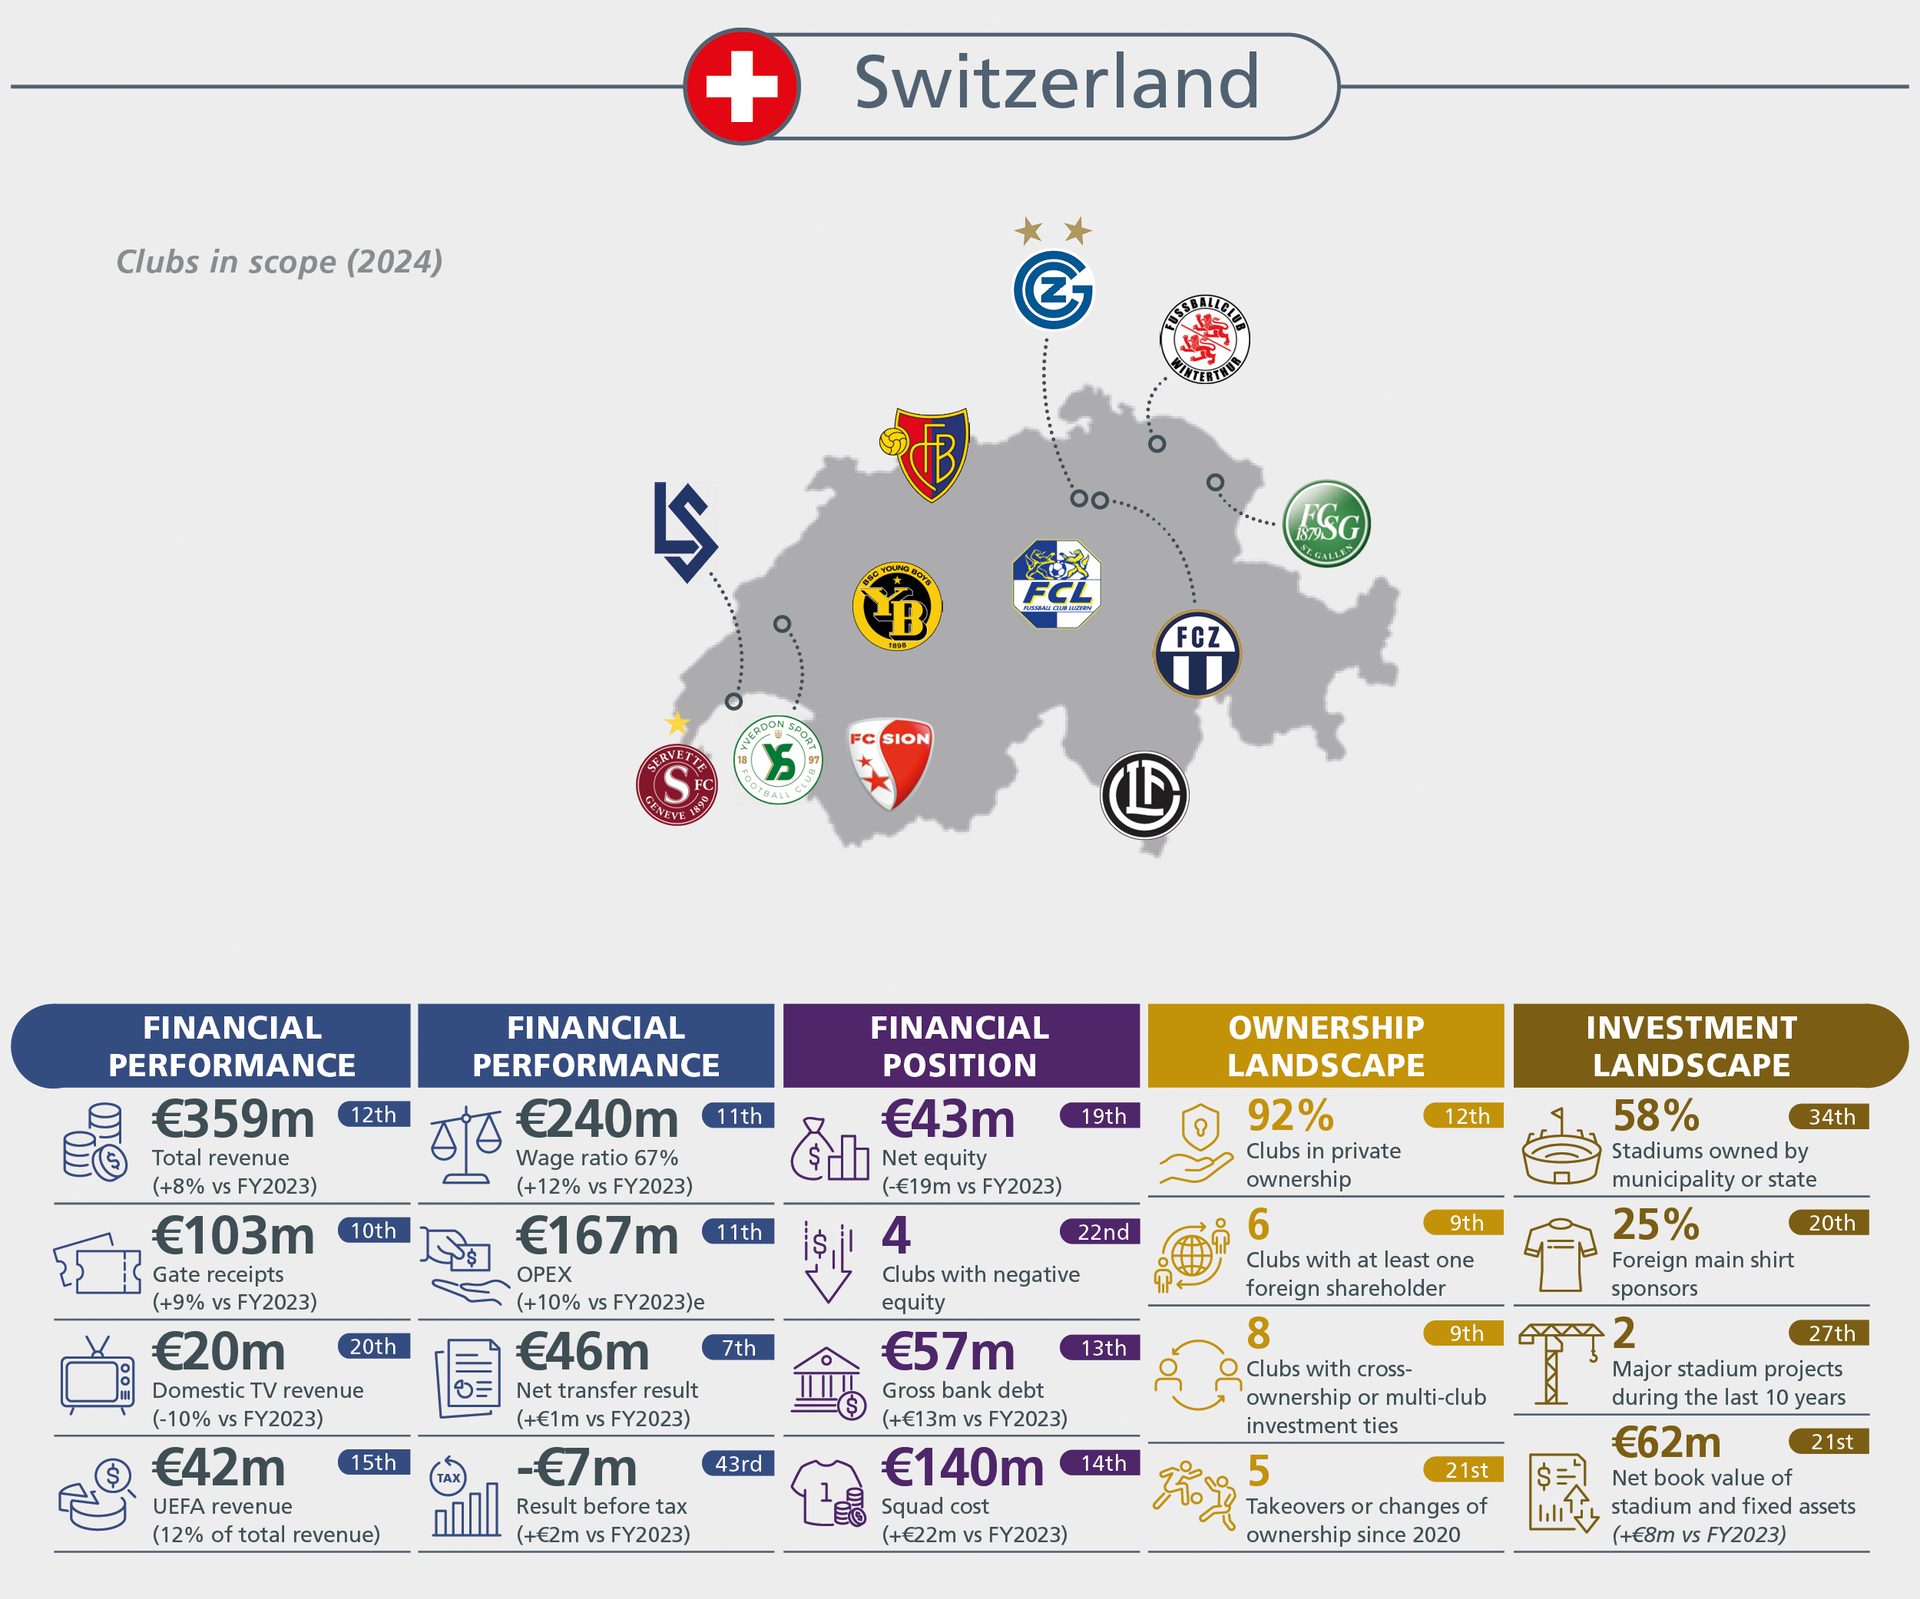
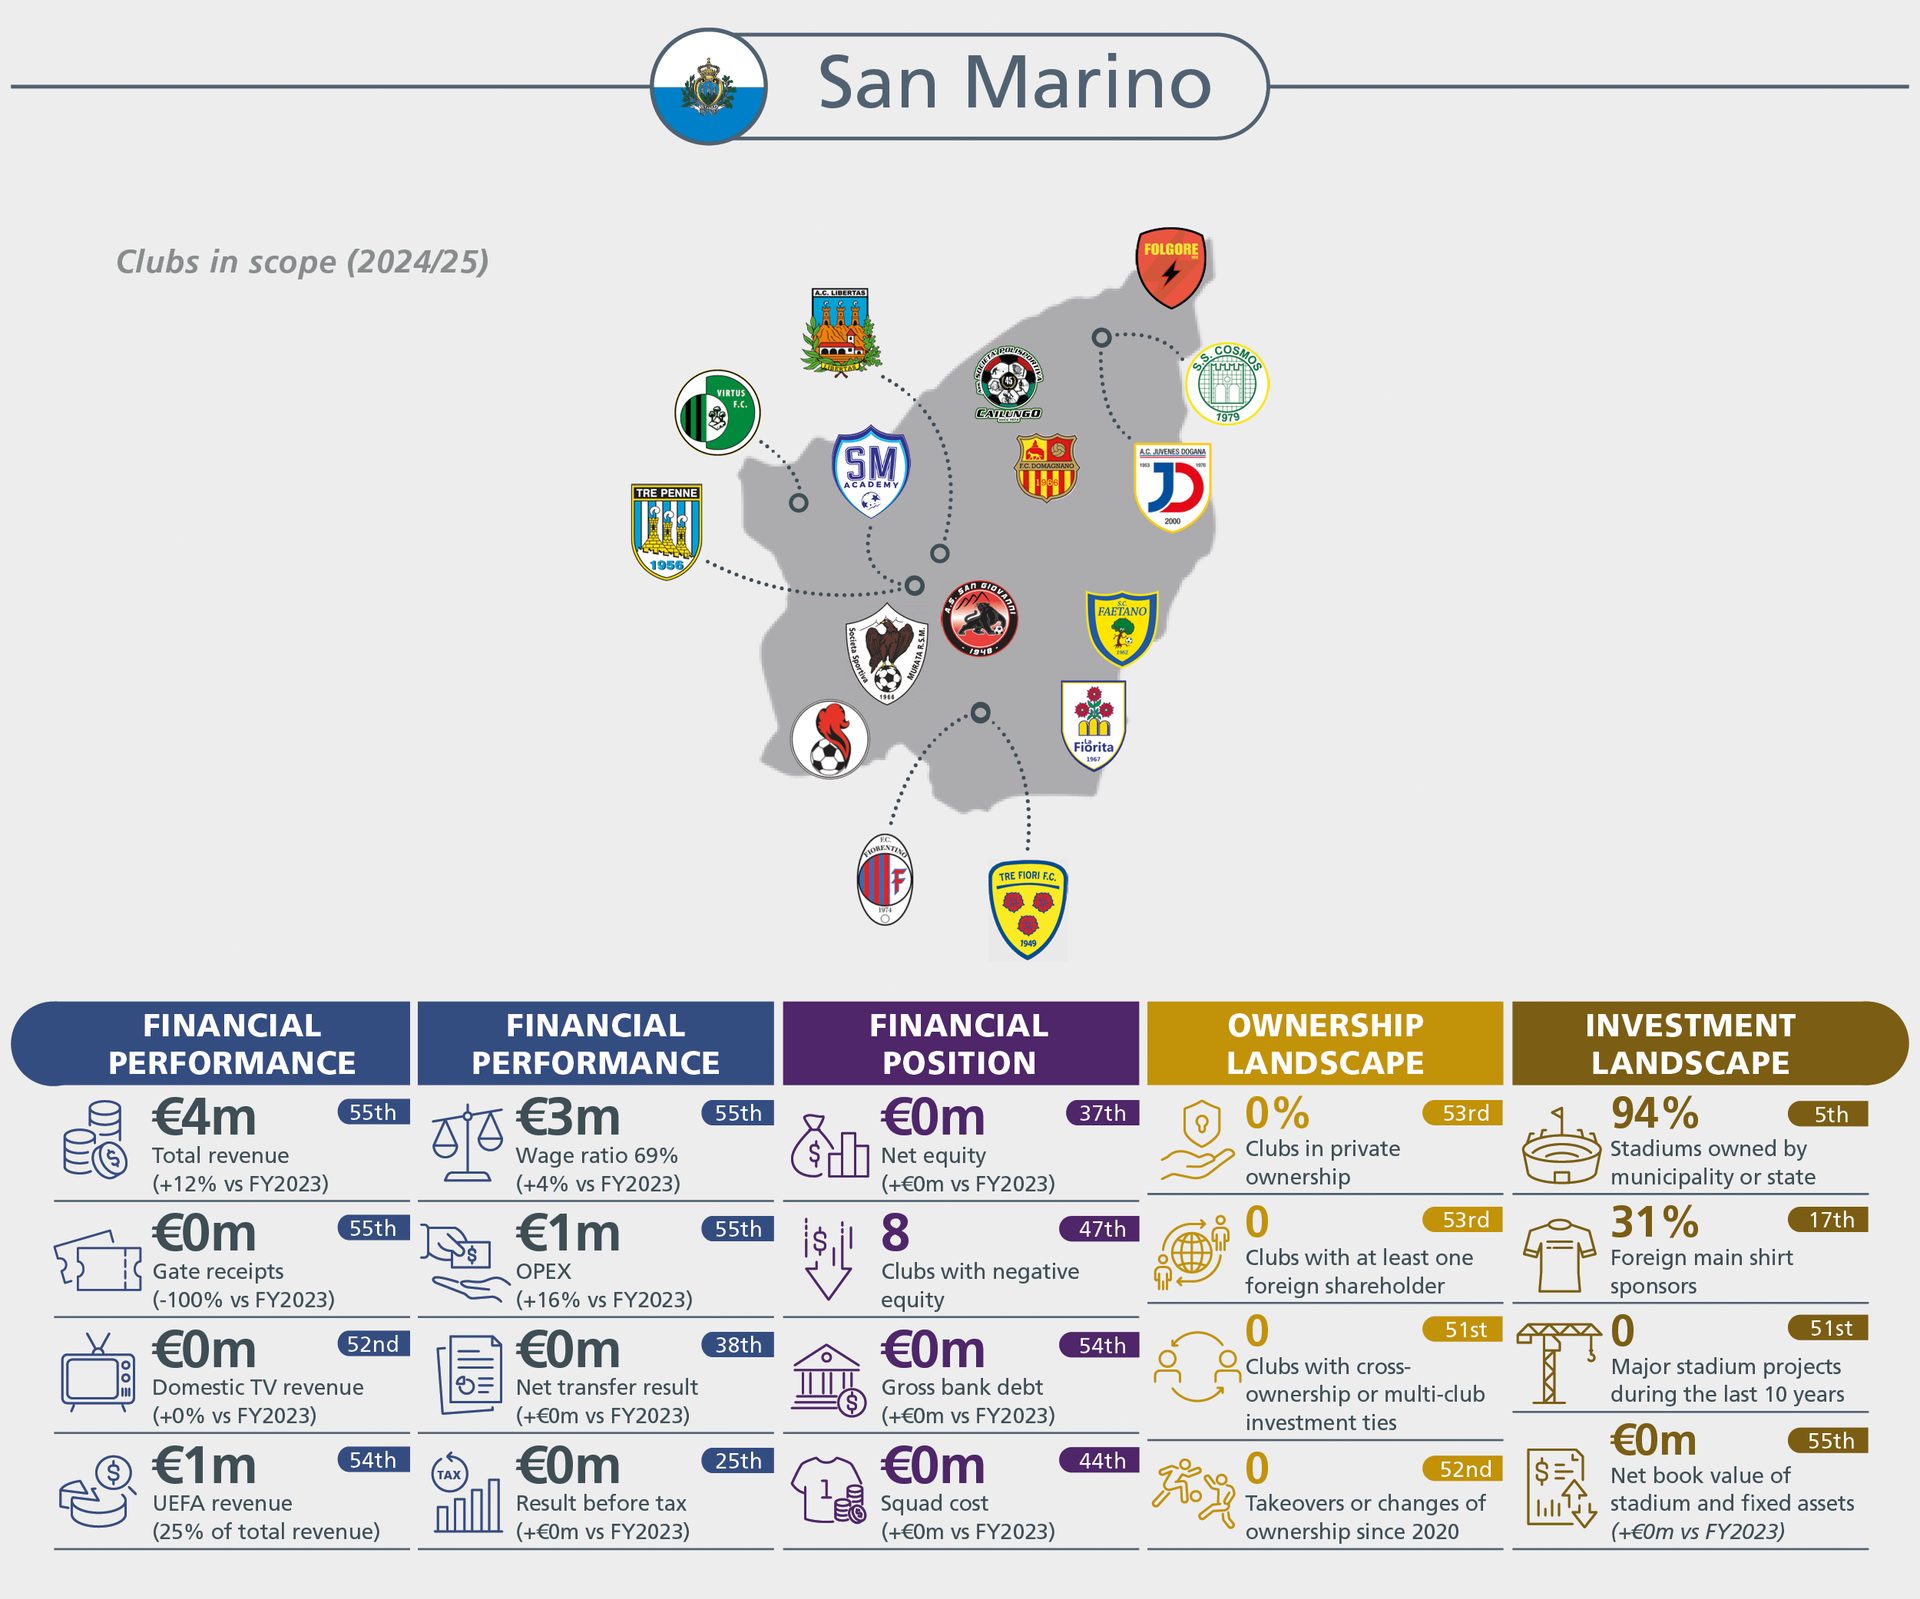
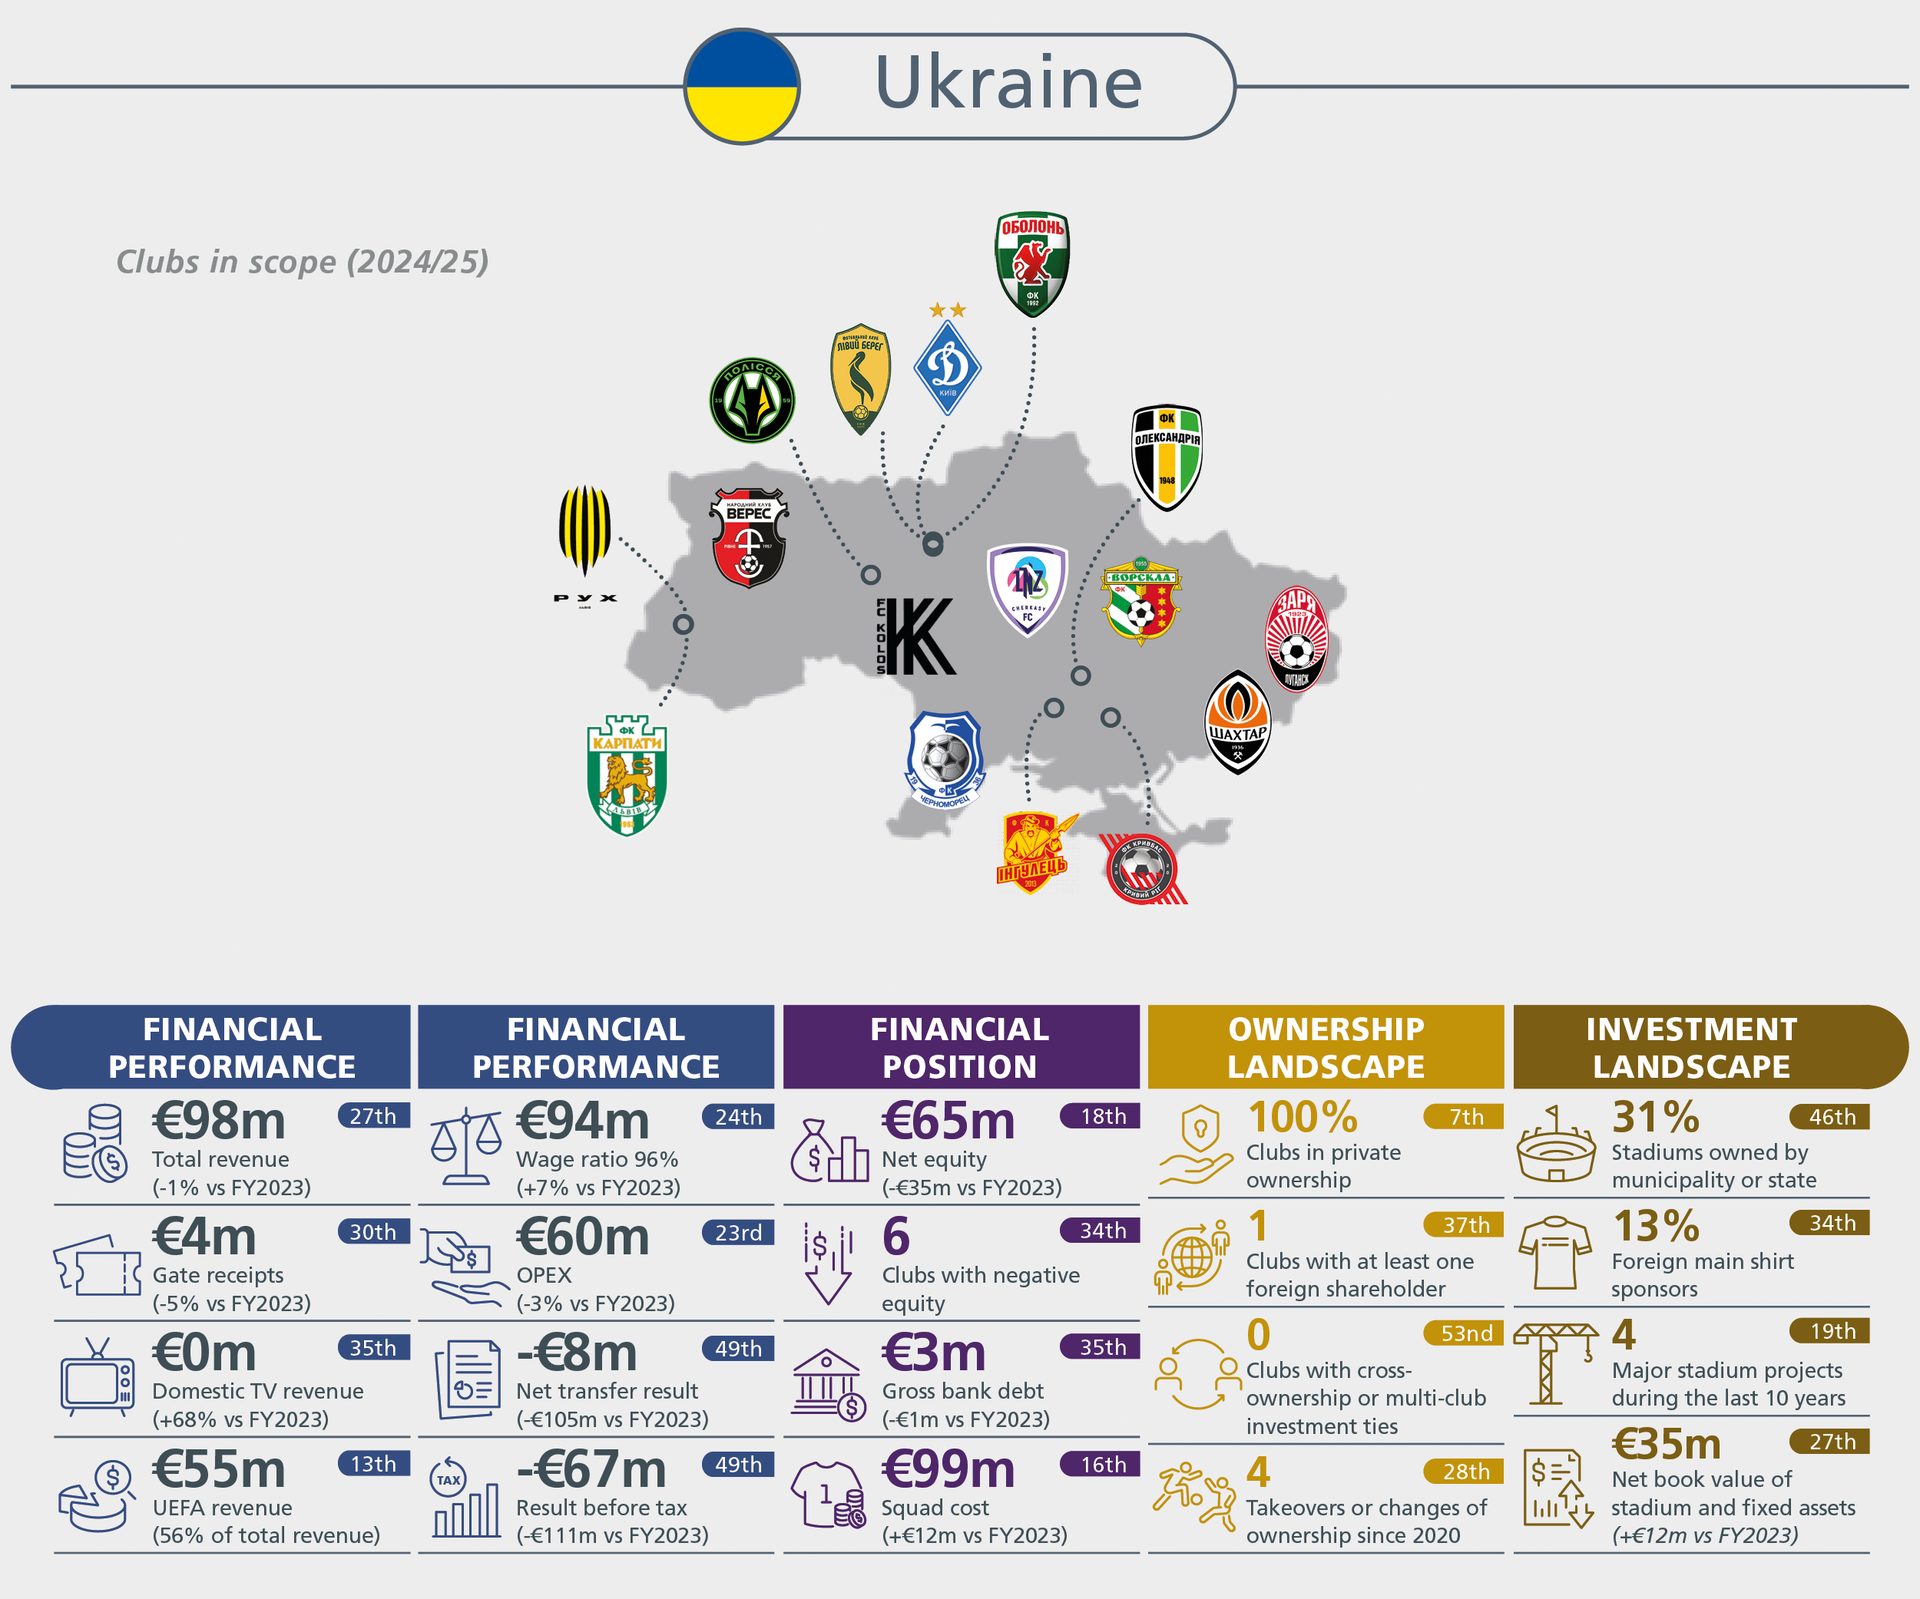
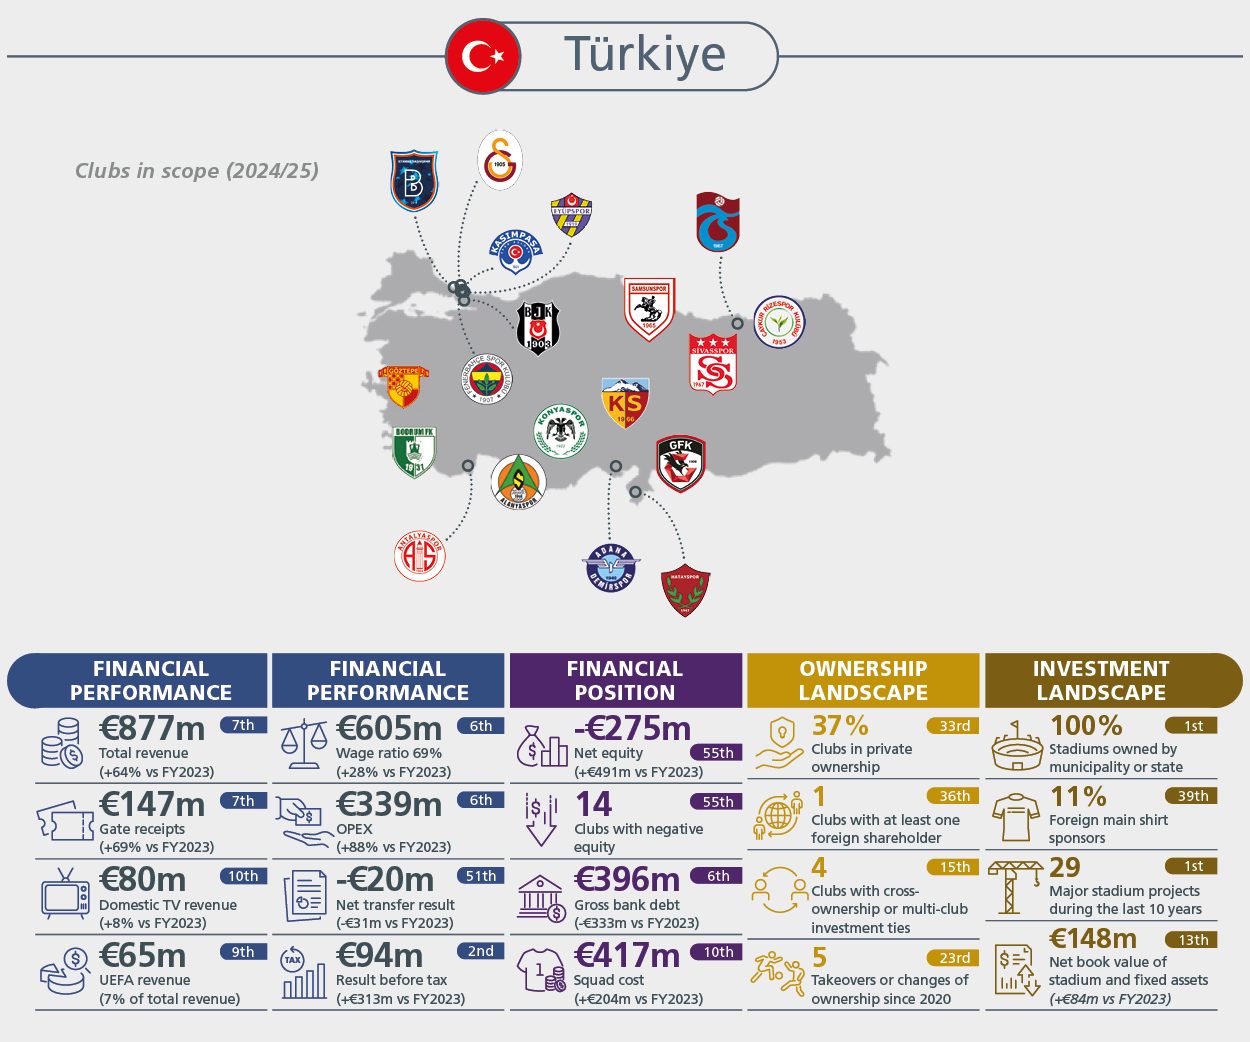
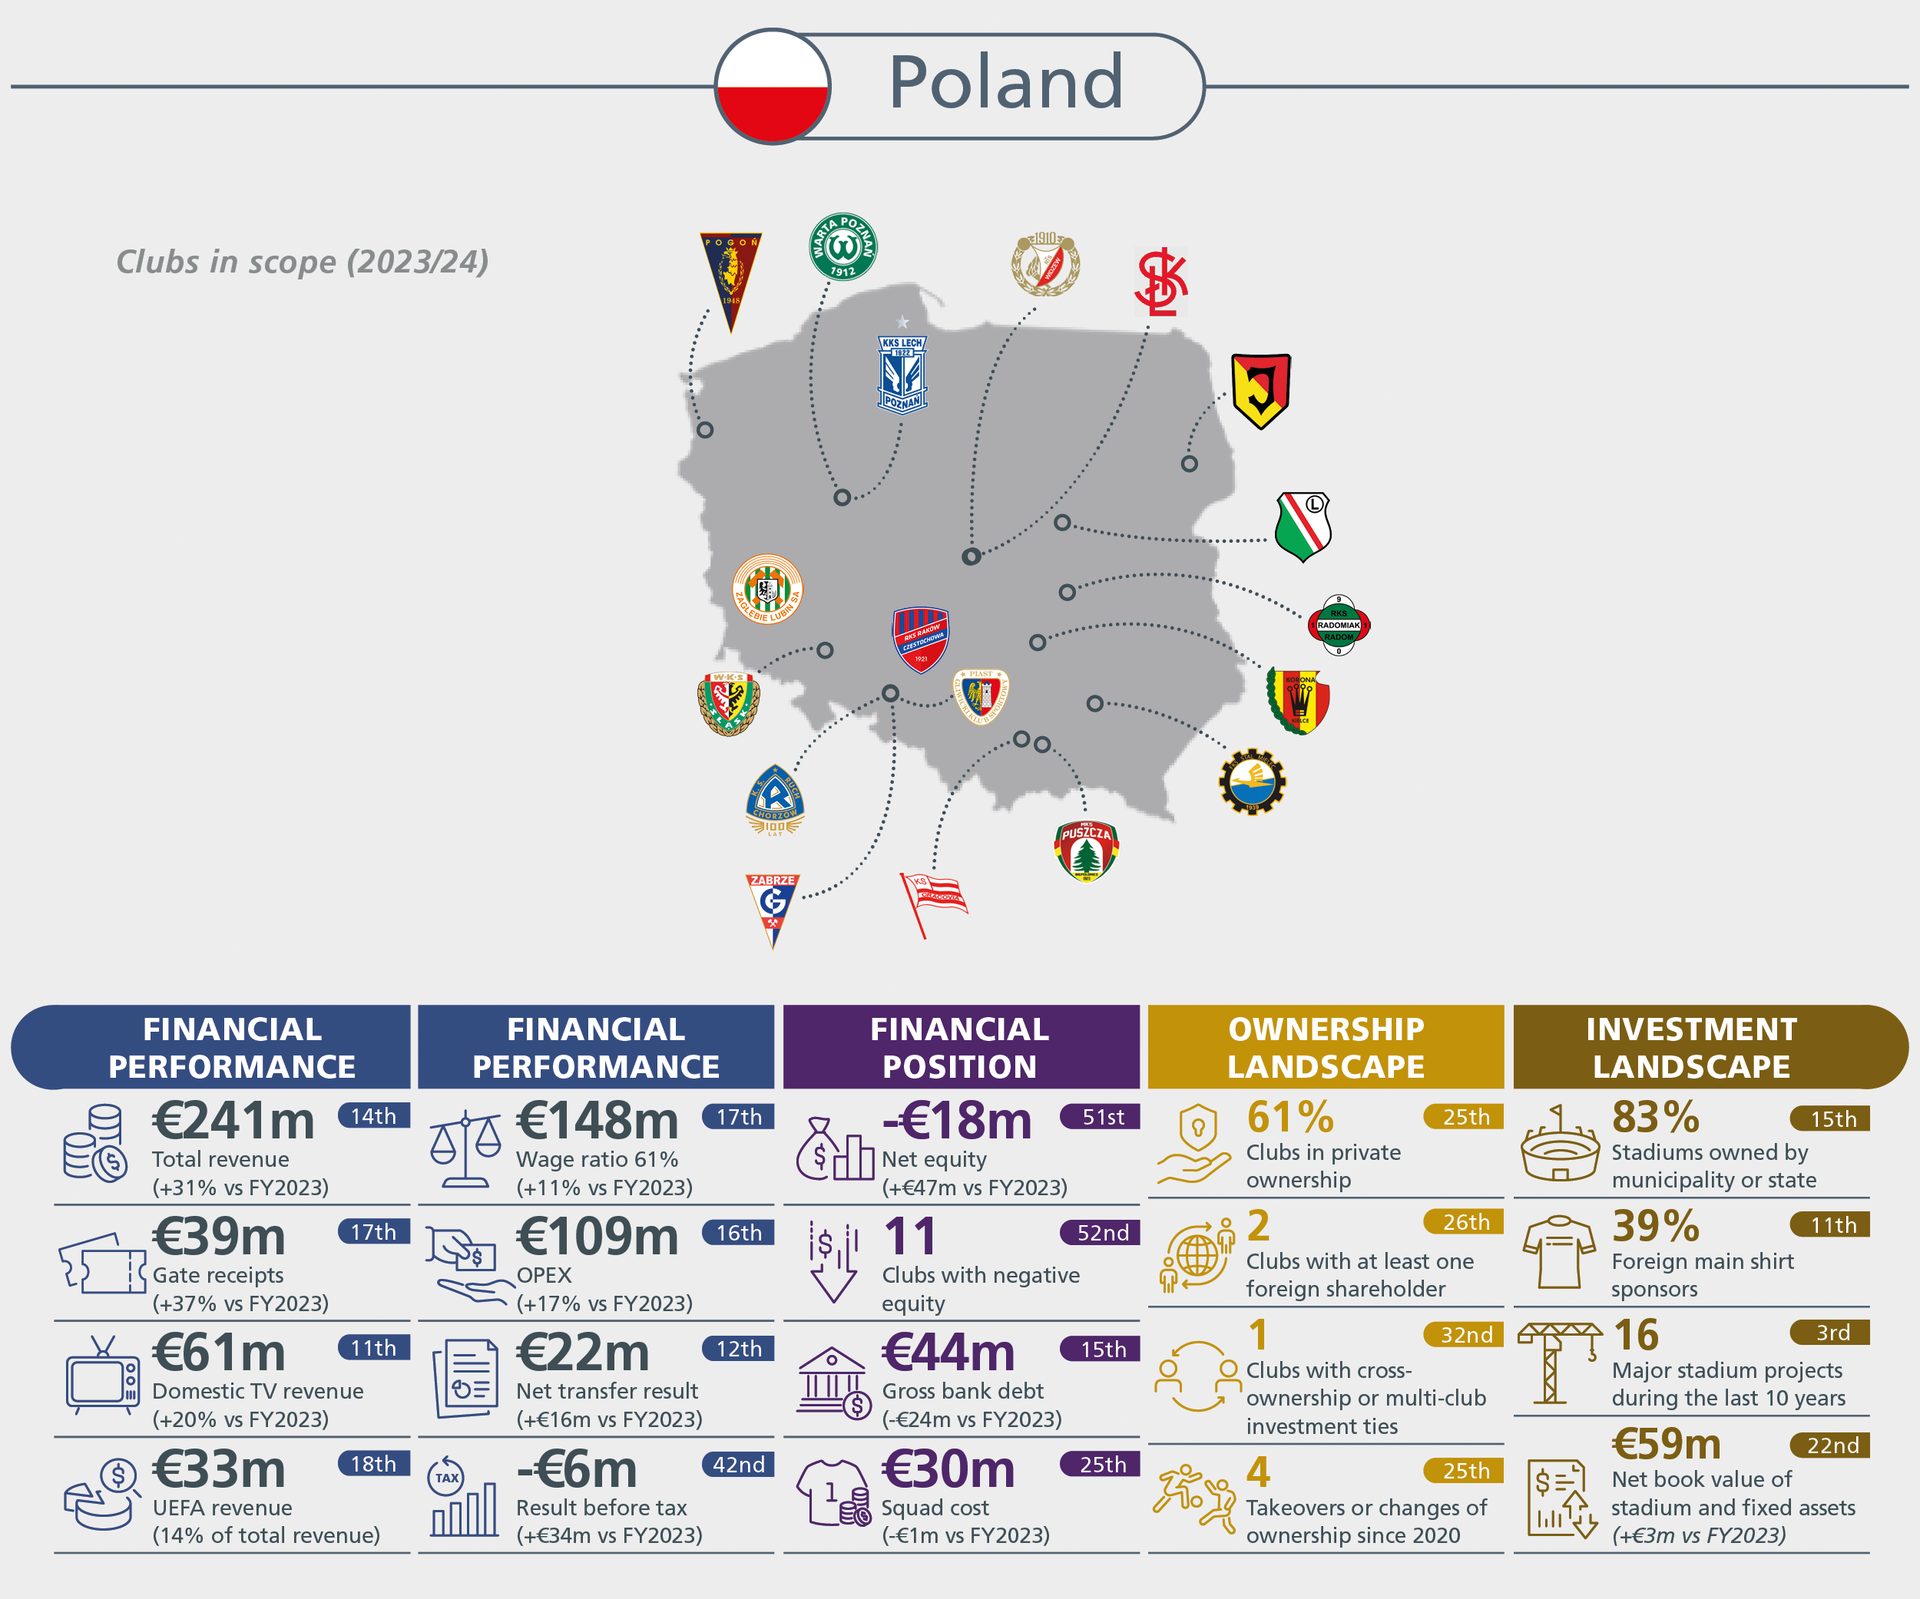
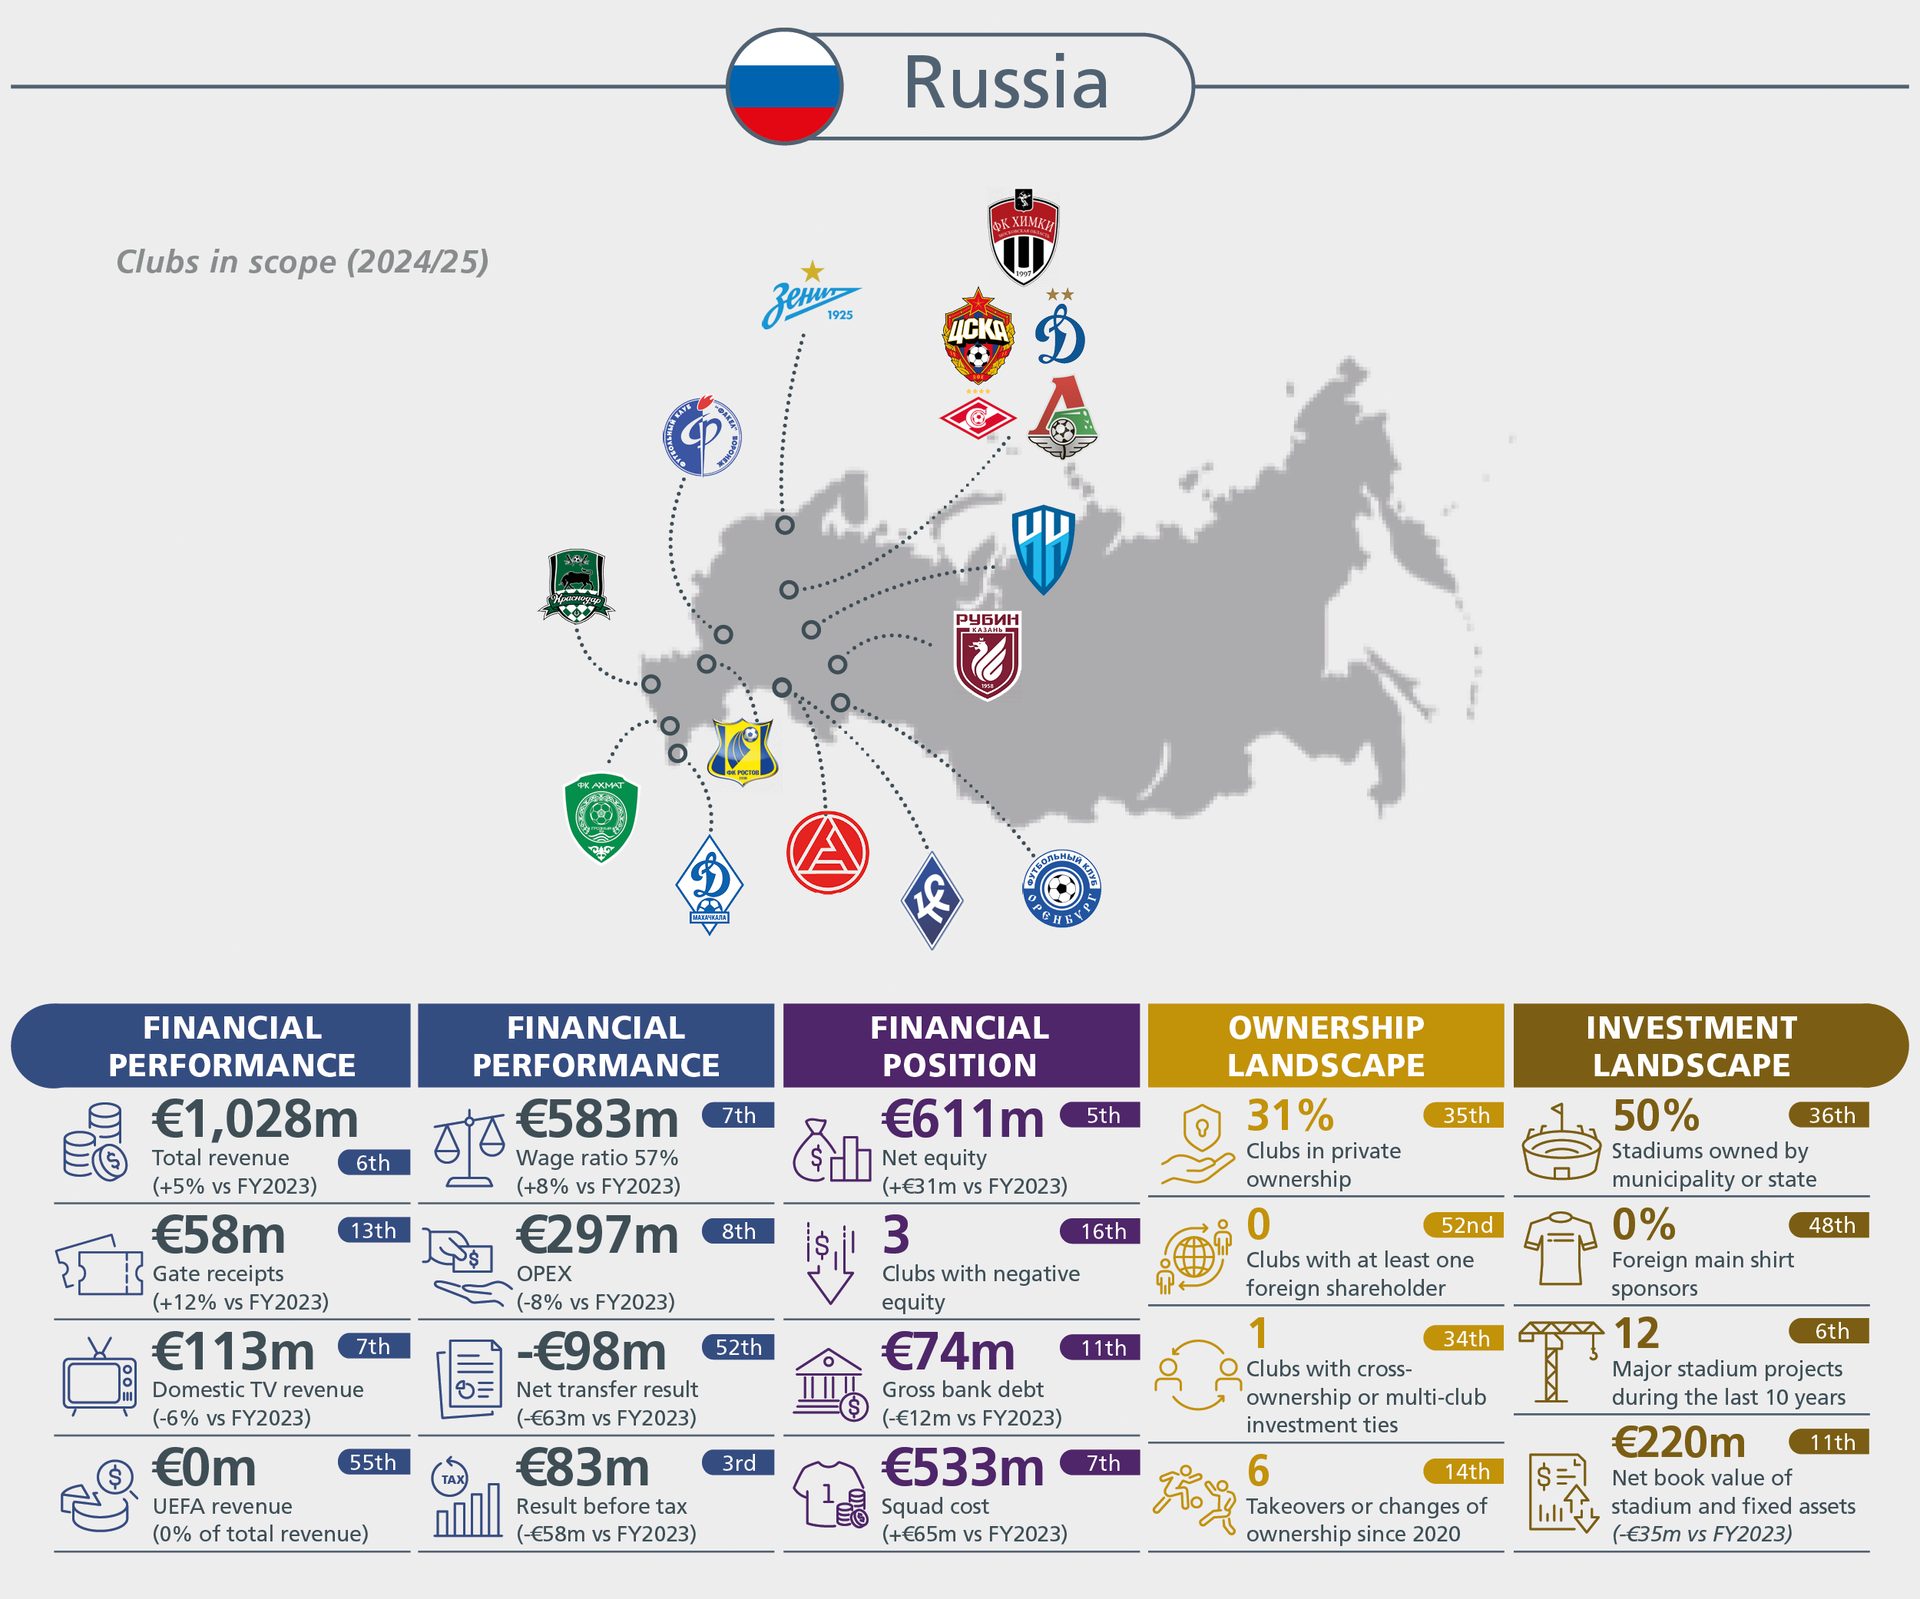
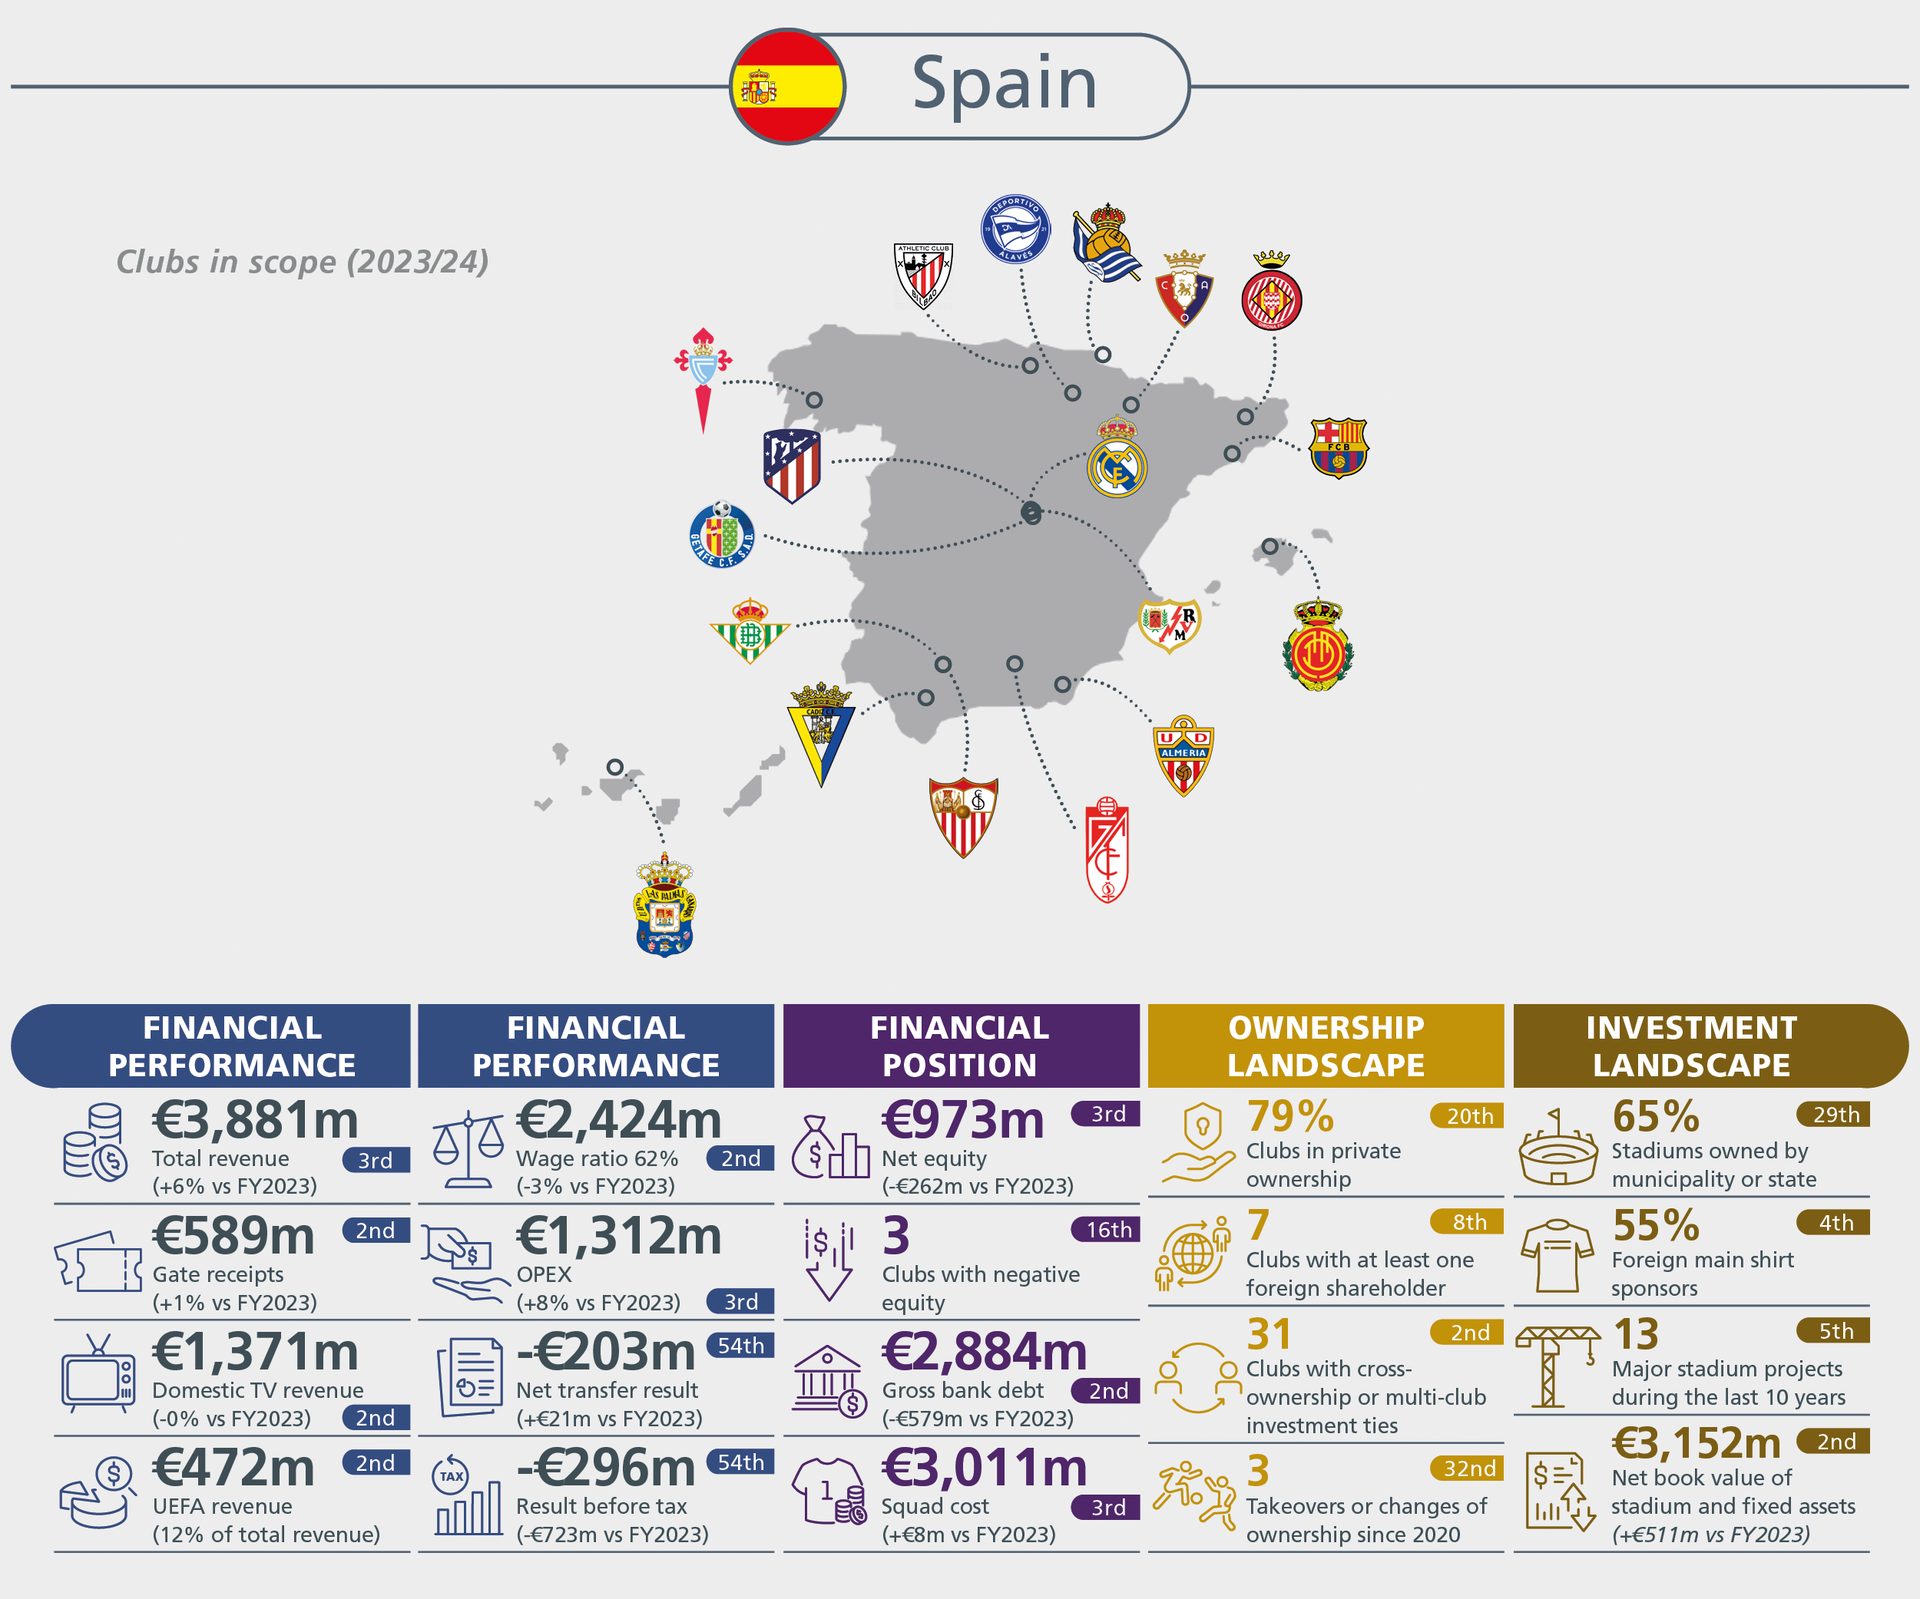
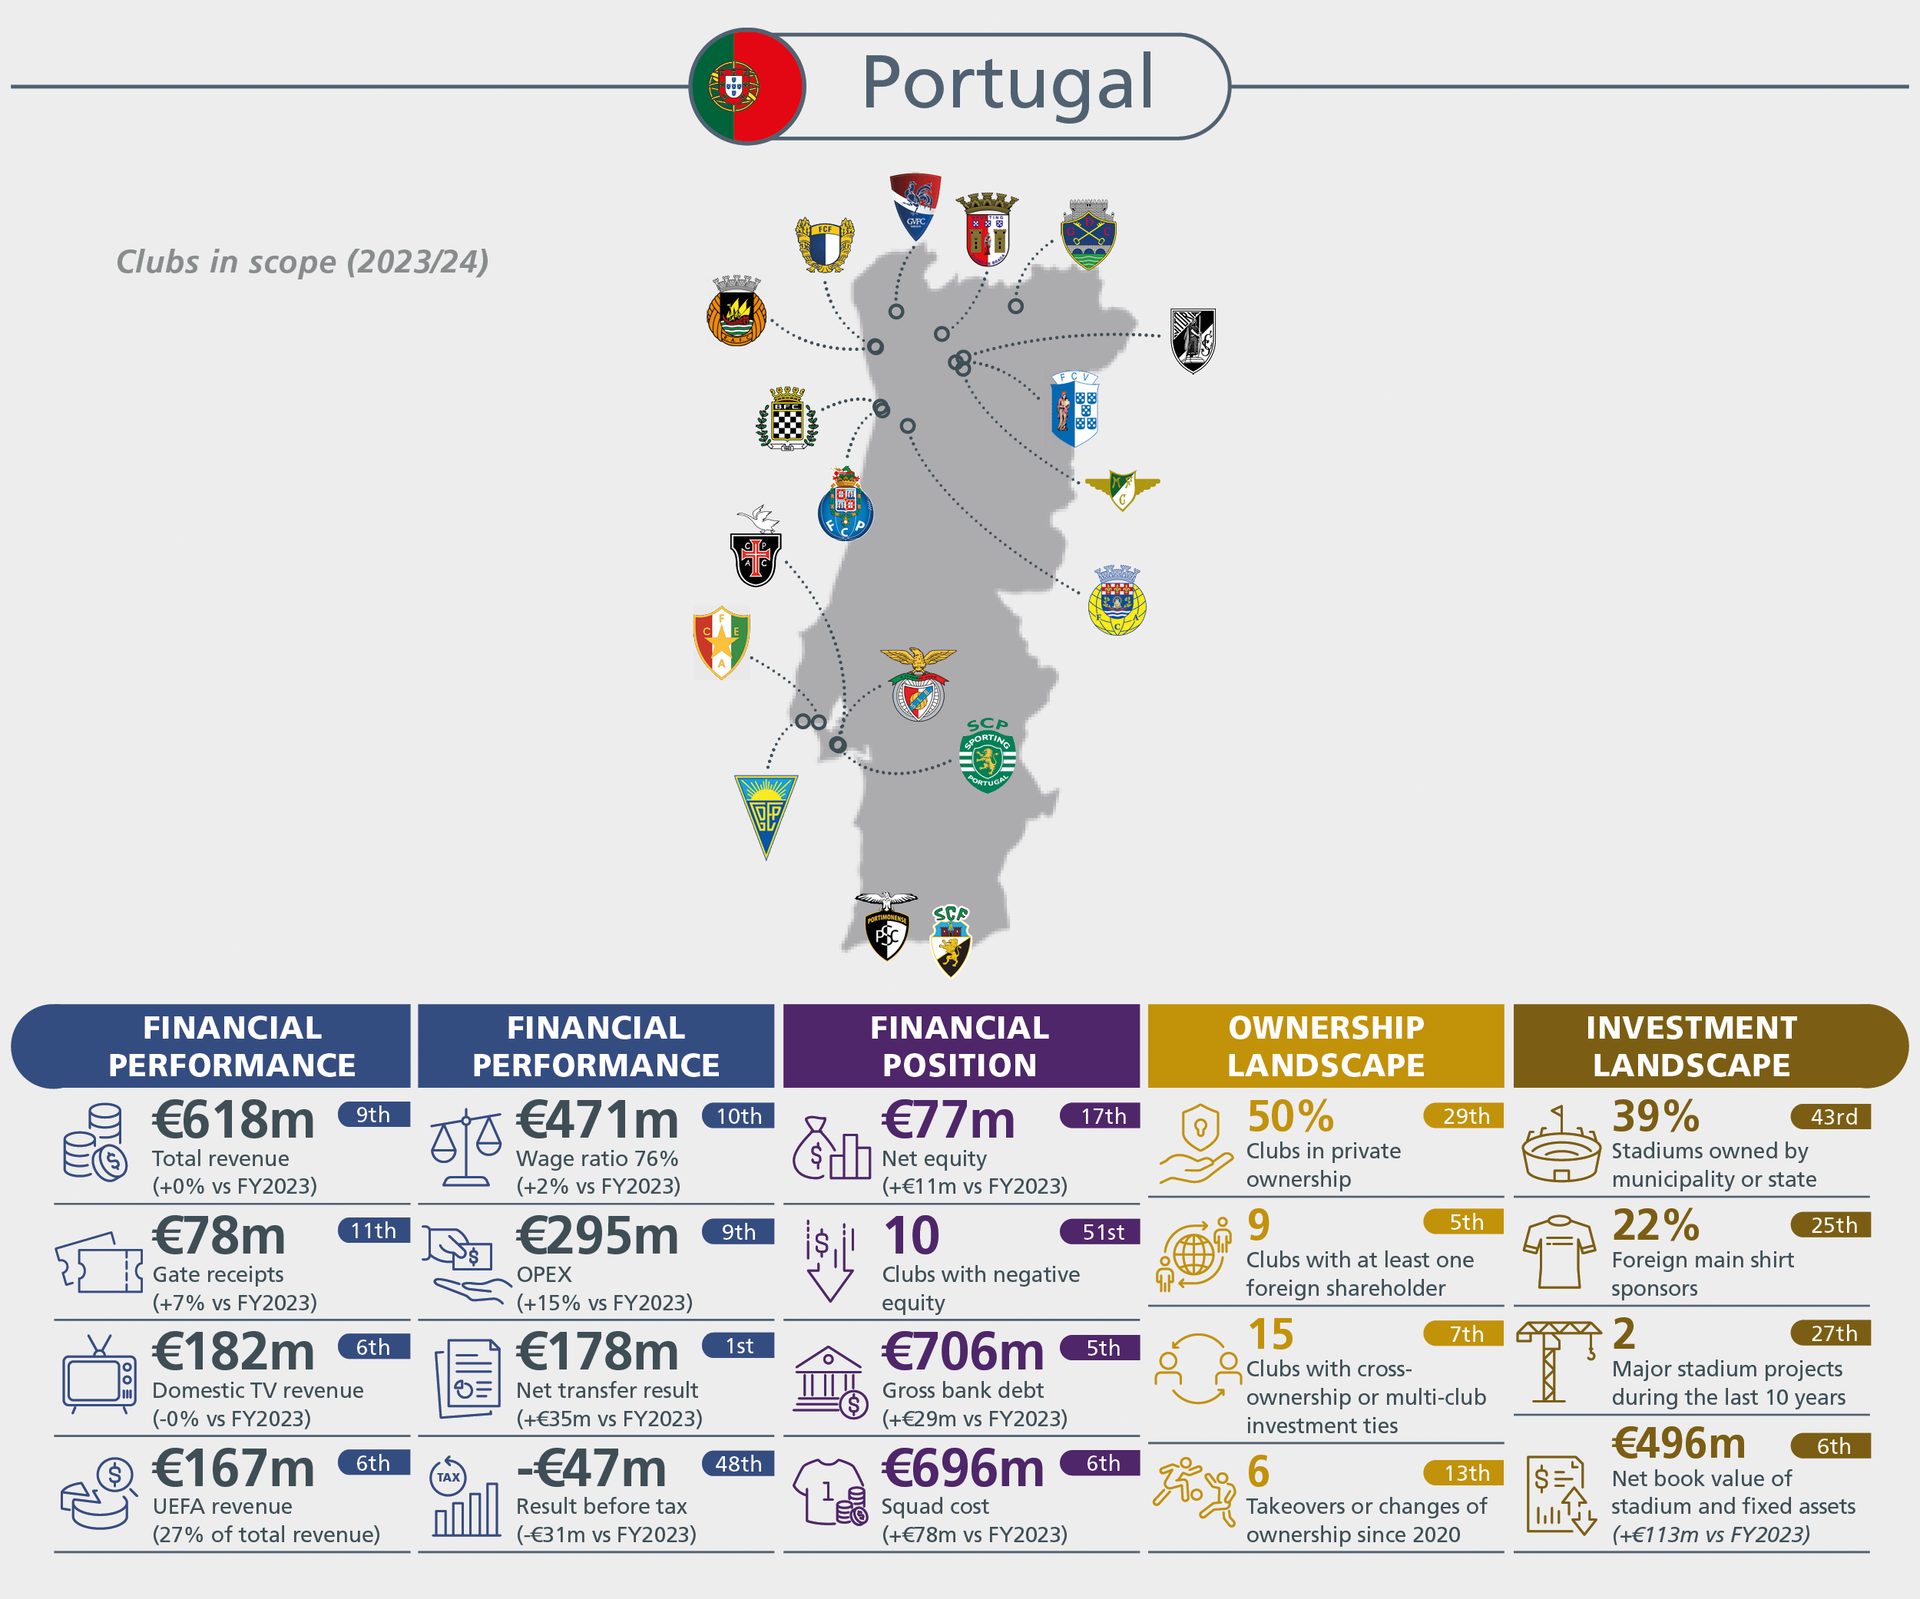
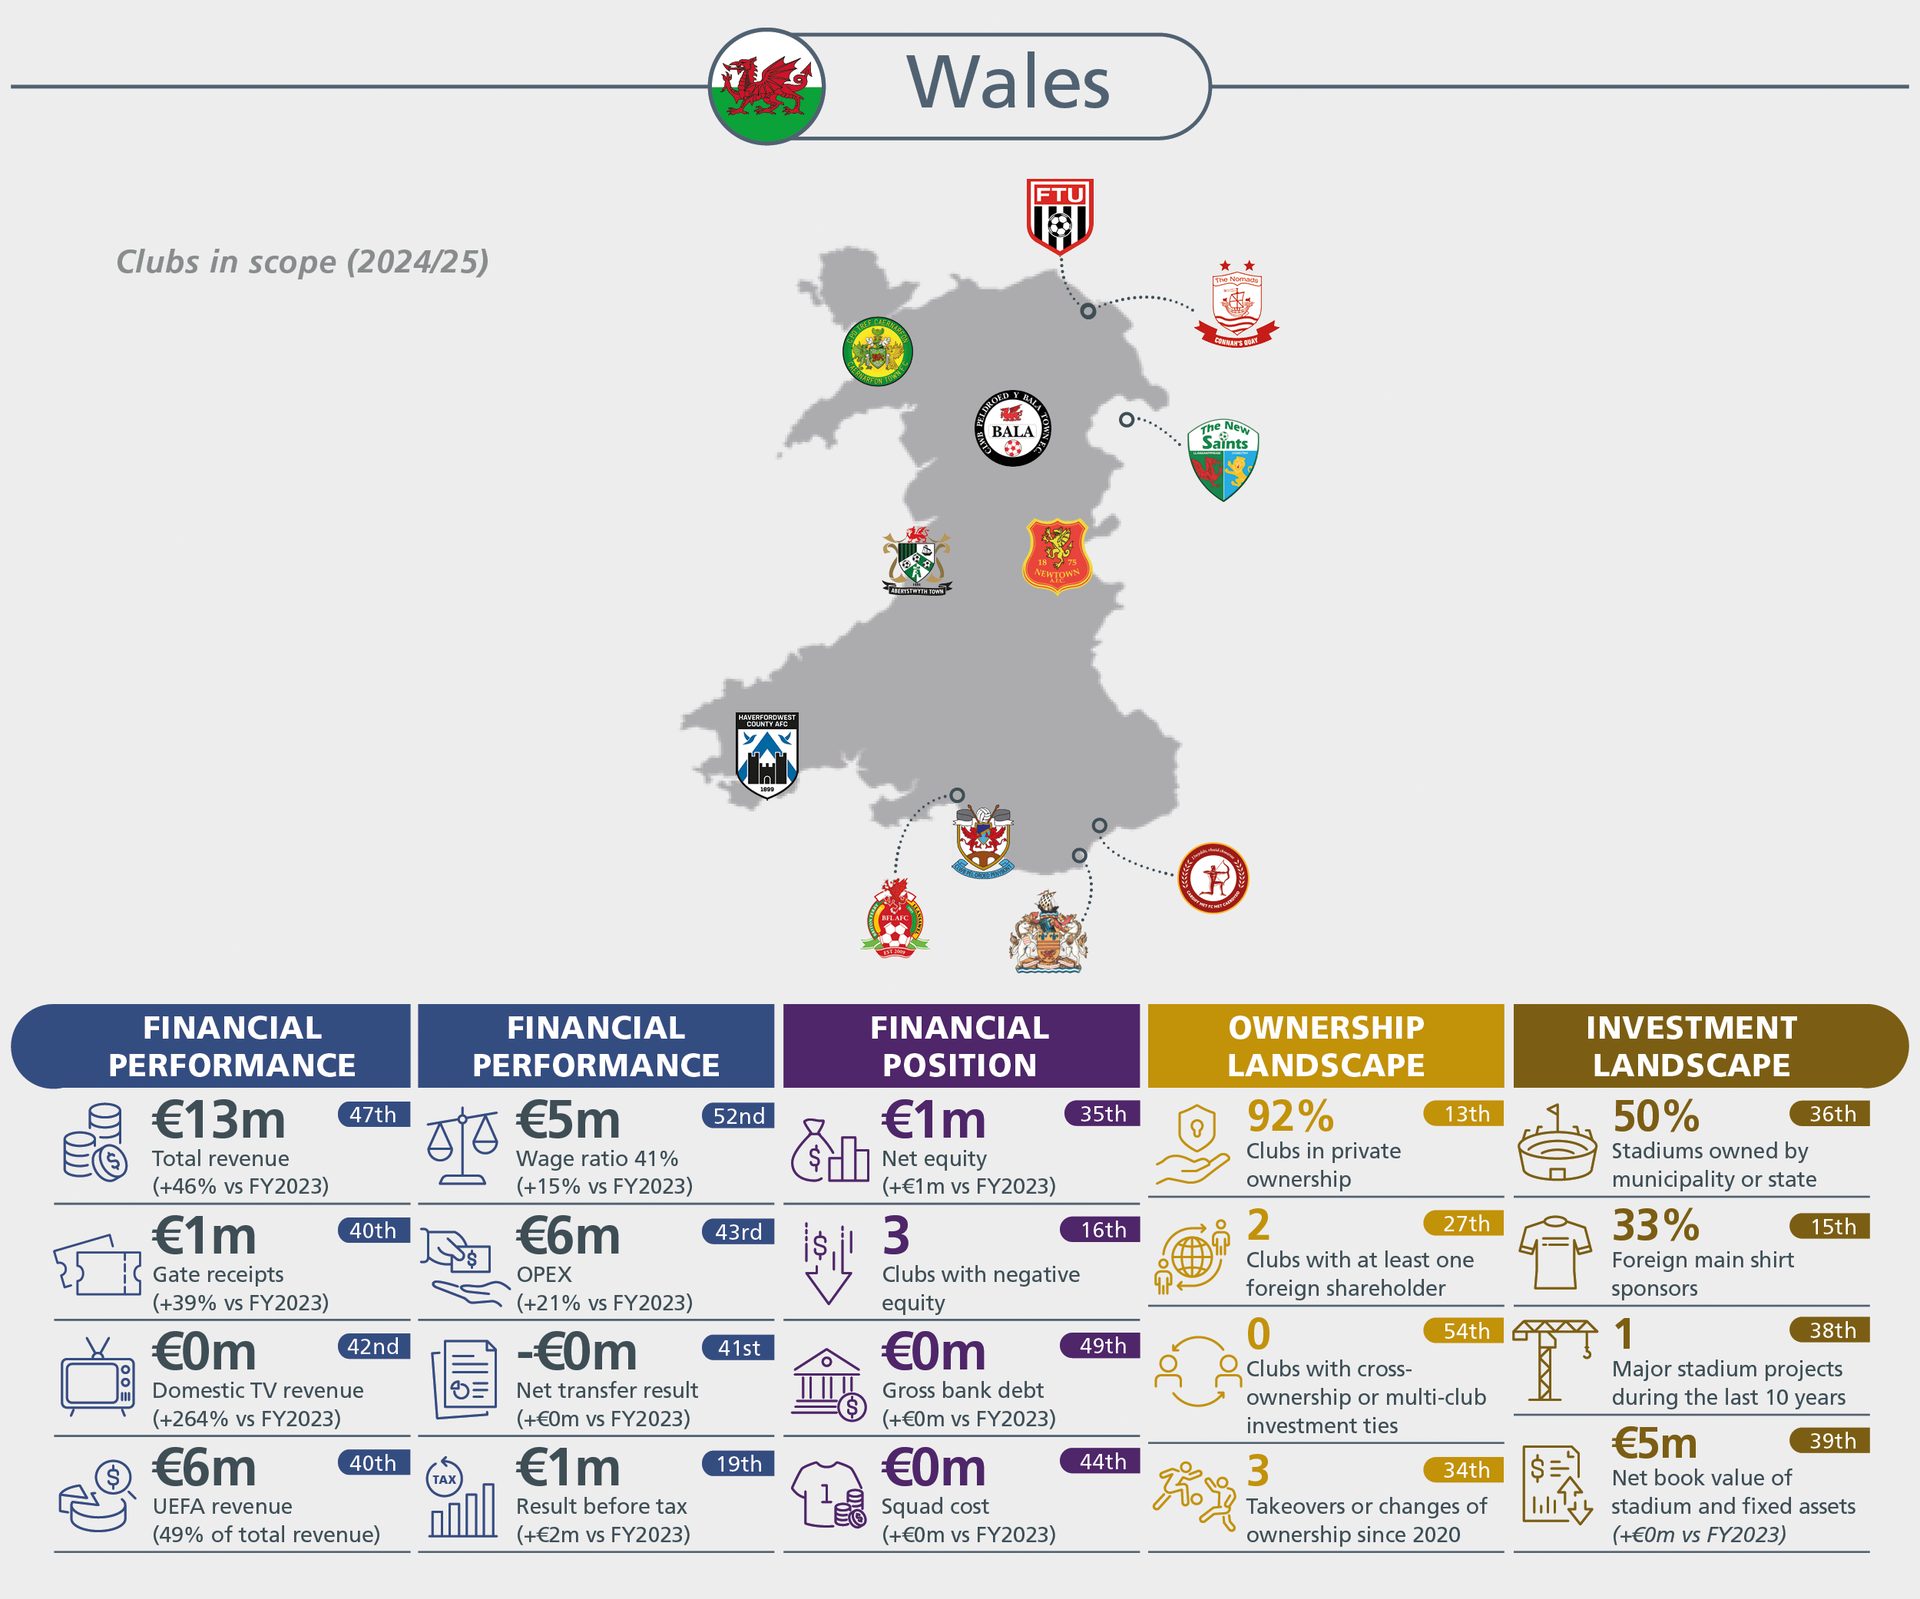
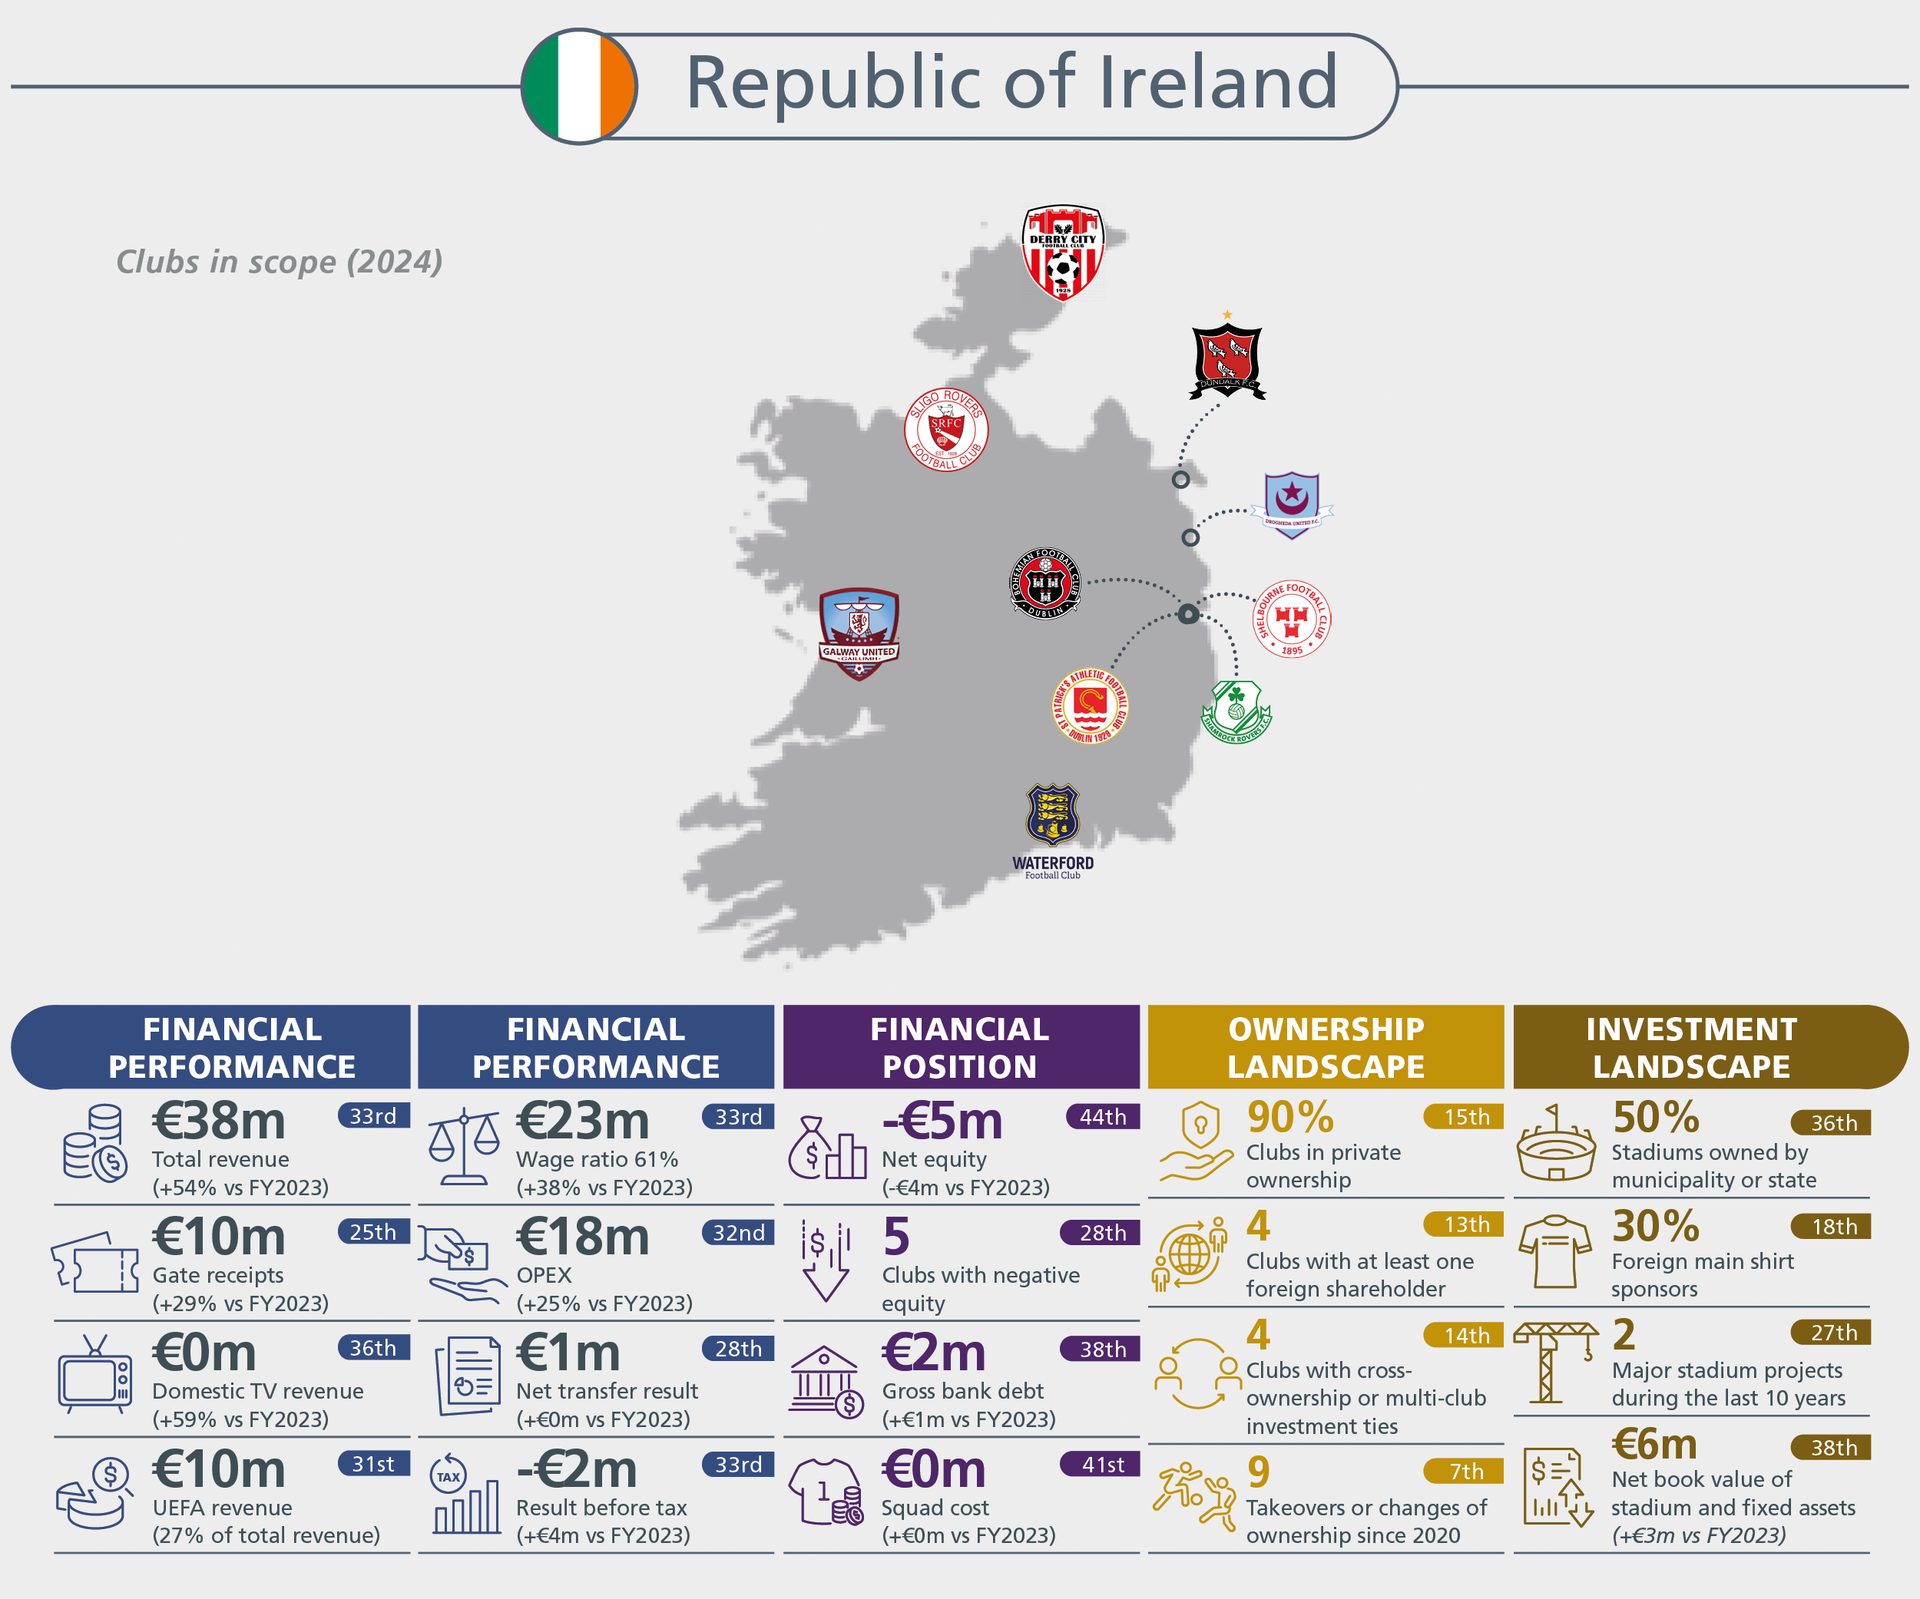
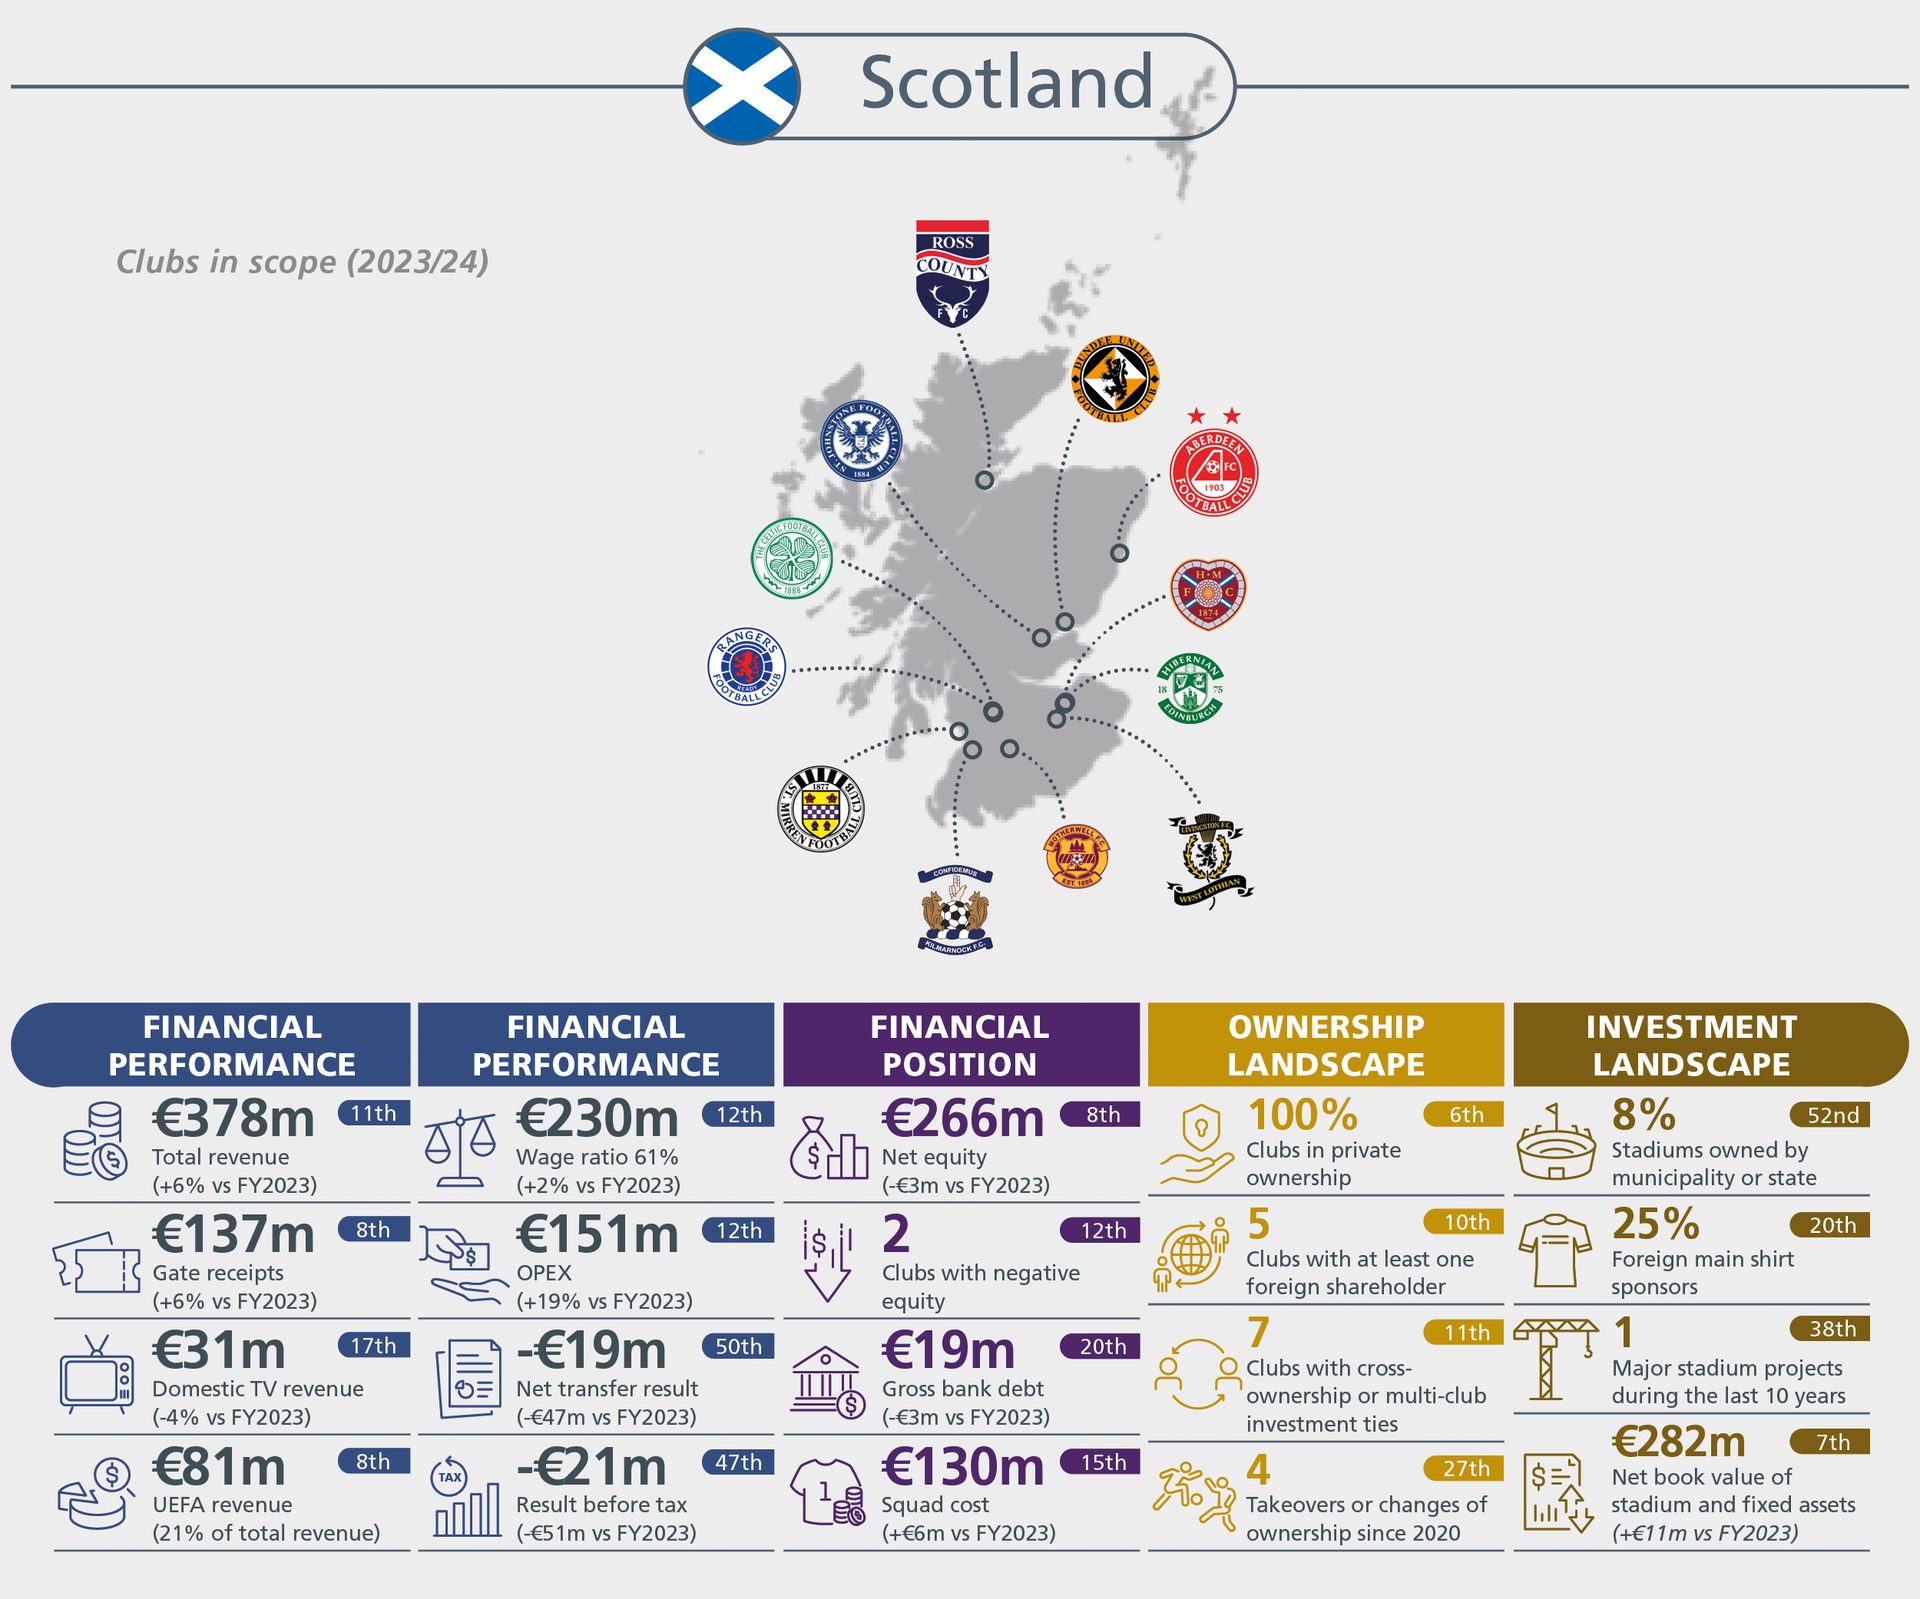
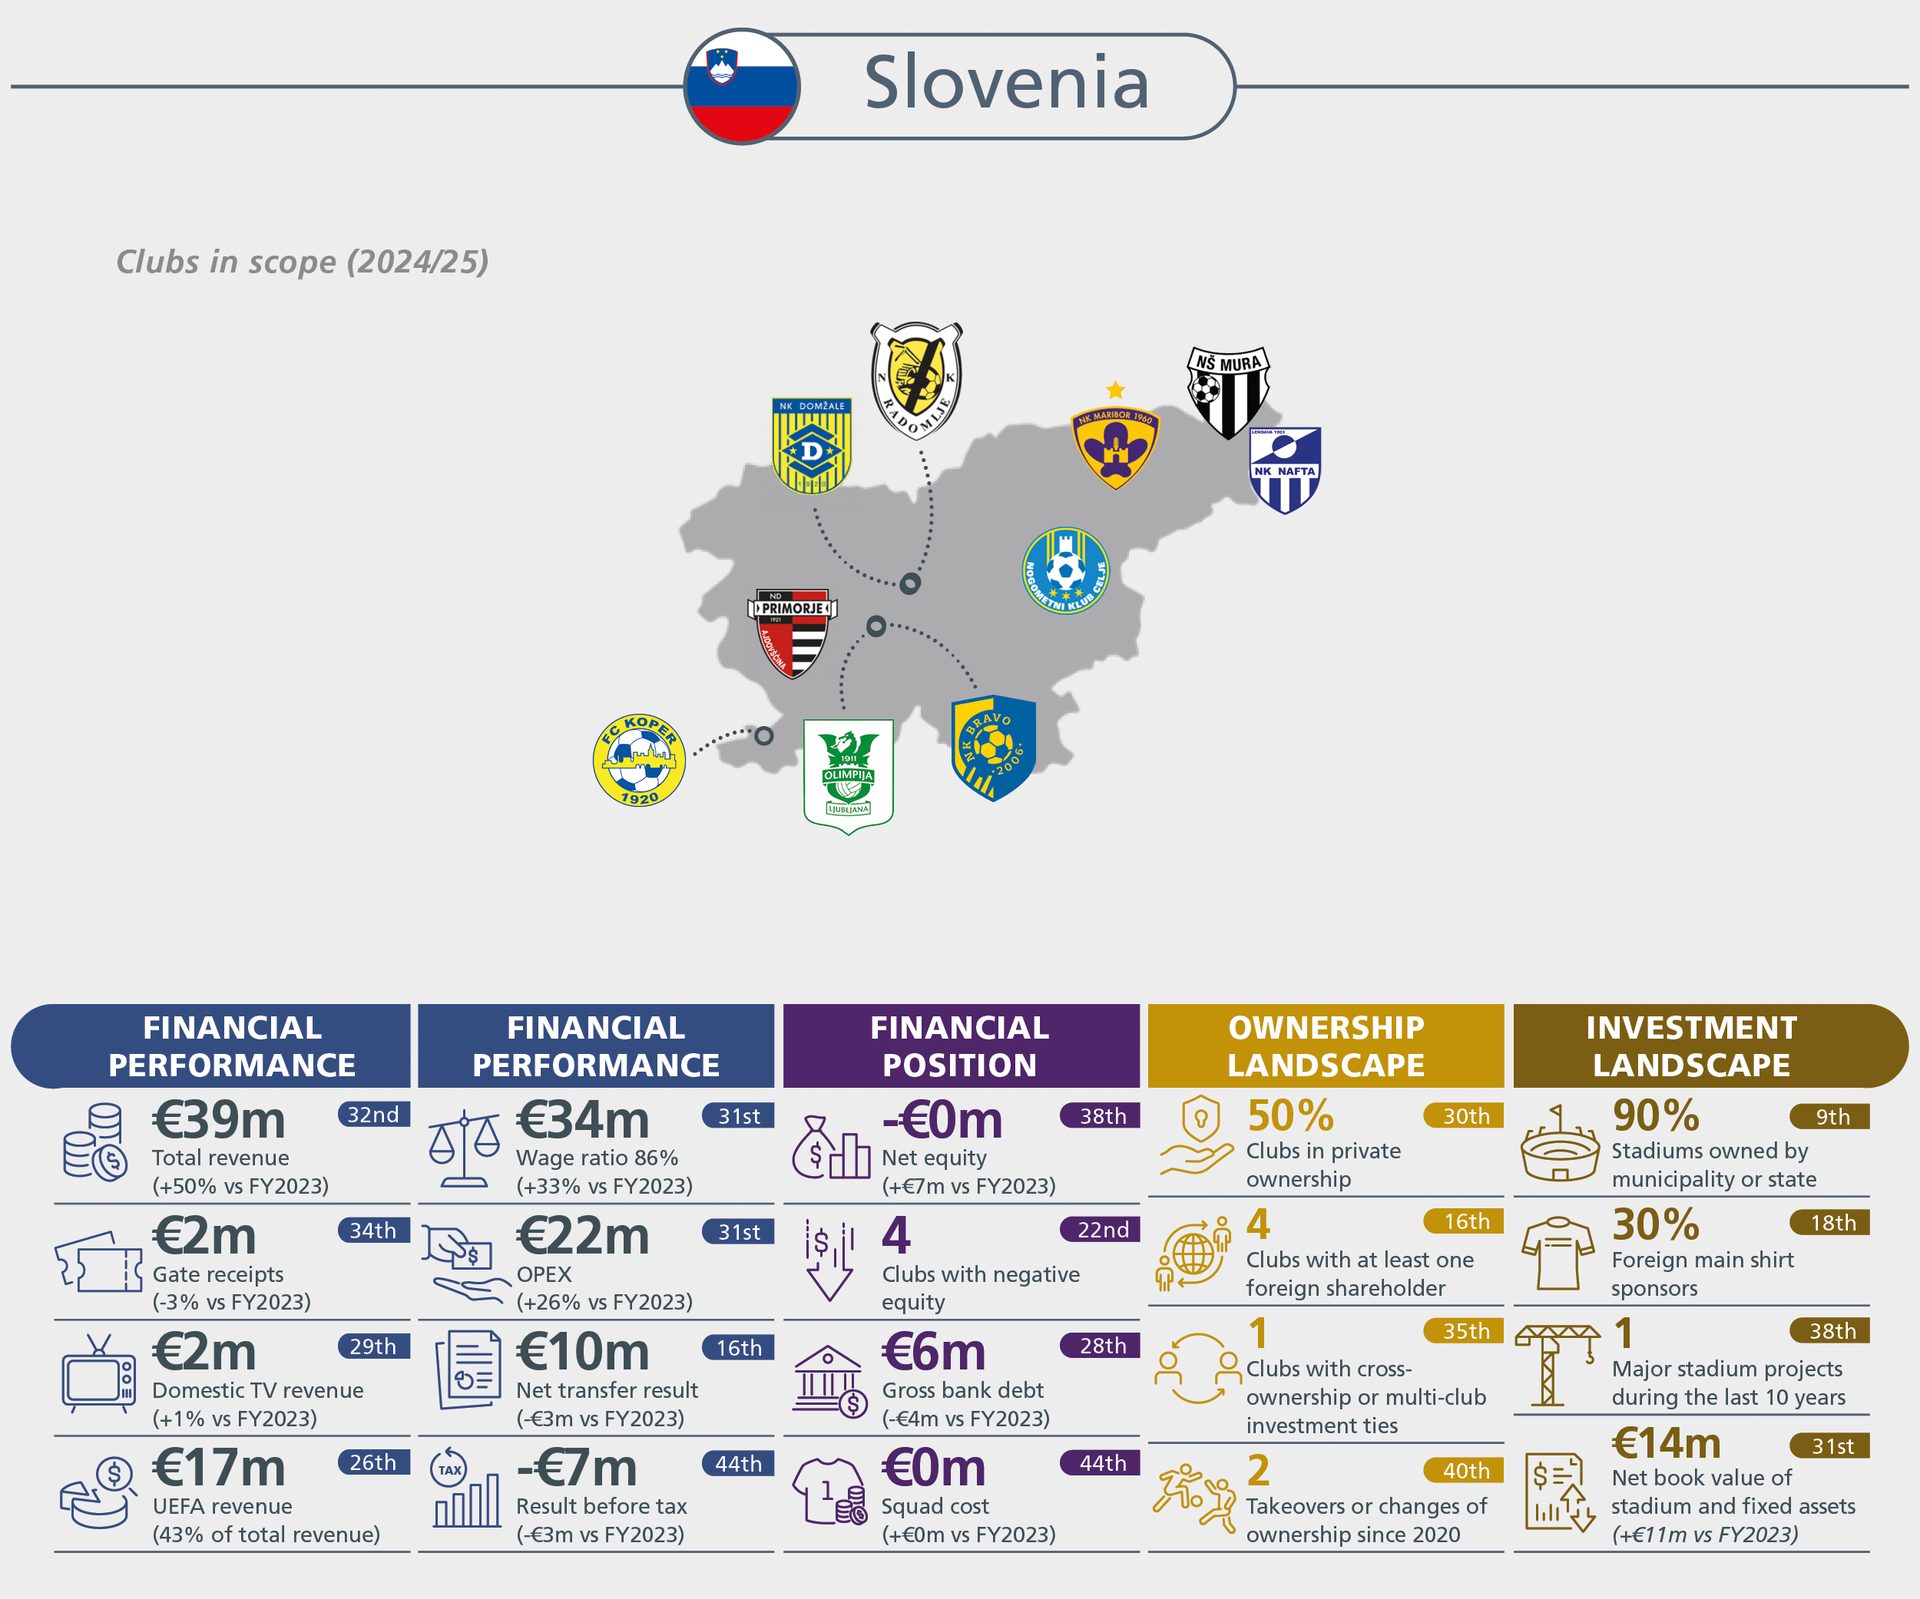
Leistungsken-nzahlen nach Land

Der Bericht umfasst weit mehr als nur die größten Klubs und Ligen.

Jedes Jahr werden über 700 Klubs analysiert, wodurch eine umfassende Momentaufnahme entsteht.

Auf der nachfolgenden Karte können die Vergleichszahlen der einzelnen Länder abgerufen werden.

Iceland
Denmark
Norway
Sweden
Faroe Islands
Scotland
England
Wales
Republic of Ireland
Northern Ireland
Portugal
Gibraltar
Spain
Andorra
France
Belgium
Luxembourg
Netherlands
Germany
Finland
Russia
Kazakhstan
Azerbaijan
Armenia
Georgia
Türkiye
Poland
Cyprus
Israel
Ukraine
Belarus
Lithuania
Latvia
Estonia
Slovakia
Hungary
Bosnia & Herzegovina
Kosovo
North Macedonia
Greece
Albania
Montenegro
Croatia
Slovenia
Austria
Czechia
Switzerland
San Marino
Italy
Malta
Romania
Moldova
Bulgaria
Serbia
Infographic detailing Northern Ireland football clubs' financial performance, ownership, and investment landscape.
Hungarian football clubs' financial, ownership, and investment landscape in 2024/25.
Infographic on Kazakhstan football clubs' financial performance, ownership, and investment landscape for 2024, with a map.
An infographic detailing Belarusian football clubs' financial performance, position, ownership, and investment landscape.
Luxembourg football clubs' financial, ownership, and investment overview, with club locations on a map.
Infographic detailing Belgian football clubs' financial performance, ownership, and investment landscape for 2023/24.
Infographic on Gibraltar football clubs' financial performance, position, ownership, and investment landscape (2024/25).
Infographic on Danish football clubs' financial performance, ownership, and investment landscape.
Infographic showing Norwegian football clubs' financial performance, position, ownership, and investment landscape.
Data on French football clubs (2023/24) covering financial performance, ownership, and investments.
Infographic details Czech football clubs' financial, ownership, and investment landscapes, with a map showing club locations.
Moldova football clubs infographic: financial performance, ownership, and investment landscape.
Infographic detailing financial, ownership, and investment landscapes of English football clubs for 2023/24.
Infographic: Greek football clubs' financial performance, ownership, and investment landscape (2024/25), with a map.
Overview of Bosnia & Herzegovina football clubs' financial performance, position, ownership, and investment.
Infographic on Kosovo football clubs (2024/25) showing financial performance, position, ownership, and investment landscapes.
Malta football clubs' financial, ownership, and investment overview for 2024/25.
Infographic detailing financial performance, position, ownership, and investment landscape of Italian football clubs for 2023/24.
Data visualization of Austrian football clubs' 2023/24 financial, ownership, and investment landscape.
Overview of Netherlands football clubs' financial, ownership, and investment data (2023/24) with map.
Infographic showing German football club locations on a map with financial, ownership, and investment metrics.
Infographic: Finland's 2024 football club financials, ownership, and investment landscape.
Infographic displaying Montenegro's football clubs, their financial performance, position, ownership, and investment.
Infographic on Croatian football clubs' finances, ownership, and investment for 2024/25.
Infographic on Icelandic football clubs' financial, ownership, and investment landscapes in 2024.
Overview of Israeli football clubs' financial performance, position, ownership, and investment landscape for 2023/24.
Financial and ownership statistics for football clubs in North Macedonia for the 2024/25 season.
Infographic on Albanian football clubs' 2024/25 financial, ownership, and investment data.
Andorra football clubs' 2024/25 financial performance, position, ownership, and investment overview.
Armenian football clubs (2024/25) financial data, ownership, investment, and geographic map.
An infographic showing financial, ownership, and investment landscapes of Bulgarian football clubs for 2024/25.
Infographic detailing Cypriot football clubs' financial performance, position, ownership, and investment landscape for 2024/25.
Infographic on Estonian football clubs: financial performance, position, ownership, and investment landscape in 2024.
Infographic on Faroe Islands football clubs' 2024 financial performance, ownership, and investment.
2024 financial, ownership, and investment overview of Georgian football clubs, including a map.
Infographic on Latvian football clubs' 2024 financial performance, position, ownership, investment, and club locations.
Infographic details Lithuania's football club landscape, covering financial, ownership, and investment metrics for 2024.
Infographic on Azerbaijan football clubs' 2024/25 financial performance, ownership, and investment data.
Infographic on Swedish football clubs' financial performance, position, ownership, and investment landscapes for 2024/25.
Infographic on Slovakia football clubs' financial performance, ownership, and investment, including a map.
Infographic on Serbian football clubs' financial performance, position, ownership, and investment landscape for 2024/25, with a map showing club locations.
Infographic displaying Romania's football clubs' financial performance, position, ownership, and investment landscape.
Infographic showing Swiss football clubs' financial performance, position, ownership, and investment landscapes for 2024.
San Marino football club stats: financial performance, position, ownership, and investment for 2024/25.
Infographic on Ukrainian football clubs' financial performance, position, ownership, and investment landscape.
Infographic on Turkish football clubs' 2024/25 financial performance, ownership, and investment landscape.
Infographic on Poland's football clubs: financials, ownership, and investment data for 2023/24.
Overview of Russian football clubs' financials, ownership, and investment landscape for 2024/25, with a club map.
Infographic on Spanish football clubs (2023/24) financial performance, position, ownership, and investment.
Infographic on 2023/24 Portuguese football clubs: financial performance, ownership, investment, and club locations.
Overview of Welsh football clubs' financial performance, position, ownership, and investment in 2024/25.
Overview of Republic of Ireland football clubs: financial performance, position, ownership, and investment.
Infographic on Scottish football clubs' financial performance, position, ownership, and investment (2023/24).
Slovenia's football clubs financial performance, position, ownership, and investment landscape for 2024/25.